Abstract
By analyzing backscattered echo signal power spectra and thereby obtaining backscatter coefficient vs. frequency data, the size of sub-resolution scatterers contributing to echo signals can be estimated. Here we investigate tradeoffs in data acquisition and processing parameters for reference phantom based backscatter and scatterer size estimations. RF echo data from a tissue-mimicking test phantom were acquired using a clinical scanner equipped with linear array transducers. One array has a nominal frequency bandwidth of 5–13 MHz and the other 4–9 MHz. Comparison of spectral estimation methods showed that the Welch method provided spectra yielding more accurate and precise backscatter coefficient and scatterer size estimations than spectra computed by applying rectangular, Hanning, or Hamming windows and much reduced computational load than if using the multitaper method. For small echo signal data block sizes, moderate improvements in scatterer size estimations were obtained using a multitaper method but this significantly increases the computational burden.
It is critical to average power spectra from lateral A-lines for the improvement of scatterer size estimation. Averaging approximately 10 independent A-lines laterally, with an axial window length 10 times the center frequency wavelength optimized tradeoffs between spatial resolution and the variance of scatterer size estimates. Applying the concept of a time-bandwidth product this suggests using analysis blocks that contain at least 30 independent samples of the echo signal.
The estimation accuracy and precision depend on the ka range where k is the wave number and a is the effective scatterer size. This introduces an ROI depth dependency to the accuracy and precision because of preferential attenuation of higher frequency sound waves in tissue-like media. With the 5–13 MHz transducer ka ranged from 0.5 – 1.6 for scatterers in the test phantom, which is a favorable range, and the accuracy and precision of scatterer size estimations were both within ~5% using optimal analysis block dimensions. When the 4–9 MHz transducer was used, the ka value ranged from 0.3 to 0.8 – 1.1 for the experimental conditions, and the accuracy and precision were found to be ~10% and 10% – 25%, respectively. Although the experiments were done with two specific models of transducers on the test phantom, the results can be generalized to similar clinical arrays available from a variety of manufacturers and/or for different size of scatterers with similar ka range.
I. Introduction
Ultrasound is a widely used, non-ionizing, and cost-effective diagnostic imaging modality. Images are created using broadband pulses centered at a chosen frequency. The envelope of the echo signals is derived from radiofrequency (RF) echo data, and this information is converted to an amplitude modulated gray scale B-mode image. The frequency content of backscattered ultrasonic data, which may be derived from the RF echo signals, is not generally utilized, even though it contains useful clinical information as reported by researchers for 30 years [1–6]. For example, the size of sub-resolution scatterers can be derived through careful analysis of the backscatter coefficient vs. frequency, and the “acoustic concentration” (defined as the product of the scatterer number density times the relative impedance difference between the scatterers and surrounding tissues) can be estimated from the backscatter amplitude and derived scatterer size information [7–12].
In this paper we consider the problem of constructing parametric images of scatterer sizes [12] by analyzing the Fourier spectra of windowed RF echo data. Here the incoherent scattering component is considered the signal, and the echo signal power spectrum is fit to a theoretical model to calculate an effective scatterer size. To gain better spatial resolution short duration analysis windows are needed, but they increase the importance of edge effects [13] and often yield noisy power spectra estimates. Speckle due to random locations of scatterers and electronic noise also are sources of fluctuations in ultrasound backscatter measurements. Large axial window lengths and averaging over independent beam lines are often used to reduce such effects and therefore, improve the accuracy and precision of backscatter estimates. Lizzi et al. [1] suggested averaging 5–10 A-lines, while Madsen et al. [5] recommended 25 and Topp et al. [14] found 20 were sufficient. Most approaches apply long duration analysis windows, 6 μs or greater, but this compromises axial resolution.
For short duration axial windows, an iterative technique for broadband backscatter measurements is described by Madsen [15]. Chen et al. [16] reported that backscattered power spectra do not agree with expected model results if a 2-microsecond window (2.5 wavelengths at a 2.5MHz center frequency) is used. However, when the window size was increased to 5-microseconds, the measured results agreed with those from the model, and larger windows made the fit even better [16]. A Hamming window gave better accuracy at regions close to the frequency limits of the available power spectrum than a rectangular window. Wear [17] also showed larger (Hamming) window lengths yielded more precise spectral parameter estimates. Bigelow and O’Brien [18] demonstrated that despite its high side lobes, the rectangular window gave slightly better scatterer size estimates than a Hanning window, especially for a strongly focused source. Topp et al. [14] found experimentally that a 10-wavelength window (Hanning) gave window-length independent backscatter spectral slopes (therefore, reasonable accuracy) for different single element transducers operated at 3.5, 7.5, and 10MHz. Huisman and Thijssen [19] reported that data over larger lateral widths and greater axial lengths gave better accuracy and precision. Oelze and O’Brien [20] considered lateral resolution and axial window length at the same time and found the optimal choices for their scatterer size estimation method is 4–5 beam-widths and 15–20 pulse lengths using a Hanning window.
For the sake of improving the resolution while accounting for window edge effects, a gate-edge correction factor was introduced by Oelze and O’Brien [21]. By applying this correction, accuracy to within 5% of actual values may be achieved at window lengths that are less than 5 pulse lengths. However, the correction factor can be found only if the excitation pulse, frequency-dependent attenuation, and backscatter are known or properly approximated. Also, their derivation is based on a single element transducer and would be difficult to transfer to a clinical array, where dynamic aperture control, dynamic focusing, and apodization are applied.
Gerig et al [12] derived expressions for the variance of reference phantom based scatterer size estimates [4]. These yield results that are in reasonable agreement with simulated and physical phantom data. Smaller variances occur at larger window lengths, use of a greater number of independent sample (and reference) waveforms in computing the echo signal power spectra, and a wider bandwidth.
The purpose of the work described in this paper is to study window parameters and combinations of independent A-lines needed to gain both acceptable accuracy and precision of scatterer size estimates with a clinical scanner and a reference phantom analysis scheme. Results will be compared for different types of gating windows, window lengths, and different power spectra estimation methods. Moreover, the possibilities of a depth dependence on scatterer size estimations, not reported in previous studies [12, 22, 23] is also considered. This work will discuss the frequency range changes (hence, size estimation changes) over depth.
II. Methods
II.A. Backscatter and Scatterer Size Estimates
Scatterer size estimates are performed using a reference phantom method [4], whereby echo signals from a sample and from a reference phantom are acquired using the same transducer and machine settings. Yao et al. [4, 24] have shown that this approach accounts for system-dependent factors in backscatter and attenuation coefficient estimations. Using the reference phantom method, the backscatter coefficient of a sample, σs(ω) is given by [25]:
| (1) |
where S stands for the echo signal power spectrum, σ is the backscatter coefficient, z is the depth, α is the attenuation coefficient, and ω=2πf is the angular frequency. The subscripts s and r refer to the sample and reference respectively, and the speed of sound is assumed to be the same for the sample and the reference. Using a Gaussian spatial autocorrelation function (SAF) for the theoretical backscatter model, the effective scatterer size is given as [12, 26]:
| (2) |
where y(ω) = 10 ln(σs(ω)/ω4), , and c is the speed of sound.
The variance of the backscatter coefficient and scatterer size estimate is given by [12]:
| (3) |
| (4) |
where Ns and Nr represent the number of independent sample and reference waveforms used to calculate the spectral averages, respectively, and the summation is limited to frequencies for which the associated backscatter estimates are uncorrelated. The interval between uncorrelated estimates is a function of the data window type, and is inversely proportional to the window length. Theoretically, the frequency resolution using different gating window sizes can be approximated according to Lizzi et al [27]:
| (5) |
where Δf is expressed in MHz, ε = 1 and 2 (M H−1 z·m m−1) for the Hamming and rectangular windows, respectively, and L is the window length in units of mm. It can also be determined experimentally by estimating the correlation of backscatter estimates. Rearranging equation (4), the fractional standard deviation of the size estimates is:
| (6) |
where â is in units of mm.
II.B. Acquisition of Data from Phantoms
The large, homogeneous part of a previously described “effective frequency phantom” [28] was scanned using a Siemens SONOLINE Antares scanner (Issaquah, WA, USA) equipped with a 9.5 MHz VFX13-5 linear array operated at 10 MHz (screen setting), or a 6 MHz VFX9-4 linear array transducer driven at 6.15 MHz (screen setting). Inspection of spectral data showed that these frequency settings yield the broadest useable bandwidth (−15 dB) RF signals for the two probes. The VFX13-5 transducer covers an ROI to a depth of 5 cm, while the VFX9-4 can cover up to a 9 cm depth. Although our experiments were done with these two specific models of transducers, the results can be generalized to similar clinical arrays available from a variety of manufacturers.
Echo signals from 21 independent (uncorrelated) planes were acquired by translating the transducer in the elevational direction by a distance (~ 5 mm) greater than the elevational aperture and acquiring radiofrequency echo signals. These were used as “sample” data, and signals from another 20 independent planes were used as “reference” data. Each plane acquired using the VFX13-5 transducer consisted of signals along 312 acoustic scan lines, separated by 0.120 mm. The transmit focus was at 2 cm, the transmit F-number was 1.33, and the receiving F-number was maintained at 0.5 until the aperture limit was reached. Each plane acquired using the VFX9-4 transducer consisted of echo signals for 236 acoustic scan lines separated by 0.158 mm. The transmit focus was 7 cm, the transmit F-number was 2, and the receiving F-number was 0.5 to the maximum depth possible.
The speed of sound in the homogeneous medium of the tissue mimicking phantom is 1,540 m/s, the density is 1.04 g/cm3, and the attenuation is 0.5 dB/cm/MHz, with a linear frequency-dependence around 5 MHz, as designed [28]. Glass-bead scatterers are placed spatially at random in the background medium. The concentration is 1.36 mg/cm3, or ~9190 scatterers/cm3. The speed of sound and density of the beads are 5,572 m/s and 2.54 g/cm3; and the Poisson’s ratio is 0.21. The bead diameter distribution measured by Wilson et al. [28] fits a normal distribution where the mean is 48.1 μm and the standard deviation is 6.8 μm. The Gaussian model scatterer size estimated in this paper is an “effective” size and is not the physical scatterer size of the glass beads. A Gaussian SAF model is a good model describing the backscatter coefficient vs. frequency shape of the glass beads (with a conversion factor) and is often applied for soft tissue. Over the frequency range of 0 – 15 MHz, the effective scatterer diameter is ~69 μm for ~48 μm physical diameter glass beads [29] based on Gaussian model backscatter vs. frequency data for the frequency range tested.
Because the reference and sample phantoms were identical, there was no need for attenuation corrections between sample and reference.
Computer simulations were also done using the frequency domain ultrasonic simulation model developed by Li & Zagzebski [30] and confirmed with the experimental results.
III. RESULTS
III.A. Determining the number of independent A-lines
For both transducers, the adjacent acoustic scan line signals are correlated. To determine the number of independent A-lines in a ROI, the correlation coefficient was measured between neighboring A-lines using:
| (7) |
where xi and yi are RF echo signal values for A-lines x and y, respectively, at data value axial position i in the subregion of the echo data, and x̄ and ȳ are the sample mean values within this subregion. The summation is over i. The correlation coefficient between RF data segments was calculated as follows. For each reference phantom image, we calculated the correlation coefficient between pairs of 1-cm RF-echo signal segments centered at a 1cm, 2cm, and 3cm depth for VFX13-5 experiments, and at 3, 5, 7, and 8.5 cm depths for VFX9-4 experiments on beam lines within 2 cm of the center of the image. Thus, correlation coefficients between segments from RF beam lines 1 and 2, 2 and 3, and so on were averaged to get the covariance between adjacent beam lines. The correlation coefficients between segments 1 and 3, 2 and 4, and so on were averaged to get the correlation between every other beam line. Beam-line separations were used to determine the lateral distance between these segments. The results were then averaged over all 20 reference-phantom images.
From the correlation coefficients between the A-lines, we can calculate the number of effective, independent A-lines according to [31]:
| (8) |
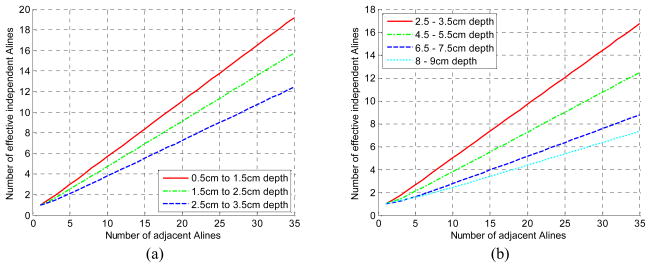
where N is the total number of A-lines contained within an ROI, m is the A-line separation in units of the pitch of the A-line, and ρ is the correlation coefficient. Figure 1(a) shows the number of effective, independent A-lines calculated for the VFX13-5 transducer at a center frequency setting of 10 MHz and using a 2 cm transmit focus. Figure 1(b) is for the VFX9-4 at 6.15 MHz and a 7 cm transmit focus. For both transducers, shallower depths yielded a higher number of independent A-lines than deeper regions. Note these data depend on the actual A-line spacing, where the values for our transducers are reported in the methods section.
Fig. 1.
Number of effective, independent A-lines calculated from echo data for (a) the VFX13-5 transducer using a center frequency setting of 10MHz and a 2cm transmit focus and (b) the VFX9-4 transducer, using a center frequency setting of 6.15MHz and a 7cm transmit focus.
III.B. Spectral estimations
The first step in scatterer size imaging is to obtain power spectra estimates for echo data from the sample and reference. The power spectral density (PSD) can be estimated by averaging a number of periodograms. A standard periodogram uses a rectangular window; it is called a modified periodogram when a window such as a Hann (also called Hanning) window is used to reduce the spectral leakage. The periodogram power estimator is based on a single sample of a filtered version of the signal under study. However, the variance of power spectrum estimation is large [32], so we applied alternative spectral estimators and different averaging schemes.
In addition to a Hanning and a Hamming windows, we applied the Welch method, a refined periodogram technique wherein the estimated spectrum is an averaged periodogram of overlapped, windowed signal sections. We computed PSD’s using different windows in various overlapping pieces of the signal from a 4 mm ROI [33]. We employed a Welch sub-window size of 2 mm with a 50% overlap (50% minimizes the variation [32]). A Hamming window was applied to each of the Welch sub-windows. A section size that is half of the original window, with 50% section overlap, reduces the variance of spectral estimates to less than half of the variance using a periodogram for the same window [32]. The reduced variance is a tradeoff with reduced spectral resolution, so the section length cannot be too small. In addition, the more modern, modified periodogram, “multitaper” method [34] (estimate from a combination of multiple orthogonal windows) was also used in spectral estimates for comparison. The multitaper method reduces the variance of spectral estimates by using a small set of “tapers,” or orthogonal windows, devised to minimize spectral leakage due to the finite length of each data segment. We applied the Thompson algorithm [34, 35]. The algorithm combines a set of independent modified periodograms from each RF data segment. The periodograms are computed by multiplying the data set by a set of orthogonal tapers (windows in the frequency domain) specified from discrete prolate spheriodal sequences (known as Slepian sequences [34, 36]) of a time bandwidth product of 3 (5 orthogonal tapers for the analysis done here). The time-bandwidth product selection is task dependent, exhibiting a tradeoff between the spectral resolution and variance of the spectral estimates, but values in the range of 2 – 4 are typical choices. In our work, data processing was done using Matlab (Mathworks, Inc., Natick, MA, USA).
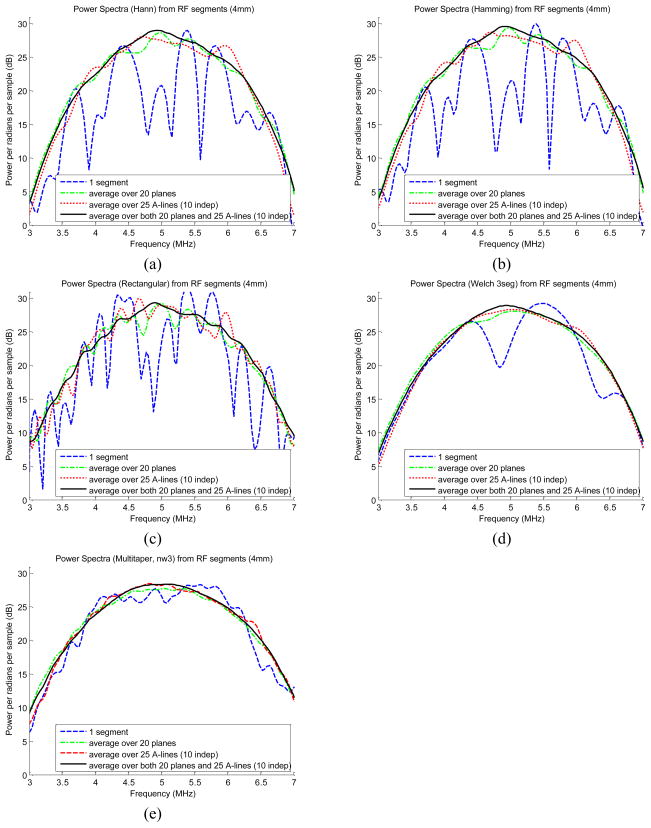
Echo signal power spectra estimated from different methods are illustrated in figure 2(a–e). The dashed curve (with the legend “1-segment”) is a typical result for a single 4mm analysis window. Averaging, of course, reduces the spectral fluctuations that result from the random scatterer locations. As we increase to 25 adjacent A-lines (equivalent to ~10 independent A-lines according to figure 1), then 25 A-lines over 20 independent planes, this yields a smoother spectrum. In the literature on ultrasonic backscatter and scatterer size measurements, Hann and Hamming windows are both frequently used by different authors. Compared to a Hann window, a Hamming window applies greater weight to the edge points. However, the spectral estimates are almost identical with the Hann and the Hamming windows, as we see from figures 2(a) and (b). If we average a significant number of spectra (e.g., 20 planes each with 25 A-lines, therefore ~ 200 independent A-lines), the periodogram results are essentially the same as the ones using the Welch method or the multitaper method as shown in the figures. However, the Welch method significantly improves the quality of the power spectra when a much lower number of data segments is used to estimate the PSD. Our experimental results show that averaging 10 independent segments yields very good spectra using the Welch method with a relatively small, 4mm window.
Fig. 2.
Power spectra estimates using (a) a Hanning window periodogram, (b) a Hamming window periodogram, (c) a rectangular window periodogram, (d) the Welch method, and (e) the multitaper method.
Compared to the Welch method, we found that when spectral estimates were averaged over more than 10 independent A-lines, the performance improvement of scatterer size estimates using the multitaper method does not justify the increased computational load. Therefore, the Welch method is a natural choice for echo signal spectral estimates from tissue. However, when a small lateral analysis region (few A-lines) is required, the multitaper method may be advantageous. This approach will be the subject of a future report.
III.C. Spectral smoothing
According to equation (5), the frequency resolution using different spectral estimation examined in this paper is about 0.2 – 0.3 MHz. This corresponds to more than 5 points if a 1024-point FFT is used for the 40 MHz sampling frequency of the Siemens Antares machine. We do a 5-point outlier-trimmed moving average to smooth the measured power spectra. However, these power spectra, which are estimated using the Welch method and are averaged over 10 independent A-lines, are already fairly smooth. We find that for scatterer size estimations, doing the spectral smoothing only yields small differences in most of the cases (less than 1% differences when a spectrum is averaged over ~10 independent A-lines). We also tried to smooth the spectra using a large order polynomial fit, as suggested by Hall et al [37]. Again, the differences are negligible in most cases. Bigelow and O’Brien [38] pointed out that errors in size estimates may be caused by the gradual changes to the spectra resulting from the random scatterer spacing, instead of fast fluctuations (if any). They found that trying to remove fast spectral fluctuations using homomorphic deconvolution does not provide improvements of size estimates since the backscattered spectra usually are smooth already. So, further spectral smoothing other than a small kernel moving average or polynomial fits on the entire spectrum may not be necessary. This is understandable because scatterer size estimators automatically act as a low pass filter on the backscatter coefficient vs. frequency curve.
III.D. Performance of sample backscatter coefficient (BSC) estimation
Averaging spectra over adjacent A-lines can significantly reduce spectral fluctuations, but it reduces the lateral resolution of the scatterer size image. To quantify this fluctuation and relate to the backscatter measurement, we define a “BSC noise index per sample point”:
| (9) |
where σ̑s is the measured backscatter coefficient of the homogeneous sample, σs is the true backscatter of the sample (determined by the size of glass beads in the test phantom and the Gaussian SAF model in this paper), and nf is the number of frequency points in the bandwidth used to estimate the scatterer size. The estimated backscatter may be treated as the true backscatter contaminated with noise (or error). If there is no noise present, the T value will be zero, indicating the backscatter estimation is perfect. Because the amplitude of the backscattered signal varies significantly with frequency, a ratio is used instead of the absolute difference. One can expect that as the analysis block size (or corresponding time-bandwidth product) increases, averaging uncorrelated estimates tends to cancel out the noise; hence, the T value will decrease.
Here the BSC and size estimations are done over a block or ROI (i.e., a rectangular region that contains several A-line segments of rf data). To study the block size (lateral and axial size) dependence of the BSC and scatterer size estimations, the data were analyzed as follows. The BSC and size estimations were generated for several depths using equation (1) for backscatter, then equation (2) above for scatterer sizes. The axial block sizes (therefore, axial resolution) were varied from 3 to 21 wavelengths, where the wavelengths were calculated from the center frequency of the power spectra at each depth. To study the lateral size dependency, we did not actually average periodograms laterally. Instead, we averaged periodograms at the same line location from different uncorrelated image planes. Hence, each A-line for which spectral data are averaged is independent. We averaged the data from 1 to 21 sample scan planes. Equivalently, the maximum number of independent A-lines to be averaged is 21 for the sample. For the reference phantom, we used 20 scan planes, and the reference power spectrum at each Aline location is the average of not only the 20 scan planes but also 19 adjacent A-lines (9 to the left and 9 to the right of itself) in each plane. According to figure 1, 19 adjacent A-lines for different transducer and different depths can provide 5 – 11 effective, independent A-lines. Therefore, each reference power spectrum is averaged over about 100 – 220 effective, independent A-lines. This number is much more than the 1–21 independent A-lines used in the sample. Therefore, the BSC variances measured from the sample are mainly from the variance of the sample data. The reference variance, in most cases, only contributes a few percent to the measured sample BSC variance. The T-values and the scatterer size estimates (section III.E.) are mean values of results within the central 3cm (laterally) for each depth. The standard deviations of the data are calculated over the same regions.
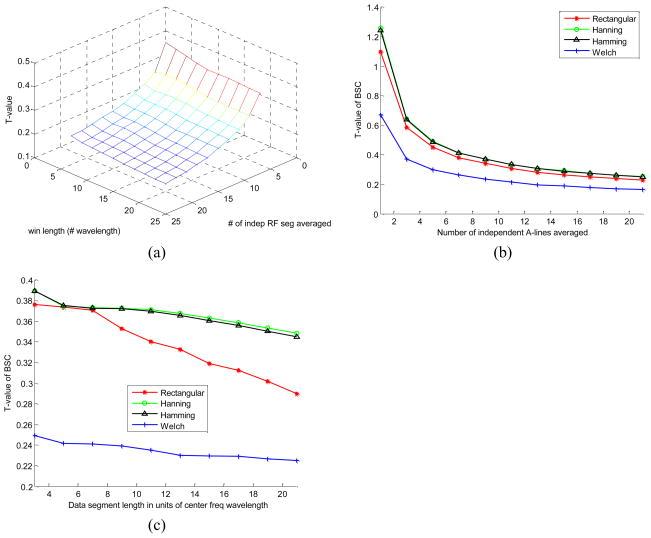
Figure 3 shows the T-values obtained with data from the VFX13-5 transducer focused at 2cm. Figure 3(a) displays the T-value using the Welch method vs. the number (1 – 21) of independent RF segments for averaging spectral values and for different RF segment sizes (3 – 21 center frequency wavelengths). The T-value has a slope that decreases when the number of independent RF signal segments used to compute the spectra increases, while it decreases more slowly as window length increases. The same trend was observed for the results from the VFX9-4 data. Very similar T-value results were obtained at other depths (1 and 3cm for the VFX13-5 data and 3, 5, 7, and 8.5cm for the VFX9-4 data), indicating that the depth dependence on the T-value is small. Figure 3(b) displays the T-value using an 11-wavelength window-length vs. the number of independent RF segments from which spectra were averaged, while figure 3(c) displays the T-value using 9 independent RF segments vs. window-length in units of center frequency wavelength. The Welch method BSC fits the true BSC curve the best, i.e., it consistently yields the lowest T-values. The reduction of the T-value using the Welch method indicates a better reference phantom based BSC measurement can be achieved using this method.
Fig. 3.
BSC noise index per sample points (T-value), obtained from experimental data derived as described in Section 3.4 using the Siemens VFX13-5 transducer. (a) displays the T-value using the Welch method vs. the number (1 – 21) of independent RF segments for averaging spectral values and for different RF segment sizes (3 – 21 center frequency wavelengths). (b) T-values using an 11-wavelength window-length, vs. the number of independent RF segments averaged and (c) T-values using 9 independent RF segments averaged, vs. window-length in units of center frequency wavelength.
III.E. Scatterer size estimation and its variance vs. spatial resolution
III.E.1. VFX13-5 experiments
For the experiments done using the VFX13-5 transducer, the data were analyzed over the −15dB (with respect to the maximum spectral value at each depth) frequency range and at 1, 2, and 3cm depth. The ka value is about 0.5 – 1.6 for each depth. This is ideal for scatterer size estimates [39]. The bias of the Gaussian SAF scatterer size estimates are within 2 to 3% for almost every depth and every spectral estimation method when at least ~6 independent A-lines are averaged and a window length of ~10 wavelengths or more is used.
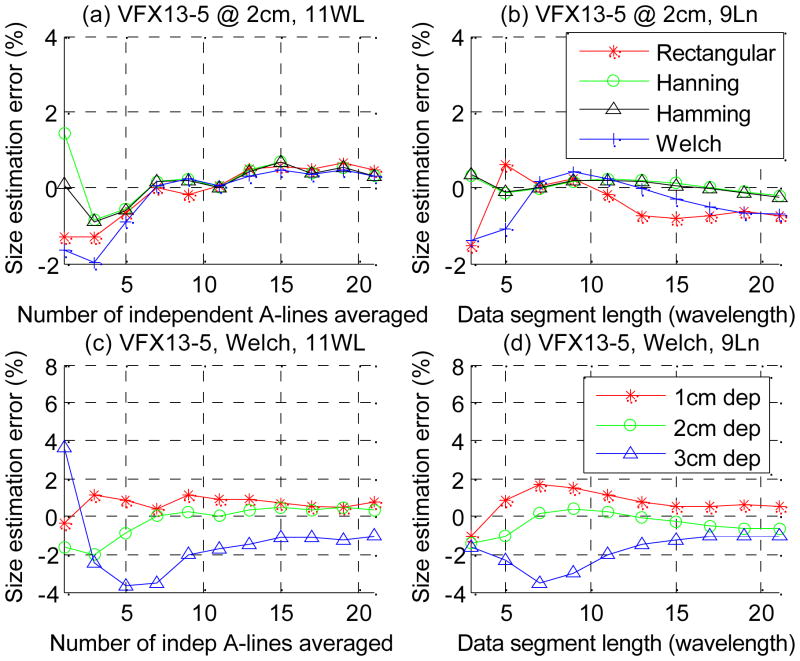
Figures 4(a) and (b) show the experimental results at 2cm (the transmit focal zone) using different spectral estimation methods for the scatterer size estimation errors vs. (a) the number of independent A-lines to be averaged when an 11-wavelength window is used and (b) the window length when 9 independent A-lines are averaged. Figures 4(c) and (d) show the scatterer size estimation errors at different depths using the Welch method to compute the spectrum.
Fig. 4.
Scatterer size estimation errors vs. (a) number of independent A-lines to be averaged when an 11-wavelength window is used, and (b) window length when 9 independent A-lines are averaged. Results are presented for data acquired with the VFX13-5 transducer and using different spectral estimation methods. (c) Scatterer size estimation errors at 1, 2, and 3cm depth using the Welch method vs. the number of independent A-lines averaged when an 11-wavelength window is used, and (d) size estimation errors at different depths vs. window length when 9 independent A-lines are averaged.
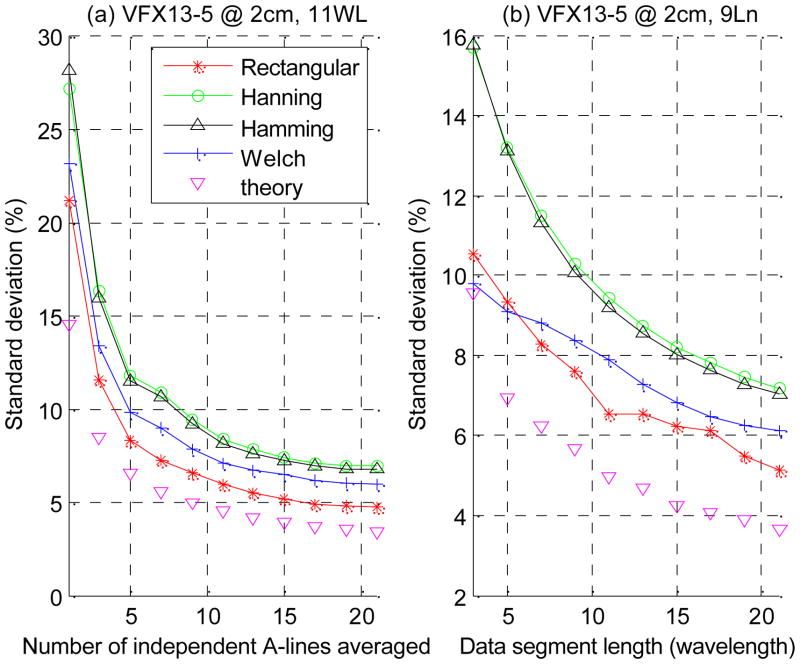
Figure 5 shows the experimental results at 2cm (the transmit focal zone) using different spectral estimation methods for the percentage standard deviation of the scatterer size estimates vs. (a) number of independent A-lines to be averaged when an 11-wavelength window is used and (b) window length when 9 independent A-lines are averaged. Standard deviations are obtained by analyzing scatterer size estimates for 250 ROI’s from the independent acquisition planes. The theoretical values are calculated according to equation (5) assuming a rectangular window and equation (6). They somewhat underestimate the true variance but are reasonably close. The main contributor to the discrepancy may be the approximation (spectra variances are approximately equal to power spectra square) used in the theory. Although the images were visually inspected, small local homogeneities of the phantom may also partially contribute to the variance. The standard deviations using Hann or Hamming window are larger than those obtained when using other methods. The variance reduces as the number of A-lines to be averaged increases and as the window length increases. However, the reduction in variance comes at a trade off with spatial resolution.
Fig. 5.
(a) Percent standard deviation of scatterer size estimates vs. the number of independent A-lines averaged when an 11-wavelength window is used; (b) percent standard deviation vs. window length when 9 independent A-lines are averaged. Results are for data acquired at 2cm depth using the VFX13-5 transducer. The theoretical values are calculated according to equation (5) assuming a rectangular window and equation (6).
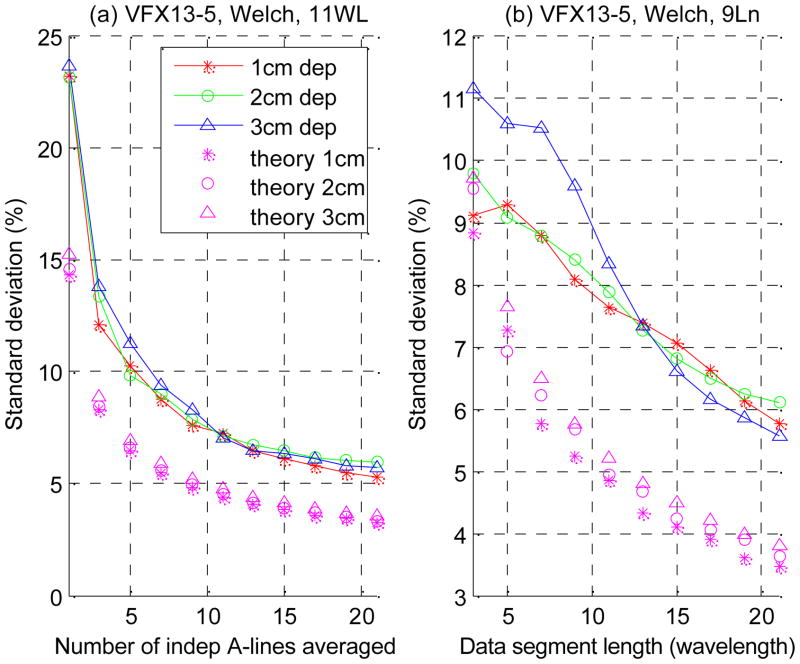
Figure 6 displays the depth dependence of the size estimation variance using the Welch method. The dependence is very weak in this case. This is because the measured −15dB bandwidth (~7.5 MHz) / ka range (~0.5 – ~1.6) is similar at different depths for the VFX13-5 results.
Fig. 6.
(a) Percent standard deviation of scatterer size estimates vs. the number of independent A-lines averaged when an 11 wavelength window is used; (b) percent standard deviation of scatterer size estimates vs. window length when 9 independent A-lines are averaged. Results are for the VFX13-5 transducer and the Welch spectral estimation method. The theoretical values are calculated according to equation (5) assuming a rectangular window and equation (6).
III.E.2. VFX9-4 experiments
When estimating the scatterer size using equation (2), some size estimates might turn out to be imaginary if the data are noisy. Because of its higher frequency range, this is not a big concern for the VFX13-5 experiments, but it turned out to be important for the lower frequency, VFX9-4 data from the test phantom. If the scatterer size is smaller or the frequency is lower (hence, the ka value is small), the frequency dependence of the measured form factor is flatter. This, along with the narrower frequency range available for curve fitting for the VFX9-4, means that noise can sometimes make the best fit form factor slope larger than 0, thus producing an imaginary scatterer size estimate.
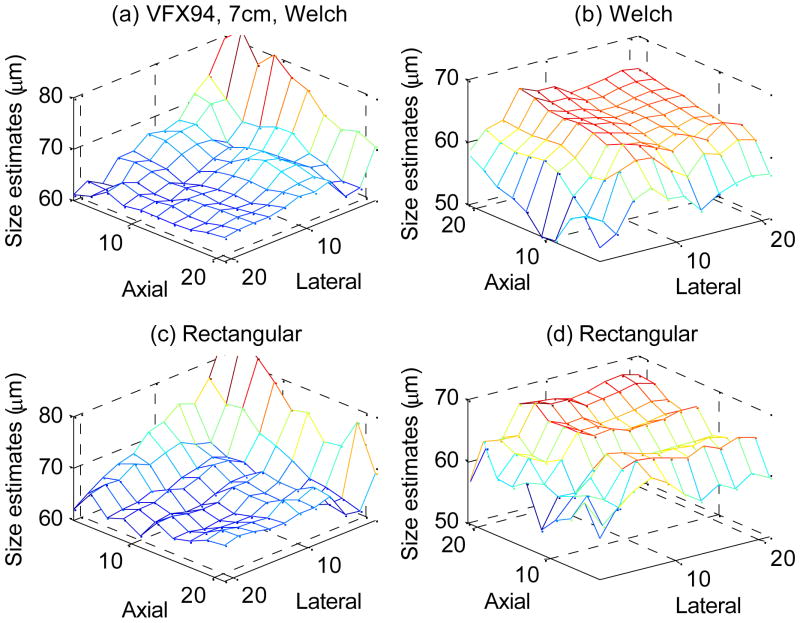
Two methods may be used to solve this problem. One way is to discard any imaginary values. The mean and variance are calculated only based on the real values of size estimates. The other way is to assign any imaginary valued results to an arbitrary small scatterer size value, e.g., 5 μm. This is similar to the method used by Insana & Hall [7], where they restricted the scatterer size search to a predefined range. Figure 7 displays parametric mesh surfaces at a 7cm depth, showing the axial window length in units of wavelength, the lateral block size in units of number of independent A-lines, and the scatterer size estimates in units of μm. In figures 7(a) and (c), the imaginary scatterer size estimates are handled by discarding them, while in figures 7(b) and (d), imaginary scatterer size estimates are handled by assigning them to be 5 μm. Figures 7(a) and (b) are results calculated using the Welch method, while figures 7(c) and (d) are calculated using a rectangular window. The results obtained by the Welch method give a smoother surface, indicating the size estimation does not change significantly as the processing parameters change.
Fig. 7.
Parametric mesh surfaces of scatterer size estimates vs. axial and lateral analysis block size at a 7cm depth using the VFX9-4 transducer. The axial window length is in units of wavelength, the lateral block size is in units of the number of independent A-lines, and the Gaussian SAF scatterer size estimates are in units of μm. In figures (a) and (c), the imaginary scatterer size estimates are handled by discarding them, while in figures (b) and (d), imaginary scatterer size estimates are handled by assigning them to be 5 μm. Note that for visualization purposes, the viewing angles of the graphs are different. The smaller axial and lateral resolution points to the paper for (a) and (c), while it points to the reader for (b) and (d). Figures (a) and (b) are the results calculated using the Welch method, while figures (c) and (d) are calculated using a rectangular window.
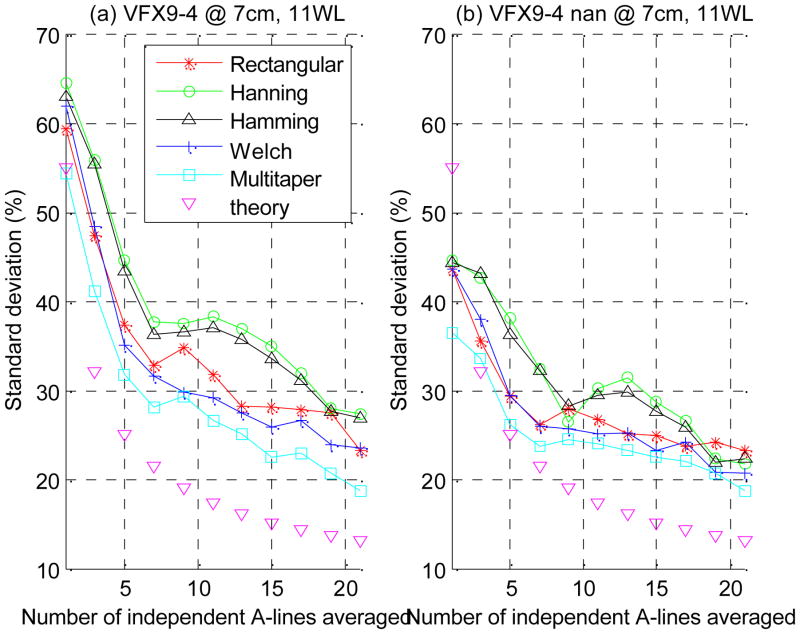
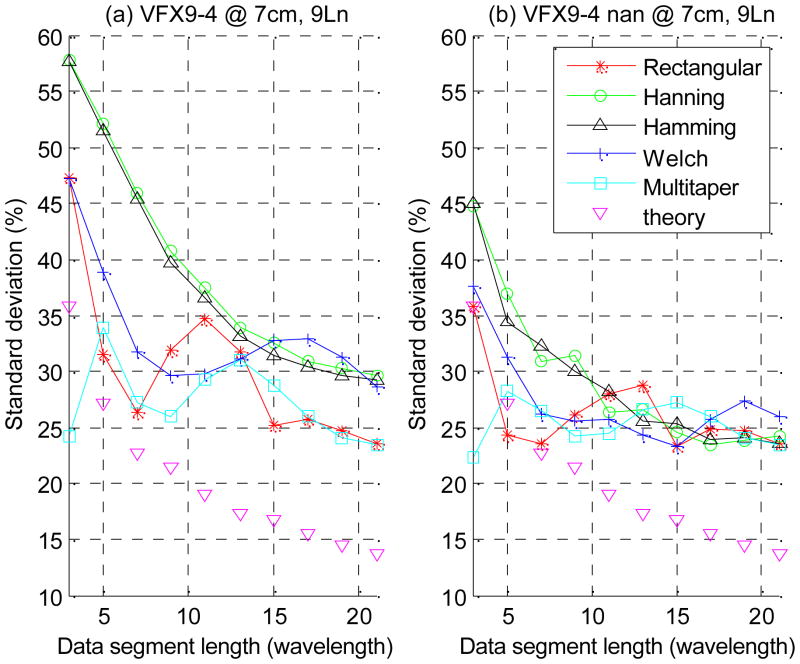
The size estimation variances are larger when the 5 μm assignment of imaginary values is used than when the imaginary number results are discarded. Figure 8 and 9 illustrate typical results of the size estimation variances. Results using the multitaper method are also included. Figure 8 shows the standard deviations of the scatterer size estimates vs. the number of independent A-lines averaged, using (a) a 5 μm assignment of imaginary values and (b) a NaN assignment of imaginary values at 7cm depth (the transmit focal distance) and an 11-wavelength window was applied for each window type. Figure 9 shows the standard deviations vs. axial window length at a 7cm depth using 9 independent A-lines in the average. Standard deviations are obtained by analyzing scatterer size estimates for 190 ROI’s from the independent acquisition planes. Results using the multitaper method are also included. For small echo signal data block sizes, moderate improvements in scatterer size estimations were obtained using a multitaper method but this significantly increases the computational burden.
Fig. 8.
The percent standard deviation of the scatterer size estimates using (a) 5 μm assignment of imaginary values and (b) NaN assignment of imaginary value at 7cm (focus) depth and 11-wavelength window length vs. the number of independent A-lines averaged. The VFX9-4 transducer data were used for the curves. The theoretical values are calculated according to equation (5) assuming a rectangular window and equation (6).
Fig. 9.
Percent standard deviation of the scatterer size estimates using (a) 5 μm assignment of imaginary values and (b) NaN assignment of imaginary values. Data are from a depth of 7cm using the VFX9-4 transducer and averaging spectra for 9 independent A-lines. The theoretical values are calculated according to equation (5) assuming a rectangular window and equation (6).
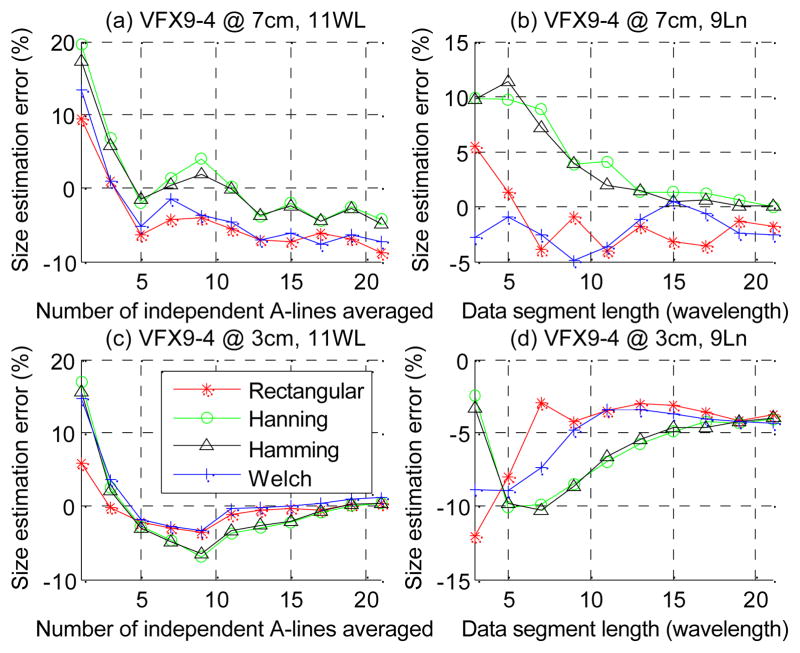
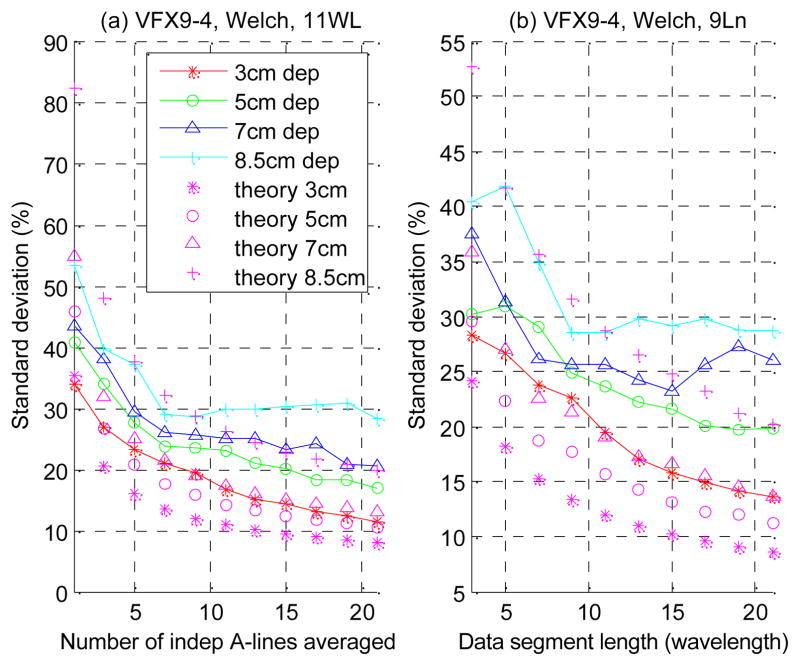
Figure 10 displays the size estimation errors for deep (7cm) objects and shallow (3cm) objects when different spectral estimation methods are used. Figures 10(a) and (c) are plotted vs. the number of independent A-lines to be averaged when having an 11-wavelength axial extent, while figures 10(b) and (d) are plotted vs. the axial window length in units of wavelength when 9 independent A-lines are averaged. Figure 11 displays the depth dependence of the size estimation variance using the Welch method. The greater the depth is, the larger the variance is. This is because the measured bandwidth / ka range decreases as the depth increases. At the depths of 3, 5, 7, and 8.5cm, the −15dB bandwidth was 5.0, 4.4, 4.0, and 3.2 MHz and the ka range was ~ 0.4 – 1.1, 0.4 – 1.0, 0.3 – 0.9, and 0.3 – 0.8. The figures 10 and 11 are all produced using NaN assignment of the imaginary size estimates.
Fig. 10.
Size estimation errors using the VFX9-4 transducer for a deep (7cm) ROI and a shallow (3cm) ROI when different spectral estimation methods are used. Panel (a) and (c) are plotted vs. the number of independent A-lines to be averaged when an 11-wavelength axial window is used, while panel (b) and (d) are plotted vs. the axial window length in units of wavelength when 9 independent A-lines are averaged.
Fig. 11.
The depth dependence of the size estimation variance using the Welch method vs. (a) number of independent A-lines to be averaged when an 11-wavelength window is used and (b) window length when 9 independent A-lines are averaged. Data from the VFX9-4 transducer were used for these curves. The theoretical values are calculated according to equation (5) assuming a rectangular window and equation (6).
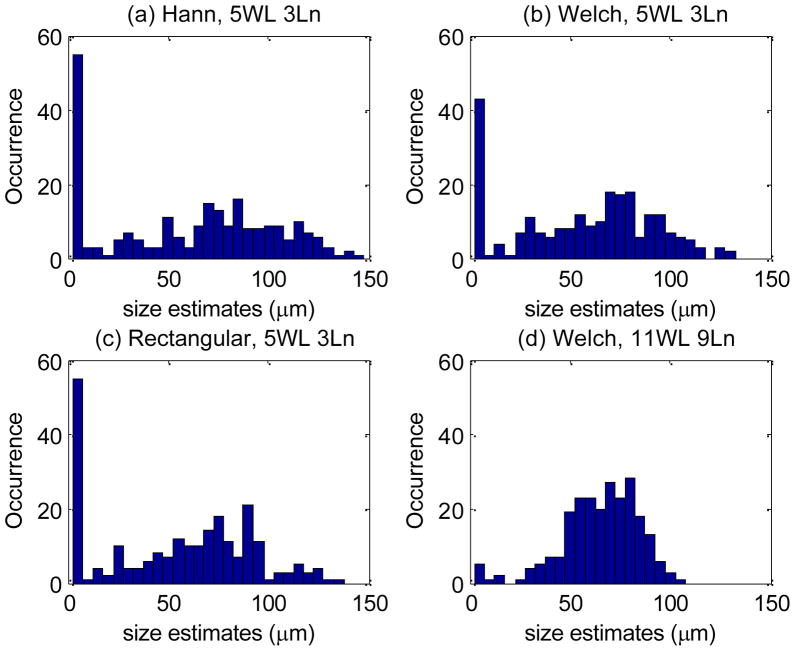
Figure 12 are histograms of scatterer size estimates. The imaginary estimates were assigned to be 5 μm for each case, allowing us to see how many imaginary values there might be in a typical experiment involving the experimental conditions described in this paper. Figure 12(a – c) shows estimates of scatterer size that are obtained using a 5-wavelength window and averaging over 3 independent A-lines using (a) a Hanning window, (b) the Welch method, and (c) a rectangular window. Figure 12(d) shows estimates of scatterer size that are obtained using an 11-wavelength window and averaged over 9 independent A-lines where the Welch method is applied. If very small block/ROI sizes are used, this leads to greater spread in the size estimates. Because imaginary estimates were assigned to be a small size (5μm), the mean value underestimated the true scatterer size, and figure 7 shows this. When the Gaussian scattering model is applied, statistical fluctuations can more easily make the size estimates imaginary for small scatterers than for larger ones because the associated form factor is flatter. This can also be seen from equation (6), which indicates the fractional size estimation standard deviation is inversely proportional to the square of the scatterer size. Therefore, the true values of the imaginary estimates are more likely to be small numbers and the scatterer size will be overestimated if the mean value is calculated based only on the real-valued estimates. From the histograms (figure 12), we see that the number of imaginary estimates is reduced as the analysis block size increases to 11 wavelengths axially and 9 independent A-lines laterally. This is why we see from figure 7 the size estimate surface becomes flat as the block size increases. One natural criterion based on scatterer size estimation accuracy for choosing data processing parameters is to increase the block size laterally or axially until stable size estimates can be obtained (the size estimates do not depend on the size of the data processing block). Averaging of more A-lines usually is more efficient than increasing the axial length. However, as the ROI goes deeper, for a minimum desired resolution (e.g., decided by the tumor dimension), the number of available independent A-lines that can be averaged laterally may be small. Figure 12 also illustrates the reduction of size estimation variance when a larger block is used. Size estimates in figure 12(d) are more compact around the peak, while 12(b) has a much flatter distribution.
Fig. 12.
Histograms of scatterer size estimates from different blocks, computed for data from the test phantom using the VFX9-4 transducer. Any estimate that resulted in an imaginary value is assigned to be 5 μm. Panel (a)–(c) are estimated using a 5 wavelength window and averaged over 3 independent A-lines using (a) a Hanning window, (b) the Welch method, and (c) a rectangular a window. Panel (d) was obtained using an 11 wavelength window and averaged over 9 independent A-lines using the Welch method.
IV. Discussion
When the useable ka range is ideal, as for the VFX13-5 case applied to the 48μm glass bead scatterers (~69μm effective size using Gaussian SAF) in the test phantom, averaging of 7 – 11 independent A-lines and 9 – 13 wavelength windows are good choices. For a block size larger than these values, the variance drops very slowly, and the improved precision does not justify the loss of resolution. The standard deviations are within 8% in this setting, which is considered to be excellent. For the VFX13-5 transducer, referring to figure 1(a), these numbers are equivalent to 1.8 – 2.6 mm axially and 1.7 – 2.8 mm laterally around or shallower than the transmit focus. For objects deeper than the transmit focus, larger blocks would need to be used with subsequent poorer resolution.
To measure BSC and scatterer size for deeper objects, a lower frequency transducer, e.g., VFX9-4 should be used; however, the available bandwidth becomes smaller. Because of the low frequency, the ka range is not ideal for scatterer size estimates in the present phantom. According to equation (4), the precision also is reduced, and the precision becomes even worse for small scatterers. Compared to the VFX13-5 at shallow depths, the beam width of the VFX9-4 transducer at greater depths are significantly broader. Therefore, for the same lateral resolution, the number of effective, independent A-lines to be averaged becomes less. All these factors make the work of estimating scatterer sizes more challenging for deeper objects.
As exemplified by figures 8–10, for large uniform objects, if the axial window length can be increased to more than 15 – 20 wavelengths and averaging can be done over 15 independent A-lines, the size estimation accuracy and precision becomes progressively more independent of the window type. For large amounts of data the spectral estimations themselves are more accurate, and the window type contributes less to the resultant shape of the spectrum.
Applying either the rectangular window or the Welch method are better than using a Hanning or Hamming window (Hanning and Hamming results are almost identical). This may be explained as follows. Although a rectangular window suffers from spectral leakage and the results fit the actual BSC vs. frequency worse than when using the Welch method, as the T-values show, it provides better overall spectral resolution. According to equation (3), better spectral resolution improves the size estimation precision. So, either a rectangular window or the Welch method is preferred over the Hanning or Hamming window for scatterer size estimations. The Welch method gives the best reference phantom method BSC measurement, more stable estimation as the block size changes, and potentially better performance on reference phantom based attenuation estimations over a rectangular window. Although the computational load of the multitaper method is several times higher than that of the Welch method, figures 8 and 9 show moderate improvements on scatterer size estimation using the multitaper method, particularly when the analysis block size is small. This may turn out to be useful for scatterer size estimations in more heterogeneous regions. More detailed investigation on the multitaper method will be reported later using both phantom and in vivo data.
Using the Welch method or a rectangular window for the VFX9-4 transducer data for depths up to around 7cm, with reasonably accurate attenuation compensation [40], a block size of 10 – 15 wavelengths axially and 7 – 13 independent A-lines laterally, is considered to be the best tradeoff between accuracy, precision, and resolution. If using larger (or smaller) sizes, the improvement of precision (or resolution) does not justify the loss of resolution (or precision). In this case, better than 10% accuracy and 30% precision can be obtained for a uniform phantom. The relatively large variance here is partially because of the small size of the scatterers in the test phantom and, therefore, a suboptimal ka range). For larger scatterer sizes, like normal liver tissue [41], the variance is expected to be smaller. However, for highly cellular malignant tumors, which appear to have smaller scatterer sizes [11, 41], the large variance may be a challenge. For the depths considered (1 – 5cm for the VFX13-5 and 2 – 9cm for the VFX9-4), the shallower the objects are, the larger the useful bandwidth is and the smaller is the correlation between A-lines. Because of the depth dependence of the size estimation variance, one should take into account the ROI depth when choosing the resolution for data processing or using an adaptive resolution setting. Also, one should always try to find a scan window which views the objects in question at the smallest possible depth.
If imaging an object located between 5 and 8cm in depth using the VFX9-4 transducer, the optimal block size of 10 – 15 wavelengths by 7 – 13 independent A-lines covers dimensions of 3.5 – 5mm (in the axial direction) by 3.5 – 7mm (in the lateral direction). For objects with small scatterer sizes or in the presence of high overall attenuation, thereby reducing the effective frequency, the block size may need to be even larger. In many cases, a large lateral block size can not be achieved because of local inhomogeneities and resolution requirements. In these cases, spatial compounding [22, 23] can be used to improve precision of scatterer size estimations.
For the sake of improving the scatterer size estimation accuracy and precision, increasing the axial dimensions of the analysis block is interchangeable with increasing the lateral size (hence, the number of independent A-lines). To combine the axial and lateral parameters with transducer properties, a general and likely better approach is to define an approximate spatial equivalence of the time-bandwidth product (W) assuming the data is stationary within the analysis block. Thus,
| (10) |
| (11) |
where Z is the axial block size, L is the correlation length, Y is the inverse of the fractional bandwidth of the echo signal, k0 is the spatial equivalent center frequency of the spectra and Neff is the number of effective, independent A-lines in the analysis block. These are similar to the definitions in Bilgen and Insana [42], though they did not define the fractional bandwidth in detail. Therefore the physical meaning of this equivalent time-bandwidth product is the number of independent samples within each analysis block. The Z/L term is equivalent to the pulse length used by Oelze and O’Brien [20]. They did not state in detail how the pulse length is measured, but based it on the signal from a planar reflector. Since their tumor model was also imaged in a water path, the approach is reasonable. However, in our in vivo experiments, the pulse duration of the echo signals can not be measured conveniently because the signal from the reference phantom is an extended waveform.
If the axial block size is defined in units of the center frequency wavelength of the echo signal, from equations (10) and (11), the time-bandwidth product can be calculated as
| (12) |
where n is the number of center frequency wavelengths in the axial window. The transmit pulse length (−6dB) of the VFX9-4 transducer at the 6.15MHz nominal frequency setting is measured to be around 1.6 wavelengths which is approximately the same as the value listed in the Siemens Antares manual. There is no common agreement on what spectral value relative to the peak should be used to calculate the fractional bandwidth for ultrasound tissue characterization. The fractional bandwidth is often defined at the FWHM power in the signal processing field. Therefore, for a simple approximation, we used the −3dB fractional bandwidth. It is weakly depth dependent. Around the focus (7cm), the receiving fractional bandwidth is ~ 0.45, which is smaller than the ~ 0.6 transmit fractional bandwidth. The fractional bandwidth of the Siemens VFX13-5 transducer is similar to that of the VFX9-4. Thus, for these transducers, the optimal time-bandwidth product is approximately 0.45n × Neff, according to equation (12). Based on the observations we reported above, we suggest that the analysis block should contain at least 30 independent samples but the number should be kept less than 80 for spatial resolution considerations.
It is desirable to keep the axial size of the analysis block small so that the point attenuation correction is valid [25], but large enough to include at least 3 or 4 pulse lengths because of the uncertainty principle. Therefore, sometimes, the lateral dimensions of the block need to contain 7 – 12 effective, independent A-lines. Therefore, to keep the lateral resolution small and not to violate the spatial stationary assumption, spatial spectral compounding techniques [23, 25] are suggested.
V. Conclusions
Tradeoffs for data acquisition and processing parameters are studied for reference phantom based backscatter and scatterer size estimations with a clinical scanner. Power spectra estimations using the Welch method or simply a rectangular window performed better in terms of accuracy and precision than those using Hamming or Hann window for backscatter and scatterer size estimations. To balance the tradeoff between spatial resolution and scatterer size estimation accuracy and precision, results indicate the analysis block size should be approximately 10 times the center frequency wavelength in the axial direction and include 10 independent A-lines laterally. For an optimal ka range (0.5 – 1.6), values can be as small as 7 wavelength windows by 7 independent A-lines, but larger analysis block sizes may be needed in cases where the ka range is suboptimal.
Thus, researchers should analyze specific cases taking into account the experimental conditions, correlations between A-lines, and expected scatterer properties. In our study the scatterer size estimation accuracy and precision were both within 5% when 0.5 < ka < 1.6 using 7 wavelengths by 7 independent A-lines analysis block dimension. The results may be generalized to other transducer/scatterer size combinations with similar ka ranges. Spatial compounding techniques can improve the precision when the optimal block size is not achievable because of local inhomogeneities.
Acknowledgments
The authors wish to thank Drs Jingfeng Jiang, Tony Gerig, Tim Hall, Tomy Varghese, Mark Kliewer, Tim Stiles, Gary Frank, Hyungsuk Kim and Hairong Shi, for their help on the experiments and discussion. This research was supported in part by NIH Grants R01CA111289 and RO1CA111289 and by a Richard Mazess Advanced Fellowship awarded to Dr. Liu.
Footnotes
Reprinted, with permission, from IEEE Trans Ultrasonics, Ferroelectrics, and Freq Control, 57 (2) 340-352.
Contributor Information
Wu Liu, Email: wuliu@stanford.edu.
James A. Zagzebski, Email: jazagzeb@wisc.edu.
References
- 1.Lizzi FL, Greenebaum M, Feleppa EJ, Elbaum M, Coleman DJ. Theoretical framework for spectrum analysis in ultrasonic tissue characterization. J Acoust Soc Am. 1983 Apr;73:1366–73. doi: 10.1121/1.389241. [DOI] [PubMed] [Google Scholar]
- 2.Campbell JA, Waag RC. Normalization of Ultrasonic Scattering Measurements to Obtain Average Differential Scattering Cross-Sections for Tissues. Journal of the Acoustical Society of America. 1983;74:393–399. doi: 10.1121/1.389832. [DOI] [PubMed] [Google Scholar]
- 3.Nicholas D. Evaluation of Backscattering Coefficients for Excised Human-Tissues -Results, Interpretation and Associated Measurements. Ultrasound in Medicine and Biology. 1982;8:17–28. [Google Scholar]
- 4.Yao LX, Zagzebski JA, Madsen EL. Backscatter coefficient measurements using a reference phantom to extract depth-dependent instrumentation factors. Ultrason Imaging. 1990 Jan;12:58–70. doi: 10.1177/016173469001200105. [DOI] [PubMed] [Google Scholar]
- 5.Madsen EL, Insana MF, Zagzebski JA. Method of data reduction for accurate determination of acoustic backscatter coefficients. J Acoust Soc Am. 1984 Sep;76:913–23. doi: 10.1121/1.391317. [DOI] [PubMed] [Google Scholar]
- 6.Nassiri DK, Hill CR. The Use of Angular Acoustic Scattering Measurements to Estimate Structural Parameters of Human and Animal-Tissues. Journal of the Acoustical Society of America. 1986 Jun;79:2048–2054. doi: 10.1121/1.393213. [DOI] [PubMed] [Google Scholar]
- 7.Insana MF, Hall TJ. Parametric ultrasound imaging from backscatter coefficient measurements: image formation and interpretation. Ultrason Imaging. 1990 Oct;12:245–67. doi: 10.1177/016173469001200402. [DOI] [PubMed] [Google Scholar]
- 8.Insana MF, Brown DG. Acoustic Scattering Theory Applied to Soft Biological Tissues. In: Shung KK, editor. Ultrasonic Scattering in Biological Tissues. Boca Raton: CRC Press; 1993. pp. 75–124. [Google Scholar]
- 9.Lizzi FL, Ostromogilsky M, Feleppa EJ, Rorke MC, Yaremko MM. Relationship of ultrasonic spectral parameters to features of tissue microstructure. IEEE Trans Ultrason, Ferrorelect, Freq Contr. 1987;34:319–29. doi: 10.1109/t-uffc.1987.26950. [DOI] [PubMed] [Google Scholar]
- 10.Waag RC. A review of tissue characterization from ultrasonic scattering. IEEE Trans Biomed Eng. 1984 Dec;31:884–93. doi: 10.1109/TBME.1984.325254. [DOI] [PubMed] [Google Scholar]
- 11.Oelze ML, Zachary JF, O’Brien WD., Jr Characterization of tissue microstructure using ultrasonic backscatter: theory and technique for optimization using a Gaussian form factor. J Acoust Soc Am. 2002 Sep;112:1202–11. doi: 10.1121/1.1501278. [DOI] [PubMed] [Google Scholar]
- 12.Gerig A, Zagzebski J, Varghese T. Statistics of ultrasonic scatterer size estimation with a reference phantom. J Acoust Soc Am. 2003 Jun;113:3430–7. doi: 10.1121/1.1568945. [DOI] [PubMed] [Google Scholar]
- 13.Akita M, Ueda M. The Effect of Windowing on Spectral Estimation of Echoes Scattered by a Random Medium. Journal of the Acoustical Society of America. 1988 Apr;83:1243–1248. [Google Scholar]
- 14.Topp KA, Zachary JF, O’Brien WD. Quantifying B-Mode images of in vivo rat mammary tumors by the frequency dependence of backscatter. Journal of Ultrasound in Medicine. 2001 Jun;20:605–612. doi: 10.7863/jum.2001.20.6.605. [DOI] [PubMed] [Google Scholar]
- 15.Madsen EL. Method of Determination of Acoustic Backscatter and Attenuation Coefficients Independent of Depth and Instrumentation. In: Shung KK, editor. Ultrasonic Scattering in Biological Tissues. Boca Raton: CRC Press; 1993. pp. 205–50. [Google Scholar]
- 16.Chen JF, Zagzebski JA, Madsen EL. Tests of Backscatter Coefficient Measurement Using Broad-Band Pulses. Ieee Transactions on Ultrasonics Ferroelectrics and Frequency Control. 1993 Sep;40:603–607. doi: 10.1109/58.238114. [DOI] [PubMed] [Google Scholar]
- 17.Wear KA. Fundamental precision limitations for measurements of frequency dependence of backscatter: Applications in tissue-mimicking phantoms and trabecular bone. Journal of the Acoustical Society of America. 2001 Dec;110:3275–3282. doi: 10.1121/1.1416907. [DOI] [PMC free article] [PubMed] [Google Scholar]
- 18.Bigelow TA, O’Brien WD. Impact of local attenuation approximations when estimating correlation length from backscattered ultrasound echoes. Journal of the Acoustical Society of America. 2006 Jul;120:546–553. doi: 10.1121/1.2208456. [DOI] [PubMed] [Google Scholar]
- 19.Huisman HJ, Thijssen JM. Precision and accuracy of acoustospectrographic parameters. Ultrasound in Medicine and Biology. 1996;22:855–871. doi: 10.1016/0301-5629(96)00105-6. [DOI] [PubMed] [Google Scholar]
- 20.Oelze ML, O’Brien WD., Jr Defining optimal axial and lateral resolution for estimating scatterer properties from volumes using ultrasound backscatter. J Acoust Soc Am. 2004 Jun;115:3226–34. doi: 10.1121/1.1739484. [DOI] [PubMed] [Google Scholar]
- 21.Oelze ML, O’Brien WD., Jr Improved scatterer property estimates from ultrasound backscatter for small gate lengths using a gate-edge correction factor. J Acoust Soc Am. 2004 Nov;116:3212–23. doi: 10.1121/1.1798353. [DOI] [PubMed] [Google Scholar]
- 22.Gerig AL, Varghese T, Zagzebski JA. Improved parametric imaging of scatterer size estimates using angular compounding. IEEE Trans Ultrason Ferroelectr Freq Control. 2004 Jun;51:708–15. [PubMed] [Google Scholar]
- 23.Liu W, Zagzebski JA, Varghese T, Gerig AL, Hall TJ. Spectral and Scatterer-Size Correlation During Angular Compounding: Simulations and Experimental Studies. Ultrasonic Imaging. 2006;28:230–44. doi: 10.1177/016173460602800403. [DOI] [PubMed] [Google Scholar]
- 24.Yao LX, Zagzebski JA, Madsen EL. Statistical uncertainty in ultrasonic backscatter and attenuation coefficients determined with a reference phantom. Ultrasound Med Biol. 1991;17:187–94. doi: 10.1016/0301-5629(91)90126-h. [DOI] [PubMed] [Google Scholar]
- 25.Liu W, Zagzebski JA, Hall TJ, Madsen EL, Varghese T, Kliewer MA, Panda S, Lowery C, Barnes S. Acoustic backscatter and effective scatterer size estimates using a 2D CMUT transducer. Phys Med Biol. 2008 Aug 7;53:4169–83. doi: 10.1088/0031-9155/53/15/011. [DOI] [PMC free article] [PubMed] [Google Scholar]
- 26.Oelze ML, O’Brien WD., Jr Method of improved scatterer size estimation and application to parametric imaging using ultrasound. J Acoust Soc Am. 2002 Dec;112:3053–63. doi: 10.1121/1.1517064. [DOI] [PubMed] [Google Scholar]
- 27.Lizzi FL, Alam SK, Mikaelian S, Lee P, Feleppa EJ. On the statistics of ultrasonic spectral parameters. Ultrasound in Medicine and Biology. 2006 Nov;32:1671–1685. doi: 10.1016/j.ultrasmedbio.2006.09.002. [DOI] [PubMed] [Google Scholar]
- 28.Wilson T, Zagzebski J, Li YD. A test phantom for estimating changes in the effective frequency of an ultrasonic scanner. Journal of Ultrasound in Medicine. 2002 Sep;21:937–945. doi: 10.7863/jum.2002.21.9.937. [DOI] [PubMed] [Google Scholar]
- 29.Liu W, Zagzebski J, Kliewer M, Varghese T, Hall T. Ultrasonic scatterer size estimations in liver tumor differentiation. Medical Physics. 2007 Jun;34:2597–2597. [Google Scholar]
- 30.Li YD, Zagzebski JA. A frequency domain model for generating B-mode images with array transducers. Ieee Transactions on Ultrasonics Ferroelectrics and Frequency Control. 1999 May;46:690–699. doi: 10.1109/58.764855. [DOI] [PubMed] [Google Scholar]
- 31.Odonnell M, Silverstein SD. Optimum Displacement for Compound Image Generation in Medical Ultrasound. Ieee Transactions on Ultrasonics Ferroelectrics and Frequency Control. 1988 Jul;35:470–476. doi: 10.1109/58.4184. [DOI] [PubMed] [Google Scholar]
- 32.Stoica P, Moses RL. Introduction to Spectral Analysis. New Jersey: Prentice Hall; 1997. [Google Scholar]
- 33.Welch PG. The use of fast Fourier transform for the estimation of power spectra: A method based on time averaging over short, modified periodograms. IEEE Transactions on Audio and Electroacoustics. 1967;15:70–3. [Google Scholar]
- 34.Percival DB, Walden AT. Spectral Analysis for Physical Applications: Multitaper and Conventional Univariate Techniques. Cambridge University Press; 1993. [Google Scholar]
- 35.Thomson DJ. Multitaper Analysis of Nonstationary and Nonlinear Time Series Data. In: Fitzgerald W, Smith R, Walden A, Young P, editors. Nonlinear and Nonstationary Signal Processing. Cambridge: Cambridge University Press; 2001. pp. 317–94. [Google Scholar]
- 36.Slepian D. Prolate Spheroidal Wave-Functions, Fourier-Analysis, and Uncertainty .5. Discrete Case. Bell System Technical Journal. 1978;57:1371–1430. [Google Scholar]
- 37.Hall TJ, Insana MF, Harrison LA, Cox GG. Ultrasonic measurement of glomerular diameters in normal adult humans. Ultrasound Med Biol. 1996;22:987–97. doi: 10.1016/s0301-5629(96)00142-1. [DOI] [PubMed] [Google Scholar]
- 38.Bigelow TA, O’Brien WD., Jr Signal processing strategies that improve performance and understanding of the quantitative ultrasound SPECTRAL FIT algorithm. J Acoust Soc Am. 2005 Sep;118:1808–19. doi: 10.1121/1.2000752. [DOI] [PubMed] [Google Scholar]
- 39.Chen JF, Zagzebski JA, Dong F, Madsen EL. Estimating the spatial autocorrelation function for ultrasound scatterers in isotropic media. Med Phys. 1998 May;25:648–55. doi: 10.1118/1.598247. [DOI] [PubMed] [Google Scholar]
- 40.Kim H, Varghese T. Attenuation estimation using spectral cross-correlation. Ieee Transactions on Ultrasonics Ferroelectrics and Frequency Control. 2007 Mar;54:510–519. doi: 10.1109/tuffc.2007.274. [DOI] [PubMed] [Google Scholar]
- 41.Sommer G, Olcott EW, Tai L. Liver tumors: utility of characterization at dual-frequency US. Radiology. 1999 Jun;211:629–36. doi: 10.1148/radiology.211.3.r99jn45629. [DOI] [PubMed] [Google Scholar]
- 42.Bilgen M, Insana MF. Error analysis in acoustic elastography .1. Displacement estimation. Journal of the Acoustical Society of America. 1997 Feb;101:1139–1146. doi: 10.1121/1.418018. [DOI] [PubMed] [Google Scholar]


