

Abstract
Context: Type 2 familial partial lipodystrophy (FPLD) is an autosomal-dominant lamin A/C-related disease associated with exercise intolerance, muscular pain, and insulin resistance. The symptoms may all be explained by defective metabolism; however, metabolism at the tissue level has not been investigated.
Objective: We hypothesized that in FPLD, insulin resistance and impaired aerobic exercise capacity are explained by a common underlying mechanism, presumably a muscular metabolic defect.
Patients and Methods: Carbohydrate and lipid metabolism was studied on 10 FPLD patients, one patient with limb-girdle muscular dystrophy (LGMD1B, a different lamin A/C disease), and 10 healthy control subjects before and during an oral glucose tolerance test by indirect calorimetry and im microdialysis. Muscle biopsies were taken for in vitro studies.
Results: We observed marked increased skeletal muscle fatty acid β-oxidation rate in vitro and in vivo, even after glucose ingestion in FPLD patients. However, fatty acid oxidation was largely incomplete and accompanied by increased ketogenesis. The lipid oxidation abnormality was associated with impaired glucose disposition through reduction in glucose oxidation, rather than decreased cellular glucose uptake. A microarray showed down-regulation of complex I respiratory chain, glycolysis, and nuclear transport genes. Although not overtly insulin resistant, the LGMD1B patient showed similar metabolic derangements as the FPLD patients.
Conclusions: Our study suggests imbalance between lipid oxidation and oxidative glucose metabolism in FPLD and LGMD1B patients. The observation suggests an intrinsic defect in skeletal muscle metabolism due to lamin A/C dysfunction. The metabolic FPLD phenotype likely results from this intrinsic defect combined with lipodystrophic “lipid pressure” due to decreased adipose tissue lipid storage capacity.
LMNA mutations are associated with an imbalance between lipid oxidation and oxidative glucose metabolism likely caused by intrinsic defects in skeletal muscle metabolism.
Type 2 (Dunnigan’s) familial partial lipodystrophy (FPLD; OMIM no. 151660) is an autosomal-dominant disease caused by mutations in the LMNA gene encoding the nuclear proteins lamin A and C (1,2,3,4,5). Lamin A and C are members of the intermediate filament protein family that are required for proper formation of the nuclear lamina (5,6). Gene transcription and chromatin duplication are dependent on spatial distribution and organization of chromatin and nuclear proteins, which is ensured by the nuclear lamina and associated intermediate filaments (7). FPLD patients are born with normal fat distribution. After puberty, patients lose sc fat from their extremities, trunk, and gluteal regions. Excess fat may be redistributed to the face, neck, back, and abdominal cavity (8,9) or other organs as evidenced by the high prevalence of hepatic steatosis (10). In addition, skeletal muscle fibers in FPLD display significant hypertrophy (11). Combination of sc fat loss and skeletal muscle hypertrophy gives FPLD patients a rather athletic appearance. Yet, patients report early fatigue during endurance exercise and muscular pain. Physiological skeletal muscle hypertrophy in athletes is associated with increased insulin sensitivity. In contrast, FPLD patients present with hypertriglyceridemia and insulin resistance that often progresses to type 2 diabetes mellitus (T2DM). We hypothesized that in FPLD, insulin resistance and impaired aerobic exercise capacity are explained by a common underlying mechanism, presumably a muscular metabolic defect. Our study suggests that FPLD is associated with abnormalities in fatty acid oxidation and impaired glucose disposition. The metabolic abnormalities in FPLD patients may not solely be explained by loss of sc adipose tissue because another rare LMNA mutation (W498C) leading to the phenotypically quite different limb girdle muscular dystrophy 1B (LGMD1B) (12) was also associated with increased incomplete muscular fatty acid oxidation. Moreover, LMNA mutations can be associated with severe insulin resistance without overt lipodystrophy (13).
Patients and Methods
Patients
We recruited 10 nondiabetic FPLD patients and 10 healthy, age- and body weight- matched control subjects. Antihypertensive and lipid-lowering drugs were discontinued before testing. Thyroid hormone substitution in two patients was continued. We detected three different LMNA mutations: R482Q (n = 5), R582H (n = 3), and R482W (n = 2). We also tested a nondiabetic woman (age, 52 yr; body mass index, 23 kg/m2) with LGMD1B due to LMNA W498C mutation. We previously described the detailed muscle and nerve pathology of all these patients (11). The local institutional review board approved the study, and written informed consent was obtained from all participants.
Protocol
After an overnight fast, we measured resting and postprandial energy expenditure and respiratory quotient (RQ) by indirect calorimetry (DeltatracII; Datex Ohmeda, Duisburg, Germany) in the supine position. A catheter was placed in a large antecubital vein for blood sampling. One microdialysis probe (CMA/60; CMA Microdialysis AB, Solna, Sweden) was inserted into the vastus lateralis muscle (14,15). After probe insertion, tissue perfusion was started with lactate free Ringer’s solution supplemented with 50 mmol/liter ethanol at a flow rate of 2 μl/min using CMA/102 microdialysis pumps. Ethanol was added to assess changes in tissue perfusion by using the ethanol dilution technique (16,17). After a recovery period of at least 60 min, an oral 75-g glucose load was given (300 ml solution, Dextro, O.G.T.; Hoffmann-La Roche AG, Grenzach-Wyhlen, Germany). Blood and dialysate samples were taken at baseline and every 15 min during the 2-h glucose tolerance testing (GTT). After the GTT, 1 μm isoproterenol was added to the perfusate, and perfusion was continued for another hour to determine the maximal lipolytic response.
Analytical methods
Blood glucose and insulin concentrations were measured according to international standards, and nonesterified fatty acids were measured by an automated colorimetric test (ABX Pentra 400 Chemistry Analyser; Horiba ABX, Bedfordshire, UK). Perfusate (inflow) and dialysate (outflow) ethanol concentrations were measured with a standard spectrophotometric enzymatic assay. A decrease in the ethanol outflow/inflow ratio (“ethanol ratio”) is equivalent to an increase in blood flow and vice versa. Dialysate glucose, lactate, pyruvate, and glycerol concentrations were measured with the CMA/600 analyzer. In situ dialysate recovery for these metabolites was about 50%, as assessed by near-equilibrium dialysis (18). Plasma acylcarnitine was measured using flow injection tandem mass spectrometry (Quattro II triple quadrupole mass spectrometer; Micromass/Waters, Millford, MA) (19).
Skeletal muscle cell culture
We obtained open muscle biopsies from the left vastus lateralis muscle in four FPLD patients. Cultures from two women with a LMNA R482W and R482Q mutation, respectively, were suitable for in vitro studies. We also obtained a muscle biopsy from the LGMD1B patient and healthy controls (n = 6) (20). Satellite cells were isolated as previously described (21). Cells were passaged once, harvested, and frozen at approximately 80% confluence. Mononuclear myoblasts were immunopurified by magnetic cell sorting using the mouse monoclonal 5.1H11 anti-CD56 (neural cell adhesion molecule 1) antibody (Developmental Studies Hybridoma Bank, Iowa City, IA), amplified, pooled, and frozen. The recovery of mononuclear myoblasts ranged from 10 to 20% of the total cell count in the preparation. When ready for an experiment, the pool of myoblasts was thawed and seeded into 24-well plates (3 × 10⁴ cells per well). Cells were grown at 37 C in a humidified atmosphere of 5% CO2. Differentiation of myoblasts into myotubes was initiated at approximately 90% confluence by switching to α-MEM with antibiotics, 2% fetal bovine serum, and fetuin. The medium was changed every other day. All experiments were performed after 7 d of differentiation, when about 70–80% of mononuclear myoblasts had fused to form multinuclear elongated myotubes. All measurements were done in quadruplicate.
In vitro fat oxidation
Cells were preincubated for 90 min in glucose- and serum-free DMEM, followed by a 3-h incubation with [1-14C]labeled palmitate (1 μCi/ml; Perkin-Elmer, Boston, MA) and nonlabeled (cold) palmitate in differentiation medium with 5.5 mm glucose. Palmitate was coupled to fatty acid-free BSA in a molar ratio of 5:1. After incubation, 14CO2 and 14C ASM (acid-soluble metabolites) were measured as previously described (22). All assays were performed in quadruplicate, and data were normalized to protein content.
In vitro glycogen synthesis
Cells were grown and differentiated as described above. Cultures were preincubated for 90 min in glucose- and serum-free DMEM and then exposed to DMEM supplemented with D[U-14C]glucose (1 μCi/ml; PerkinElmer) in the presence or absence of 100 nm insulin (Humulin; Eli Lilly, Indianapolis, IN) for 3 h to study basal and insulin-mediated glycogen synthesis. After rapidly rinsing each well twice with PBS at 4 C, cells were solubilized by the addition of 250 μl 30% KOH per well. The samples were added to 35 μl of glycogen (Sigma-Aldrich, St. Louis, MO) 60 mg/ml in distilled water and heated at 70 C for 20 min. Then, samples were cooled on ice, and 1 ml ice-cold absolute ethanol was added to precipitate glycogen. Tubes were centrifuged (2000 × g for 20 min at 4 C), and the supernatant was immediately removed and discarded. After one wash with ethanol 70%, the glycogen precipitate was resuspended in 500 μl distilled water, dissolved under shaking for 20 min, and counted by liquid scintillation.
Microarray
A near whole-genome transcriptome analysis was performed using the Illumina bead-based technology and Sentrix Human-6 V2 Expression BeadChip (part no. BD-25-113) (Illumina Inc., San Diego, CA). Cell culture experiments were performed on four independent subjects (two FPLD patients, two control subjects) with duplicate well RNAs extracted for each experiment. These eight RNA samples were assayed in duplicate for a total of 16 near-whole genome transcriptome datasets. Raw data were imported into SAS (v9.1) and low-quality data, specifically probes not above background or with high background intensities, were excluded based on the Illumina platform scanning software metric “detection value” (P < 0.05). Robust multichip average algorithms were used to visualize the transcriptome data before and after normalization of the data. Normalization of the raw data were accomplished as described previously (23). The significance of the fold change of the treatment effect was tested for each gene using ANOVA [PROC MIXED in SAS]. Also, two-sided false discovery rate was calculated for each gene with a cut point at P < 0.05. Pathway analyses were performed using PANTHER (Celera Genomics, Foster City, CA) as previously described (24).
Statistics
If not otherwise indicated, data are expressed as mean ± sem. Group differences were compared by unpaired t test (parametric data) or the Mann-Whitney U test (nonparametric data). Two-way ANOVA was used for multiple comparisons followed by Bonferroni’s post hoc test. A P value <0.05 indicated statistical significance.
Results
Systemic insulin responsiveness
Fasting glucose levels were similar in FPLD patients and in control subjects, whereas fasting insulin, homeostasis model assessment index, and free fatty acid concentrations were significantly increased in FPLD patients (Table 1). After glucose intake, venous glucose concentrations increased similarly in both groups (Fig. 1). However, FPLD patients showed an excessive insulin response. Venous free fatty acids decreased in both groups, but were more efficiently suppressed in control subjects. These observations are consistent with impaired insulin-mediated glucose disposal and an inability to properly suppress lipolysis in FPLD patients. To gain further insight into fatty acid metabolism, we determined venous β-hydroxybutyrate levels as an indicator for hepatic ketogenesis before and 120 min after glucose ingestion. Fasting median (25th/75th percentile) β-hydroxybutyrate concentration was 111 (32/396) μmol/liter in FPLD patients and 74 (14/132) μmol/liter in control subjects [not significant (ns), FPLD vs. controls] and, except for one subject in each group, it decreased below the detection threshold of 10 μmol/liter during GTT. The increased fatty acid oxidation in FPLD patients, at least after the glucose load, may be explained by excessive muscular rather than hepatic β-oxidation.
Table 1.
Baseline characteristics of patients with FPLD and control subjects (mean ± se)
| FPLD | P value | Control | |
|---|---|---|---|
| Women/men (n) | 9/1 | 10/0 | |
| Age (yr) | 39 ± 4 | 42 ± 3 | |
| Body mass index (kg/m2) | 25 ± 0.8 | 22 ± 0.5 | |
| Fasting glucose (mmol/liter) | 4.7 ± 0.1 | 0.13 | 5.0 ± 0.2 |
| Fasting insulin (μU/ml) | 11.0 ± 1.8 | 0.004 | 4.3 ± 0.7 |
| HOMA index | 2.2 ± 0.4 | 0.01 | 1.0 ± 0.2 |
| Fasting free fatty acids (mmol/liter) | 0.84 ± 0.06 | 0.03 | 0.59 ± 0.08 |
| Triacylglycerols (mg/dl) | 261 ± 44 | 0.0004 | 75 ± 10 |
HOMA, Homeostasis model assessment.
Figure 1.
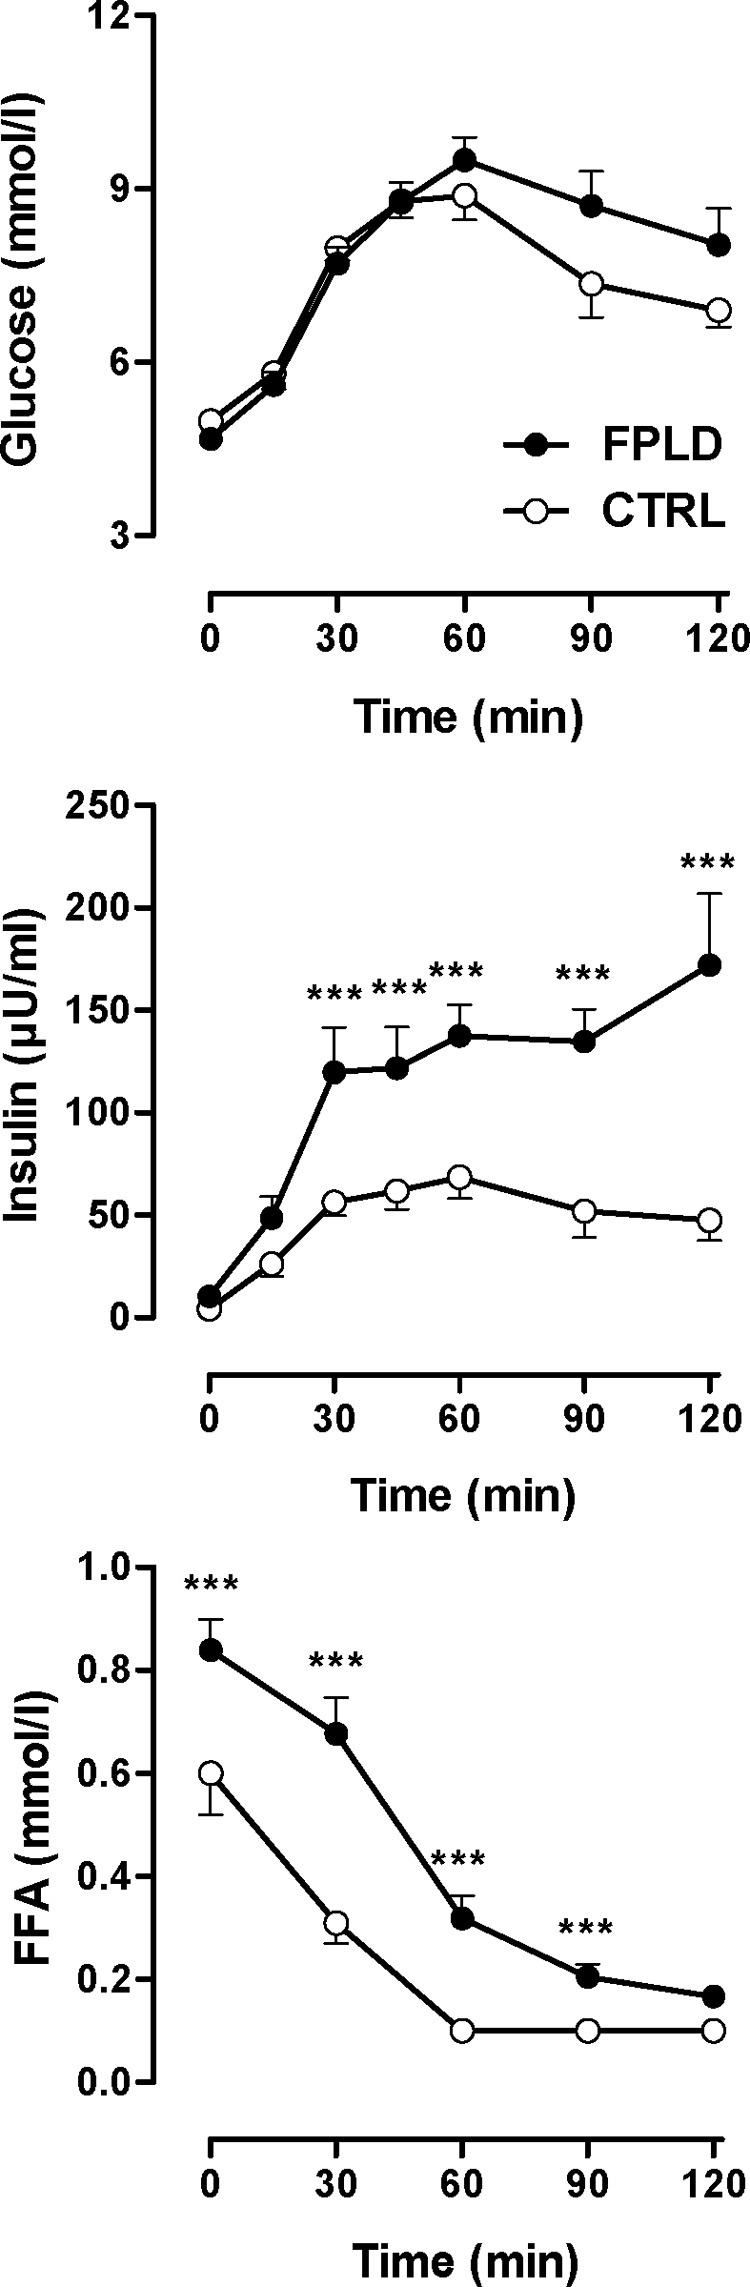
Oral GTT. Serum glucose (top), insulin (middle), and free fatty acids (FFA) (bottom) in FPLD patients (n = 10) and in control subjects (n = 10) before and during oral GTT. ***, P < 0.001 by ANOVA. (Conversion factors to convert to metric units (mg/dl) are as follows: 18.02 for glucose, 0.028 for nonesterified fatty acids).
Systemic accumulation of acylcarnitine metabolites in FPLD patients
We also tested the hypothesis that incomplete lipid oxidation is evident in vivo. To address the issue, we analyzed various acylcarnitine species. Acylcarnitines are formed from acyl-coenzyme A (CoA) intermediates by carnitine acyl transferases and can, in contrast to acyl-CoA, move across intracellular barriers, providing a shuttle mechanism for acyl-CoAs between microsomes, peroxisomes, and mitochondria (25). Acylcarnitines may also leave the cell and enter the blood stream, thus, giving insight in β-oxidation and amino acid catabolism (19). Even chain acylcarnitines with a length between C6 and C22 result from incomplete fatty acid oxidation. C3 and C5 acylcarnitines are produced during amino acid catabolism. C4 acylcarnitine can be produced from either amino acid or fatty acids. None of the acylcarnitines was significantly decreased in FPLD patients (Fig. 2). However, several even-chained (C4, C8, C10) acylcarnitines were significantly increased or tended to be increased in FPLD patients. Of interest, pathway analyses using PANTHER revealed a frequent variability in the expression of genes involved in carnitine metabolism in myotubes derived from FPLD patients (Table 2). Together, these observations suggest that the increase in lipid oxidation in FPLD patients is associated with incomplete fatty acid ß-oxidation.
Figure 2.
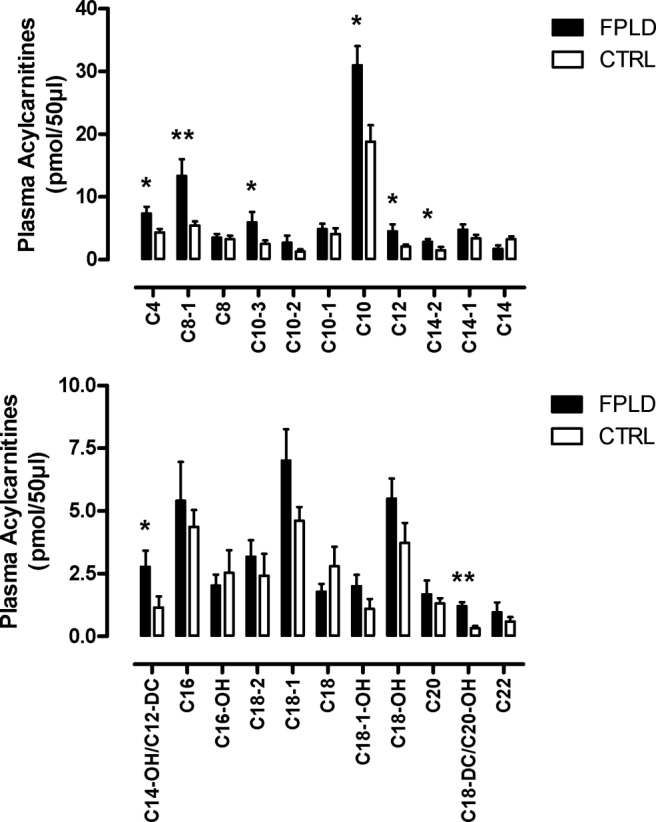
Acylcarnitine profiling. Even chain plasma acylcarnitines from FPLD patients (n = 10) and control subjects (n = 10) after an overnight fast. *, P < 0.05; **, P < 0.01.
Table 2.
Pathway analysis of the variability of gene expression in cultured myotubes derived from two FPLD patients with a LMNA R482W and R482Q mutation, respectively, and two control subjects
| Common name | Gene symbol | GenBank accession number | Fold change | P value |
|---|---|---|---|---|
| Nuclear transport | ||||
| Translocated promoter region | TPR | NM_003292.2 | 25.3 | 0.043 |
| Transportin 2 | TNPO2 | NM_013433.3 | 1.54 | 0.037 |
| Peptidylprolyl isomerase (cyclophilin)-like 3 | PPIL3 | NM_130906.1 | 1.61 | 0.036 |
| Nuclear pore complex interacting protein | NPIP | NM_006985.1 | 1.62 | 0.019 |
| Oxidative phosphorylation | ||||
| NADH dehydrogenase (ubiquinone) 1 β subcomplex, 5, 16 kDa | NDUFB5 | NM_002492.2 | −1.52 | 0.042 |
| NADH dehydrogenase (ubiquinone) 1 α subcomplex, 8, 19 kDa | NDUFA8 | NM_014222.2 | −1.51 | 0.045 |
| Carnitine metabolism | ||||
| α-Methylacyl-CoA racemase | AMACR | NM_203382.1 | −1.99 | 0.005 |
| Chromosome 7 open reading frame 10 | C7ORF10 | NM_024728.1 | −1.51 | 0.040 |
| Glycolysis | ||||
| Phosphofructokinase, liver | PFKL | NM_002626.4 | 1.92 | 0.048 |
| Protein kinase, AMP-activated, α 1 catalytic subunit | PRKAA1 | NM_206907.3 | 1.52 | 0.041 |
| 6-Phosphofructo-2-kinase/fructose-2, 6-biphosphatase 1 | PFKFB1 | NM_002625.2 | −1.75 | 0.025 |
Fold difference between FPLD and controls.
Systemic energy metabolism
Energy expenditure during GTT responded similarly in both groups, although values tended to be higher in FPLD patients (Fig. 3). Both fasting and postprandial RQ were reduced in FPLD patients, indicating increased lipid oxidation in FPLD patients, both in the fasting and in the postprandial state (Fig. 3).
Figure 3.
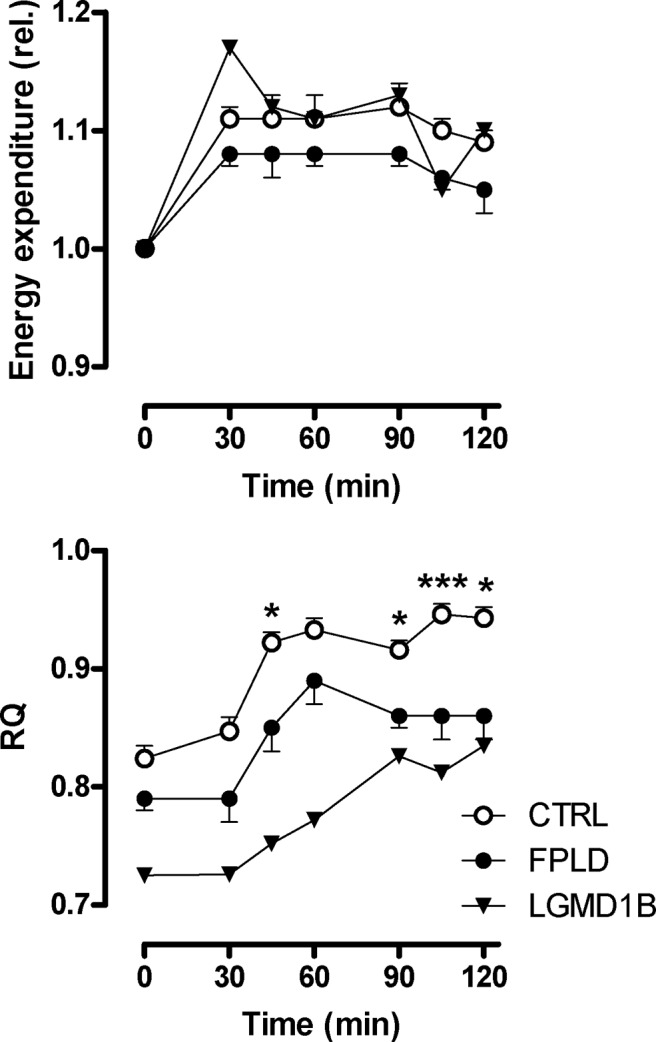
Substrate oxidation measured by indirect calorimetry. Energy expenditure (relative changes, upper panel) and RQ (lower panel) in FPLD patients (n = 10), a patient with LGMD1B, and control subjects (n = 10) before and during oral GTT. The reduced RQ value in FPLD patients and in the LGMD1B patient indicates increased fatty acid oxidation. The inability to increase RQ during glucose loading to normal values is indicative of metabolic inflexibility. *, P < 0.05; ***, P < 0.001 by ANOVA.
Muscle glucose and lipid metabolism in vivo
Microdialysis is a useful technique for monitoring metabolic changes at the tissue level (26,27,28). The ethanol ratio was not different between FPLD patients and control subjects throughout the oral GTT (Fig. 4), suggesting that differences in dialysate metabolite concentrations between groups cannot be explained by differences in tissue perfusion. Because venous glucose concentrations were identical in FPLD patients and in control subjects, similar muscle dialysate glucose concentrations in both groups should be expected. Instead, dialysate glucose concentration was reduced in FPLD patients during the GTT, suggesting either decreased transcapillary glucose transport or increased muscle glucose uptake (Fig. 4). Fasting muscle dialysate lactate concentrations were slightly higher in FPLD patients but increased to a similar level in both groups during GTT. Muscle dialysate pyruvate concentrations were similar at baseline but increased less in FPLD patients vs. control subjects during GTT (Fig. 4). Attenuated pyruvate production in FPLD patients together with significantly higher dialysate lactate/pyruvate ratio is consistent with a less efficient energy generation from glucose metabolism. Given the well-maintained tissue perfusion in FPLD patients, the observation is probably not explained by impaired tissue oxygenation at least under resting conditions. Finally, baseline muscle dialysate glycerol was also significantly higher in FPLD patients vs. control subjects. Dialysate glycerol decreased during GTT in both groups but remained at slightly higher values in FPLD patients vs. control subjects (ns).
Figure 4.

Skeletal muscle microdialysis. Ethanol ratio and dialysate concentrations of glucose, lactate, pyruvate, and glycerol in skeletal muscle in FPLD patients (n = 10) and in control subjects (n = 10) before and during oral GTT. **, P < 0.01; ***, P < 0.001 by ANOVA.
Muscle glucose and lipid metabolism in vitro
Myoblasts from FPLD patients grow slowly and are difficult to expand (29). Therefore, myoblasts from only two FPLD patients were available for further in vitro studies. Total palmitate oxidation in in vitro differentiated myotubes was quantified as the sum of 14CO2 and 14C-intermediate ASM and ranged from 0.64 to 1.28 nmol/3 h/mg protein in control subjects and from 1.6 to 2.0 nmol/3 h/mg protein in FPLD patients (P < 0.05). These differences in fatty acid oxidation in vitro mirror in vivo responses. However, increased palmitate oxidation in FPLD samples resulted from incomplete oxidation (Fig. 5). 14CO2 generation was identical in both groups. Microarray data revealed down-regulation of genes involved in complex I of the respiratory chain in FPLD myotubes (Table 2). To further assess glucose metabolism in myotubes, we measured lactate production and glycogen synthesis. Lactate release was 1.98 ± 0.17 (range, 1.53–2.44; n = 6) μmol/mg in control subjects and 3.1 and 5.8 μmol/mg, respectively, in the two FPLD patients (P < 0.05). The higher rate of anaerobic glycolysis in FPLD myotubes was associated with variations in the expression of regulatory glycolytic genes (Table 2). At baseline, glycogen synthesis ranged between 1.1 and 1.7 nmol/3 h/mg in control and between 1.0 and 2.0 nmol/3 h/mg in FPLD myotubes. After insulin stimulation, glycogen synthesis increased to 1.9–3.4 nmol/3 h/mg in control and to 2.6–4.2 nmol/3 h/mg in FPLD myotubes (ns). Thus, glucose oxidation may be selectively reduced distal to the glycolytic pathway with maintained glycogen synthesis.
Figure 5.
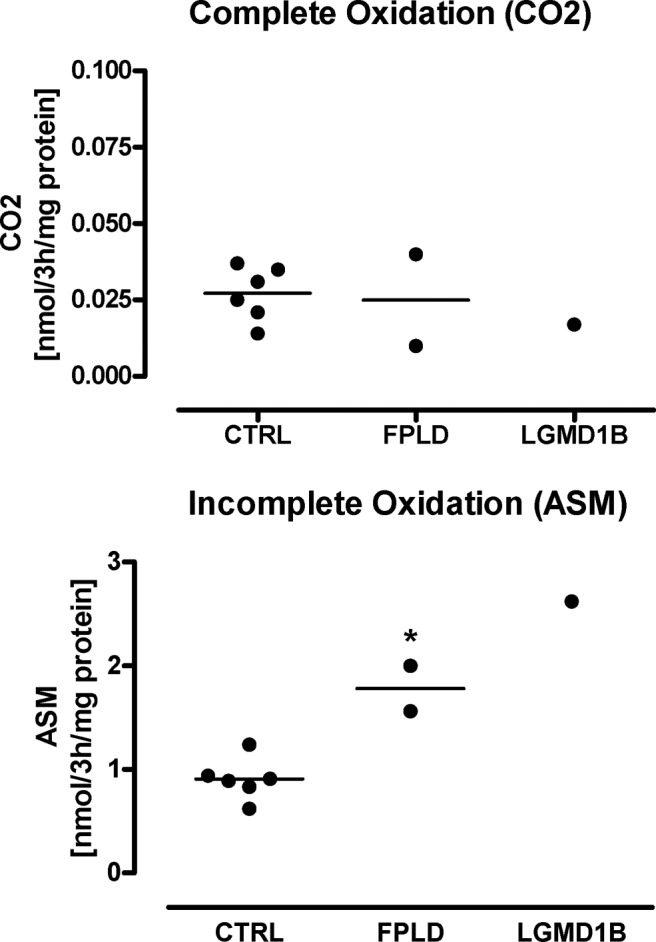
In vitro lipid oxidation. We applied carbon [1-14C]labeled palmitate to in vitro differentiated myoblasts from control subjects (n = 6), FPLD patients (n = 2; 40- and 52-yr-old females with a LMNA R482W and R482Q mutation, respectively), and a patient with LGMD1B (50-yr-old female with LMNA W498C mutations). 14CO2 (upper panel) and 14C-ASM (lower panel) indicated complete and incomplete lipid oxidation, respectively. *, P < 0.05.
Mitochondrial content in myotubes
Mitochondrial DNA copy number per cell was 157 ± 18 in control and 166 ± 45 in FPLD myotubes (ns). Staining of skeletal muscle specimens for cytochrome-C-oxidase and succinate dehydrogenase was unremarkable. The observations suggest that changes in muscle glucose and lipid metabolism in FPLD patients cannot be simply explained by a reduced mitochondrial content.
Intramyocellular lipid deposition
Excessive intramyocellular lipid stores might drive the increased lipid oxidation. Muscular fat stores can be mobilized through β-adrenoreceptor stimulation (14), and increased muscular lipid storage might result in augmented β-adrenoreceptor-mediated lipolysis. After addition of 1 μmol/liter isoproterenol to the perfusate, dialysate glycerol increased by median (25th/75th percentile) 14 (11/31) μmol/liter in FPLD patients and 35 (12/47) μmol/liter in control subjects (ns). Finally, we analyzed muscle biopsy specimen (n = 4) for fiber type, lipid content by oil red O staining, and glycogen deposition (Supplemental Fig. 1, published as supplemental data on The Endocrine Society’s Journals Online web site at http://jcem.endojournals.org). Skeletal muscle samples from patients with T2DM, lipid storage myopathy (carnitine palmitoyltransferase 2 deficiency), and glycogenesis type 2 served as controls. FPLD biopsies showed mild myopathic changes with normal fiber type distribution (11). None of the FPLD biopsies revealed an increase in intramyofibrillar, endomysial, or perimysial lipid or glycogen content.
Glucose and lipid metabolism in a LGMD1B patient
These patients experience weakness of proximal muscles without lipodystrophy and no insulin resistance, T2DM, or dyslipidemia. During GTT, blood glucose and insulin profile was similar to controls (data not shown). However, fasting and postprandial RQs were substantially reduced (Fig. 3). Muscle microdialysis revealed lower dialysate lactate and pyruvate concentrations and higher glycerol concentrations vs. controls, both at baseline and postprandially (data not shown). Palmitate oxidation of in vitro differentiated myoblasts was increased due to augmented incomplete oxidation (Fig. 5). Lactate release was also increased (4.3 μmol/mg). Basal and insulin-stimulated glycogen production was normal.
Discussion
We tested the hypothesis that in FPLD, insulin resistance and impaired aerobic exercise capacity can be explained by a common underlying mechanism, presumably a muscular metabolic defect. FPLD patients showed markedly increased overall lipid oxidation at rest and during oral GTT together with excessive skeletal muscle fatty acid β-oxidation in vitro and in vivo. However, increased systemic medium-chain acylcarnitine and 3-hydroxy-butyrate concentrations suggest that fatty acid oxidation is incomplete. Our study is the first to systematically assess skeletal muscle metabolism in FPLD patients in vitro and in vivo. The results may have implications for treating insulin resistance and T2DM that occur in FPLD patients and may represent a model to help unravel T2DM. FPLD is a rare disease; however, we believe our findings may be germane to other lipodystrophies and conditions leading to T2DM.
Increased fatty acid flux from adipose tissue to other organs may contribute to hepatic steatosis and hypertriglyceridemia in FPLD (10). Patients with HIV-associated lipodystrophy feature impaired lipid oxidation (30). Increased free fatty acid availability, combined with impaired lipid oxidation, could explain intramyocellular lipid accumulation in HIV-associated lipodystrophy (30,31). Reduced mitochondrial uptake and oxidation of free fatty acids has also been linked with more common insulin-resistant states. Intramuscular accumulation of lipid intermediates, such as diacylglycerol and ceramides, may promote serine phosphorylation of insulin receptor substrate-1 (32). Insulin receptor substrate-1 phosphorylation leads to a defect in phosphatidylinositol-3-kinase and glucose transport in skeletal muscle. Indeed, provision of a high-fat diet or lipid infusions reduced insulin stimulated glucose transporter-4 translocation. Yet, intramyocellular lipid content was normal or decreased, lipid oxidation rate was increased, and muscular glucose uptake was preserved in FPLD patients. These paradoxical findings suggest that muscular metabolic abnormalities in FPLD cannot be fully explained by classical concepts of lipodystrophy-associated insulin resistance.
Increased fatty acid supply may drive increased muscular β-oxidation while attenuating muscular glucose utilization (33). Phenotypically, abnormalities in lipid and glucose metabolism in FPLD patients recapitulate such a response. Recent animal studies suggested that obesity-associated insulin resistance in skeletal muscle may result from increased β-oxidation (19). The signal mediating fat-induced insulin resistance could be generated in mitochondria. We observed a reduced expression of genes involved in complex I of the respiratory chain in FPLD myotubes. The reduced expression could disconnect tricarboxylic acid cycle (TCA) and respiratory chain, resulting in an accumulation of medium-chain acylcarnitines and increased ketogenesis. Furthermore, increased β-oxidation may deplete TCA cycle intermediates. On the other hand, reduced complex I expression could lead to reduced nicotinamide adenine dinucleotide (NADH) accumulation within mitochondria. Excessive NADH could then shift the lactate dehydrogenase equilibrium, increasing the cytosolic lactate/pyruvate ratio. Our observations support both ideas. Lactate generation tends to be increased in FPLD patients, suggesting that glycolysis is intact. Interventions decreasing mitochondrial fatty acid import improved glucose metabolism (19). Randle (33) proposed that decreased glycolysis and pyruvate oxidation are explained by inhibition of glycolysis rate-controlling enzymes, hexokinase, phosphofructokinase, and pyruvate dehydrogenase. The pyruvate dehydrogenase complex couples glycolysis with the TCA cycle and is, therefore, essential for aerobic glucose metabolism. Another possible explanation for the impaired glucose oxidation is a more generalized mitochondrial dysfunction. Although we have data from only two FPLD patients, pathway analysis of gene expression in myotubes revealed an increased expression of an AMP-activated protein kinase catalytic subunit and phosphofructokinase, two enzymes important for the regulation of the glycolysis. Previous studies suggested that mitochondrial function is altered in T2DM patients and their insulin-resistant relatives (34,35). Reductions in the number, aberrant location, and morphological changes of mitochondria have been described in insulin-resistant individuals (35,36). Two recent microarray studies showed decreased expression of genes involved in oxidative phosphorylation in T2DM patients (37,38). Yet, we observed normal mitochondrial number in myoblasts from FPLD patients.
Our study necessarily has limitations. We attempted to gain mechanistic inference into a genetic lipodystrophy that features insulin resistance and T2DM by locally studying skeletal muscle and sc fat, although by so doing, we ignore the liver, the brain, the kidney, and the intraabdominal fat, which is very likely more important than sc fat. We cannot state for certain that muscle is the sole tissue affected. We also have only a small number of muscle biopsies because the condition is rare and few patients were willing to undergo biopsies. Furthermore, FPLD myoblasts were difficult to expand in culture. Finally, we have not performed experiments examining insulin-stimulated glucose transport in vivo in the muscle cells. Thus, we cannot address the “lipotoxicity theory” or the “athlete paradox” regarding fatty acid oxidation and triglyceride synthesis in our patients (39). Nevertheless, we believe that our approach was a useful beginning to metabolic alterations in FPLD.
Taken together with existing mechanistic data, our study suggests imbalance between lipid oxidation and oxidative glucose metabolism in FPLD patients. Increased incomplete fatty acid oxidation is also evident in in vitro differentiated myotubes. This observation suggests an intrinsic defect in skeletal muscle metabolism due to lamin A and C dysfunction. The idea is supported by the observation that similar or even more serious abnormalities in muscular fatty acid metabolism also occur in rare patients with LGMD1B. Remarkably, the mutation causing LGMD1B (LMNA W498C) is located in the vicinity of the mutations causing FPLD (R482Q, R582H, R482W). However, the single nonlipodystrophic but muscle-dystrophic patient that we studied was not insulin-resistant. We suggest that the metabolic FPLD phenotype possibly results from the combination of an intrinsic defect in skeletal muscle metabolism combined with lipodystrophic, lipid pressure due to decreased adipose tissue lipid storage capacity. Whether or not incompletely oxidized lipid intermediates or acyl-carnitines contribute to this phenotype is unknown. Impaired oxidative metabolism may explain the inability to tolerate endurance exercise that is commonly reported by FPLD patients. Furthermore, we speculate that insulin resistance in FPLD may be explained by disordered insulin-mediated glucose oxidation rather than insulin-mediated glucose uptake. Therefore, FPLD may be a prototypical model for a “Randle” type insulin resistance. The exact mechanisms through which mutations in the lamin A/C gene cause FPLD-associated metabolic diseases are unknown. Our gene expression analysis suggests that mutation in the lamin A/C gene is associated with dysregulation of genes that are involved in the nuclear transport processes. Through altered nuclear transport, the mutated lamin A/C gene could affect transcription of genes that are crucial to human skeletal muscle growth and metabolism (7).
Supplementary Material
Acknowledgments
We thank Anke Strauss for the careful assessment of our patients. Human myoblast cultures were prepared at the Muscle Tissue Culture Collection at the Friedrich-Baur-Institute (Department of Neurology, Ludwig-Maximilians University, Munich, Germany). The Muscle Tissue Culture Collection is part of the German network on muscular dystrophies (MD-NET, service structure S1, 01GM0601) funded by the German ministry of education and research (BMBF, Bonn, Germany) and is a partner of Eurobiobank (www.eurobiobank.org). The monoclonal 5.1H11 anti-CD56 antibody developed by H. M. Blau and F. S. Walsh was obtained from the Developmental Studies Hybridoma Bank developed under the auspices of the National Institute of Child Health and Human Development and maintained by The University of Iowa, Department of Biological Sciences, Iowa City, Iowa. The authors are very grateful to Michele McNeil and Shantele Thomas (Pennington Biomedical Research Center) for help with the muscle cell culture, and Dr. Steven Barker and Connie David (School of Veterinary Medicine, Louisiana State University) for determination of plasma acylcarnitines.
Footnotes
This work was supported by The Deutsche Forschungsgemeinschaft (Klinische Forschergruppe 192 and grants-in-aid; to M.B. and J.J.) along with a grant-in-aid from GlaxoSmithKline, Inc. Grants from the National Institute of Diabetes and Digestive and Kidney Diseases Clinical Nutrition Research Unit (P30-DK072476) and the U.S. Department of Agriculture 2003-34323-14010 (to S.R.S.) also supported this study.
Disclosure Summary: The authors have nothing to disclose.
First Published Online February 3, 2010
Abbreviations: ASM, Acid-soluble metabolites; CoA, coenzyme A; FPLD, familial partial lipodystrophy; GTT, glucose tolerance testing; LGMD1B, limb girdle muscular dystrophy 1B; NADH, reduced nicotinamide adenine dinucleotide; ns, not significant; RQ, respiratory quotient; TCA, tricarboxylic acid cycle; T2DM, type 2 diabetes mellitus.
References
- Cao H, Hegele RA 2000 Nuclear lamin A/C R482Q mutation in Canadian kindreds with Dunnigan-type familial partial lipodystrophy. Hum Mol Genet 9:109–112 [DOI] [PubMed] [Google Scholar]
- Speckman RA, Garg A, Du F, Bennett L, Veile R, Arioglu E, Taylor SI, Lovett M, Bowcock AM 2000 Mutational and haplotype analyses of families with familial partial lipodystrophy (Dunnigan variety) reveal recurrent missense mutations in the globular C-terminal domain of lamin A/C. Am J Hum Genet 66:1192–1198 [DOI] [PMC free article] [PubMed] [Google Scholar]
- Shackleton S, Lloyd DJ, Jackson SN, Evans R, Niermeijer MF, Singh BM, Schmidt H, Brabant G, Kumar S, Durrington PN, Gregory S, O'Rahilly S, Trembath RC 2000 LMNA, encoding lamin A/C, is mutated in partial lipodystrophy. Nat Genet 24:153–156 [DOI] [PubMed] [Google Scholar]
- Hegele RA, Cao H, Anderson CM, Hramiak IM 2000 Heterogeneity of nuclear lamin A mutations in Dunnigan-type familial partial lipodystrophy. J Clin Endocrinol Metab 85:3431–3435 [DOI] [PubMed] [Google Scholar]
- Gruenbaum Y, Margalit A, Goldman RD, Shumaker DK, Wilson KL 2005 The nuclear lamina comes of age. Nat Rev Mol Cell Biol 6:21–31 [DOI] [PubMed] [Google Scholar]
- Aebi U, Cohn J, Buhle L, Gerace L 1986 The nuclear lamina is a meshwork of intermediate-type filaments. Nature 323:560–564 [DOI] [PubMed] [Google Scholar]
- Maraldi NM, Lattanzi G 2005 Linkage of lamins to fidelity of gene transcription. Crit Rev Eukaryot Gene Expr 15:277–294 [DOI] [PubMed] [Google Scholar]
- Garg A, Peshock RM, Fleckenstein JL 1999 Adipose tissue distribution pattern in patients with familial partial lipodystrophy (Dunnigan variety). J Clin Endocrinol Metab 84:170–174 [DOI] [PubMed] [Google Scholar]
- Haque WA, Vuitch F, Garg A 2002 Post-mortem findings in familial partial lipodystrophy, Dunnigan variety. Diabet Med 19:1022–1025 [DOI] [PubMed] [Google Scholar]
- Lüdtke A, Genschel J, Brabant G, Bauditz J, Taupitz M, Koch M, Wermke W, Worman HJ, Schmidt HH 2005 Hepatic steatosis in Dunnigan-type familial partial lipodystrophy. Am J Gastroenterol 100:2218–2224 [DOI] [PubMed] [Google Scholar]
- Spuler S, Kalbhenn T, Zabojszcza J, van Landeghem FK, Ludtke A, Wenzel K, Koehnlein M, Schuelke M, Lüdemann L, Schmidt HH 2007 Muscle and nerve pathology in Dunnigan familial partial lipodystrophy. Neurology 68:677–683 [DOI] [PubMed] [Google Scholar]
- Spuler S, Geier C, Osterziel KJ, Gutberlet M, Genschel J, Lehmann TN, Zinn-Justin S, Gilquin B, Schmidt H 2005 A new LMNA mutation causing limb girdle muscular dystrophy 1B. J Neurol 252:621–623 [DOI] [PubMed] [Google Scholar]
- Decaudain A, Vantyghem MC, Guerci B, Hécart AC, Auclair M, Reznik Y, Narbonne H, Ducluzeau PH, Donadille B, Lebbé C, Béréziat V, Capeau J, Lascols O, Vigouroux C 2007 New metabolic phenotypes in laminopathies: LMNA mutations in patients with severe metabolic syndrome. J Clin Endocrinol Metab 92:4835–4844 [DOI] [PubMed] [Google Scholar]
- Jordan J, Tank J, Stoffels M, Franke G, Christensen NJ, Luft FC, Boschmann M 2001 Interaction between β-adrenergic receptor stimulation and nitric oxide release on tissue perfusion and metabolism. J Clin Endocrinol Metab 86:2803–2810 [DOI] [PubMed] [Google Scholar]
- Boschmann M, Engeli S, Adams F, Gorzelniak K, Franke G, Klaua S, Kreuzberg U, Luedtke S, Kettritz R, Sharma AM, Luft FC, Jordan J 2005 Adipose tissue metabolism and CD11b expression on monocytes in obese hypertensives. Hypertension 46:130–136 [DOI] [PubMed] [Google Scholar]
- Hickner RC, Ekelund U, Mellander S, Ungerstedt U, Henriksson J 1995 Muscle blood flow in cats: comparison of microdialysis ethanol technique with direct measurement. J Appl Physiol 79:638–647 [DOI] [PubMed] [Google Scholar]
- Hickner RC, Bone D, Ungerstedt U, Jorfeldt L, Henriksson J 1994 Muscle blood flow during intermittent exercise: comparison of the microdialysis ethanol technique and 133Xe clearance. Clin Sci (Lond) 86:15–25 [DOI] [PubMed] [Google Scholar]
- Ståhle L, Segersvärd S, Ungerstedt U 1991 A comparison between three methods for estimation of extracellular concentrations of exogenous and endogenous compounds by microdialysis. J Pharmacol Methods 25:41–52 [DOI] [PubMed] [Google Scholar]
- Koves TR, Ussher JR, Noland RC, Slentz D, Mosedale M, Ilkayeva O, Bain J, Stevens R, Dyck JR, Newgard CB, Lopaschuk GD, Muoio DM 2008 Mitochondrial overload and incomplete fatty acid oxidation contribute to skeletal muscle insulin resistance. Cell Metab 7:45–56 [DOI] [PubMed] [Google Scholar]
- Bergstrom J 1975 Percutaneous needle biopsy of skeletal muscle in physiological and clinical research. Scand J Clin Lab Invest 35:609–616 [PubMed] [Google Scholar]
- Ukropcova B, McNeil M, Sereda O, de Jonge L, Xie H, Bray GA, Smith SR 2005 Dynamic changes in fat oxidation in human primary myocytes mirror metabolic characteristics of the donor. J Clin Invest 115:1934–1941 [DOI] [PMC free article] [PubMed] [Google Scholar]
- Hulver MW, Berggren JR, Carper MJ, Miyazaki M, Ntambi JM, Hoffman EP, Thyfault JP, Stevens R, Dohm GL, Houmard JA, Muoio DM 2005 Elevated stearoyl-CoA desaturase-1 expression in skeletal muscle contributes to abnormal fatty acid partitioning in obese humans. Cell Metab 2:251–261 [DOI] [PMC free article] [PubMed] [Google Scholar]
- Sparks LM, Xie H, Koza RA, Mynatt R, Hulver MW, Bray GA, Smith SR 2005 A high-fat diet coordinately downregulates genes required for mitochondrial oxidative phosphorylation in skeletal muscle. Diabetes 54:1926–1933 [DOI] [PubMed] [Google Scholar]
- Thomas PD, Campbell MJ, Kejariwal A, Mi H, Karlak B, Daverman R, Diemer K, Muruganujan A, Narechania A 2003 PANTHER: a library of protein families and subfamilies indexed by function. Genome Res 13:2129–2141 [DOI] [PMC free article] [PubMed] [Google Scholar]
- Ramsay RR 2000 The carnitine acyltransferases: modulators of acyl-CoA-dependent reactions. Biochem Soc Trans 28:182–186 [DOI] [PubMed] [Google Scholar]
- Arner P, Liljeqvist L, Ostman J 1976 Metabolism of mono- and diacylglycerols in subcutaneous adipose tissue of obese and normal-weight subjects. Acta Med Scand 200:187–194 [DOI] [PubMed] [Google Scholar]
- Boschmann M, Jordan J, Adams F, Christensen NJ, Tank J, Franke G, Stoffels M, Sharma AM, Luft FC, Klaus S 2003 Tissue-specific response to interstitial angiotensin II in humans. Hypertension 41:37–41 [DOI] [PubMed] [Google Scholar]
- Janke J, Engeli S, Boschmann M, Adams F, Böhnke J, Luft FC, Sharma AM, Jordan J 2006 Retinol-binding protein 4 in human obesity. Diabetes 55:2805–2810 [DOI] [PubMed] [Google Scholar]
- Naetar N, Foisner R 2009 Lamin complexes in the nuclear interior control progenitor cell proliferation and tissue homeostasis. Cell Cycle 8:1488–1493 [DOI] [PubMed] [Google Scholar]
- Luzi L, Perseghin G, Tambussi G, Meneghini E, Scifo P, Pagliato E, Del Maschio A, Testolin G, Lazzarin A 2003 Intramyocellular lipid accumulation and reduced whole body lipid oxidation in HIV lipodystrophy. Am J Physiol Endocrinol Metab 284:E274–E280 [DOI] [PubMed] [Google Scholar]
- Torriani M, Thomas BJ, Barlow RB, Librizzi J, Dolan S, Grinspoon S 2006 Increased intramyocellular lipid accumulation in HIV-infected women with fat redistribution. J Appl Physiol 100:609–614 [DOI] [PMC free article] [PubMed] [Google Scholar]
- Le Marchand-Brustel Y, Gual P, Grémeaux T, Gonzalez T, Barrès R, Tanti JF 2003 Fatty acid-induced insulin resistance: role of insulin receptor substrate 1 serine phosphorylation in the retroregulation of insulin signalling. Biochem Soc Trans 31:1152–1156 [DOI] [PubMed] [Google Scholar]
- Randle PJ 1998 Regulatory interactions between lipids and carbohydrates: the glucose fatty acid cycle after 35 years. Diabetes Metab Rev 14:263–283 [DOI] [PubMed] [Google Scholar]
- Petersen KF, Dufour S, Befroy D, Garcia R, Shulman GI 2004 Impaired mitochondrial activity in the insulin-resistant offspring of patients with type 2 diabetes. N Engl J Med 350:664–671 [DOI] [PMC free article] [PubMed] [Google Scholar]
- Kelley DE, He J, Menshikova EV, Ritov VB 2002 Dysfunction of mitochondria in human skeletal muscle in type 2 diabetes. Diabetes 51:2944–2950 [DOI] [PubMed] [Google Scholar]
- Ritov VB, Menshikova EV, He J, Ferrell RE, Goodpaster BH, Kelley DE 2005 Deficiency of subsarcolemmal mitochondria in obesity and type 2 diabetes. Diabetes 54:8–14 [DOI] [PubMed] [Google Scholar]
- Mootha VK, Lindgren CM, Eriksson KF, Subramanian A, Sihag S, Lehar J, Puigserver P, Carlsson E, Ridderstråle M, Laurila E, Houstis N, Daly MJ, Patterson N, Mesirov JP, Golub TR, Tamayo P, Spiegelman B, Lander ES, Hirschhorn JN, Altshuler D, Groop LC 2003 PGC-1α-responsive genes involved in oxidative phosphorylation are coordinately downregulated in human diabetes. Nat Genet 34:267–273 [DOI] [PubMed] [Google Scholar]
- Patti ME, Butte AJ, Crunkhorn S, Cusi K, Berria R, Kashyap S, Miyazaki Y, Kohane I, Costello M, Saccone R, Landaker EJ, Goldfine AB, Mun E, DeFronzo R, Finlayson J, Kahn CR, Mandarino LJ 2003 Coordinated reduction of genes of oxidative metabolism in humans with insulin resistance and diabetes: potential role of PGC1 and NRF1. Proc Natl Acad Sci USA 100:8466–8471 [DOI] [PMC free article] [PubMed] [Google Scholar]
- Liu L, Shi X, Choi CS, Shulman GI, Klaus K, Nair KS, Schwartz GJ, Zhang Y, Goldberg IJ, Yu YH 2009 Paradoxical coupling of triglyceride synthesis and fatty acid oxidation in skeletal muscle overexpressing DGAT1. Diabetes 58:2516–2524 [DOI] [PMC free article] [PubMed] [Google Scholar]
Associated Data
This section collects any data citations, data availability statements, or supplementary materials included in this article.