

Abstract
In nature the four electron reduction of O2 to H2O is carried out by Cytochrome c Oxidase (CcO) and the multicopper oxidases (MCOs). In the former, Cytochrome c provides electrons for pumping protons to produce a gradient for ATP synthesis, while in the MCOs the function is the oxidation of substrates, either organic or metal ions. In the MCOs the reduction of O2 is carried out at a trinuclear Cu cluster (TNC). Oxygen intermediates have been trapped which exhibit unique spectroscopic features that reflect novel geometric and electronic structures. These intermediates have both intact and cleaved O-O bonds, allowing the reductive cleavage of the O-O bond to be studied in detail both experimentally and computationally. These studies show that the topology of the TNC provides a unique geometric and electronic structure particularly suited to carry out this key reaction in Nature.
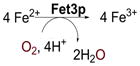
The multicopper oxidases (MCOs) couple four 1-electron oxidations of substrate to the four electron reductive cleavage of the O-O bond of dioxygen using a minimum of four Cu atoms (table 1).1,2 Among these four Cu’s is a type 1 (T1) or blue Cu site, characterized by an intense SCys → Cu(II) charge transfer (CT) transition at around 600 nm in the absorption spectrum and a uniquely small A|| in its electron paramagnetic resonance (EPR) spectrum. This is the site of substrate oxidation, and from table 1, the MCOs can be divided into two classes depending upon the identity of the substrate. For enzymes such as laccase3 and ascorbate oxidase,4 redox active organic molecules which can interact weakly with the enzyme provide the electrons. For MCOs like Fet3p5 and Ceruloplasmin,6 the substrate is a metal ion (ferrous in these cases) which binds tightly to a substrate binding site. As shown in figure 1, these substrate binding sites are located near the His ligands of the T1 Cu center. The electron from substrate is first transferred to the T1 and then over >13Å through a Cys-His pathway to a trinuclear Cu cluster (TNC) where O2 is reduced to water (vide infra).7 We first consider the electron transfer (ET) pathways to the TNC.
Table 1.
Members of the Multicopper Oxidase family of enzymes separated into two classes: those that oxidize small organic substrates and those that oxidize metal ion substrates.
| Organic substrates |
Metal ion substrates |
|
|---|---|---|
| -plant and fungal laccases (lc) | -Fet3p | |
| -Ascorbate Oxidase | -Ceruloplasmin | |
| -CotA | -CueO | |
| -Phenoxazinone Synthase | -MnxG | |
 |
||
Figure 1.

The structure of the MCO active site with arrows marking the flow of substrates, electrons (e−), and O2.
ET Pathways
Here we focus on the Fe(II) binding site of the enzyme Fet3p, which is involved in the uptake of iron by yeast.8 (Studies on this enzyme were performed in collaboration with Prof. Dan Kosman and coworkers.) A variable-temperature, variable-field magnetic circular dichroism (VTVH MCD) methodology we developed in other studies was applied to probe this ferrous site.9–11 From figure 2A dark blue, there is a characteristic feature at 8900 cm−1 in the MCD spectrum corresponding to Fe(II) binding with a high affinity (KB > 105 M−1, from MCD titration studies) to a 6 coordinate site in the protein.12 In the light blue spectrum this feature is eliminated and a peak at 9700 cm−1, corresponding to aqueous Fe(II) (green) is observed when Zn(II) is first bound to the substrate site, inhibiting ferroxidase activity.
Figure 2.

Near-IR MCD spectra of Fe(II) binding to fully reduced Fet3. Competition of Fe(II) with Zn(II) is shown in A and the effects of Fe(II) ligand mutations in B.12
From mutagenesis studies we have found that three carboxylates are involved in the Fe(II) binding site in Fet3p.12,13 Changing E185 to alanine leads to an aqueous Fe(II) spectrum (red in figure 2B) reflecting the fact that the Fe(II) binding constant has decreased by >103. The associated rate of ET for Fe(II) to the T1 Cu has also decreased by >102 (table 2). More interestingly, when Glu185 is replaced by an Asp, the Fe(II) again binds with a high affinity but the rate of ET from the Fe(II) to the T1 Cu has decreased by an order of magnitude (table 2). This shows that E185 both plays the role of a ligand in tightly binding the Fe(II) to the protein and provides a specific superexchange pathway for ET from the Fe(II) to the T1 Cu. From figure 3, E185 is H-bonded to one of the His ligands of the T1 Cu and the shorter Asp residue would disrupt this superexchange pathway contribution to the electronic coupling (HDA) between the Fe(II) and T1 Cu.
Table 2.
Electron transfer rates from Fe(II) to the T1 Cu site and Fe(II) binding constants for WT Fet3p and the E185D/A mutants.12
| kET (s−1) | KB (M−1) | |
|---|---|---|
| WT | ≥1200 | ≥1 × 10⁵ |
| E185D | 141 ± 7 | ≥1 × 10⁵ |
| E185A | 7.8 ± 0.2 | ≤1 × 10² |
Figure 3.
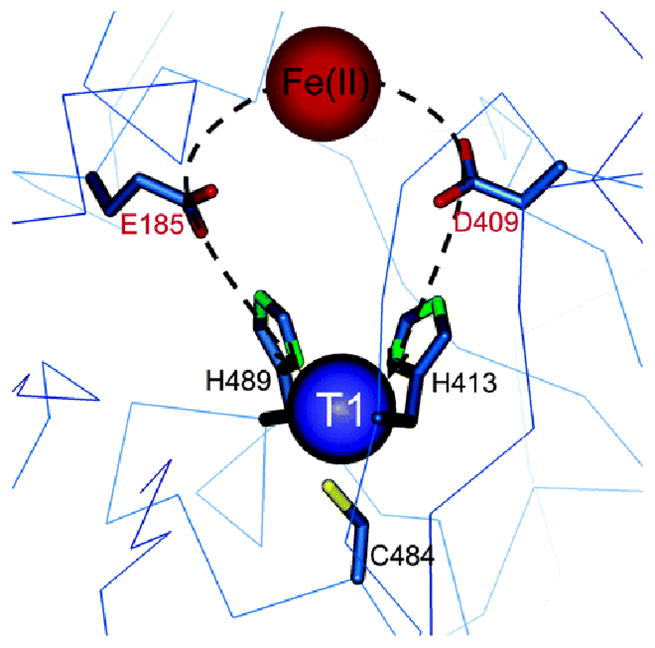
Structure of Fet3p showing that E185 directly coordinates to Fe(II) and is H-bonded to H489 which is coordinated to the T1 Cu, providing an efficient superexchange pathway for ET.13
In Figure 4 we show the superexchange pathway from the T1 Cu to the TNC.14 We have studied the T1 site in detail and found that the high anisotropic covalency of the Cu-SCys bond activates the Cys-His pathway for ET to the TNC.15 In the contour in figure 4A the π delocalization of the Cu into the sulfur extends through the protein backbone and exits σ to the remote Cu center. An additional π to σ pathway is also present which involves an H-bond through a backbone carbonyl oxygen.14 This can be regulated by a change in the O…H distance. From the resonance Raman spectrum (rR) shown in figure 5, the enhanced vibrations of the T1 center change when the Cu’s of the TNC change redox state. These rR spectra reflect the Cu-S stretch and its coupling to vibrations of the Cys and the protein backbone.16 The change in the spectrum shows that the protein backbone is affected by changes in the redox state of the TNC. This can affect the O…H bond distance and the coupling between the multiple ET pathways. Thus different redox states (and intermediates) at the TNC can regulate ET from the T1 Cu.
Figure 4.

Superexchange pathway fro ET from the T1 to TNC Cu sites (A) and a molecular orbital contour showing the ET pathway between the T1 and TNC Cu sites (B).14
Figure 5.
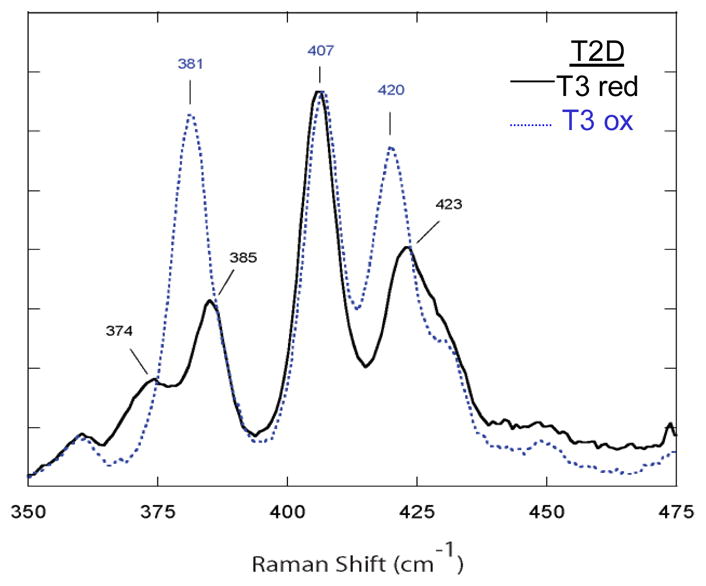
The rR spectrum of T1 Cu of T2D laccase (taken with laser excitation at 647.1 nm) with the T3 site in both the oxidized and reduced states.16
Reduction of O2 to H2O
The electrons from substrates are transferred to the TNC which is comprised of a Type 3 (T3) Cu pair and a Type 2 (T2) Cu (figure 6).17,18 In the resting enzyme the T3 Cu(II)’s are antiferromagnetically (AF) coupled through a bridging hydroxide ligand. They are held to the protein by 3 His ligands per Cu center. Within 3.5 Å is the T2 Cu(II). It is held in the protein by two His ligands that are above and below the Cu3 plane. There is an additional hydroxide ligand on the T2 Cu center external to the cluster which remains hydroxide throughout the entire functional pH range.19 From our electronic structure and spectroscopic studies on the resting TNC all three Cu(II)’s have an open coordination position oriented into the cluster. This coordination unsaturation is set up for bridged intermediates in the reduction of O2 to H2O (vide infra). This coordination unsaturation of a +4 charged cluster in solution is very interesting. We find that this results from four anionic carboxylate residues within ~10 Å of the TNC that destabilize water from bridging as OH− or O2− within the cluster and tunes its redox properties for the reduction of O2 to H2O. We first consider the T3 Cu center and how it relates to the coupled binuclear sites in Hemocyanin (Hc) and Tyrosinase (Tyr).
Figure 6.

(A) Geometric structure of the TNC and (B) the electronic structure of the resting TNC.19
O2 reactivity: T3 vs Coupled Binuclear Cu (Hc and Tyr) sites
It is important to emphasize that while Hc and Tyr also have two coppers each held in the protein by three His ligands, they have a fundamentally different reactivity with dioxygen. We probed this directly using X-ray absorption spectroscopy (XAS) at the Cu K-edge. In collaborative studies with Prof. Keith Hodgson, we have shown that there is a feature at 8984 eV characteristic of reduced, Cu(I), which is not present in oxidized, Cu(II), sites.20 From figure 7A, deoxy Hc has two reduced Cu’s which are oxidized to two Cu(II)’s in oxy Hc based on the loss of the 8984 eV feature.21 We have characterized a type 2 depleted (T2D) derivative of the MCO’s where the T2 Cu is reversibly removed and remaining is the T3 (and T1) to react with O2.22 From figure 7B, in contrast to Hc and Tyr, the reduced T3 Cu center does not react with O2.20
Figure 7.

Cu K-edge X-ray absorption spectra of deoxy Hc21 (A) and T2D laccase20 (B) and their reactions with O2.
As a reference we first consider the reversible binding of O2 by Hc. Deoxy Hc has two Cu(I)’s at a distance of ~4.5 Å. This reacts with triplet O2 to generate oxy Hc which has two Cu(II)’s (vide supra) side-on bridged by peroxide at a Cu-Cu distance of 3.6 Å.23 This is an antiferromagnetically (AF) coupled singlet center, thus, this reaction is spin forbidden. A reaction coordinate was generated by systematically varying the distance of the peroxide above the molecular plane and optimizing the rest of the structure.25 From figure 8A, left to right, the structure first butterflies then goes to an asymmetric end-on/side-on bridged structure and then end-on/end-on bridged in the reversible loss of O2. These structures maximize metal-ligand overlap with increasing distances of the oxygen from the copper. From figure 8B, proceeding along this coordinate the peroxide gets less negative and the Cu’s less positive indicating that charge is transferred from peroxide to the two Cu(II)’s. Importantly, the charge on both Cu’s changes at the same rate even in the asymmetric bridged structure (dashed) indicating that O2 binding involves the simultaneous transfer of two electrons.
Figure 8.

Reaction coordinate of O2 binding to Hc viewed along the O-O bond (top) and then perpendicular to the initial Cu2O2 plane (bottom) (A) and plots of the charge transfer (B) and singlet/triplet intersystem crossing energy (C) along the reaction coordinate. R:d(X X) is the distance between the center of the O–O and Cu–Cu vectors. R:d(X–X) values less than ~0.6 and greater than ~0.6 represents symmetric and asymmetric O2 coordination, respectively.24
Figure 8C accounts for the change in spin and total energy along the reaction coordinate. Oxy Hc has a singlet ground state due to AF coupling of the two Cu(II)’s through the π* orbital of the μ-η2:η2 peroxide in the molecular plane. As we proceed along the coordinate the structure becomes butterflied and each Cu(II) interacts with a different π* orbital on the peroxide. This involves orthogonal magnetic orbitals producing a triplet ground state for the butterflied structure. The peroxide can then directly transfer one electron of the same spin to each Cu leading to triplet dioxygen which is further energetically stabilized by single center exchange.24
Importantly, O2 binding to Hc is found to be exothermic by 3 kcal/mol.25 This is contrasted to O2 binding to the deoxy T3 center of T2D laccase in figure 9, where O2 binding is found to be uphill by 6 kcal/mol. As shown in figure 10 the origin of this 10 kcal/mol destabilization of O2 binding relative to Hc reflects the relative stabilization of the deoxy T3 structure in the MCO protein environment. The deoxy potential energy surfaces in figure 10 were obtained by geometry optimizing the reduced Hc and T3 sites with their respective protein constraints imposed on the deoxy structures. From figure 10, the deoxy T3 center (red) is 7 kcal/mol lower in energy than deoxy Hc (blue) and has an equilibrium Cu(I)-Cu(I) distance of 6.5 Å, in contrast to the 4.2 Å optimized distance of deoxy Hc. This decrease in energy of the deoxy T3 center dominantly reflects the decrease in electrostatic repulsion of the two Cu(I)’s in the low dielectric of the protein (dashed blue) and an additional smaller contribution due to a decrease in sterric interactions of the three His ligands between Cu centers which are eclipsed in the T3 center and staggered in Hc (difference between dashed red and dashed blue). Thus the lack of O2 reactivity of the deoxy T3 site reflects its electrostatic and structural stabilization at its long 6.5 Å Cu-Cu distance. From figure 11 the large structural differences between the coupled binuclear site in Hc and the T3 site in the MCO’s relate to very different structural constraints in the two protein environments. The binuclear cuprous site of deoxy Hc is kept at its 4.2 Å Cu-Cu distance due to the constraint associated with two His ligands, one on each Cu, each deriving from a different helix bundle held together by a salt bridge. Alternatively in the T3 Cu center the two Cu(I)’s are kept at an electrostatically stable distance of 6.5 Å by two sets of two His ligands, where each set is from an H-X-H bridging motif that is on a loop extending from a β sheet, leaving the Cu(I)’s relatively unconstrained.
Figure 9.

Energy of O2 binding to the T3 Cu site with S=0 in blue and S=1 in red.25
Figure 10.
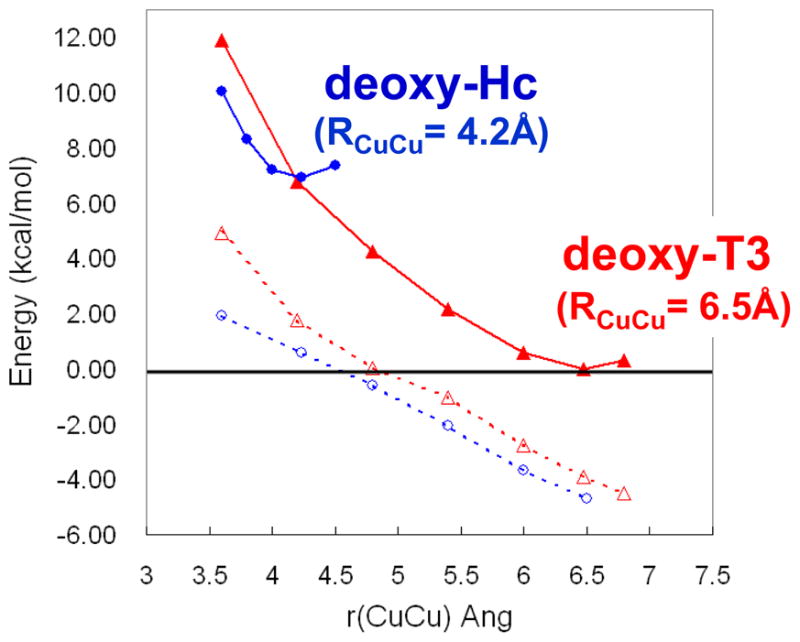
Potential energy surfaces for deoxy-Hc and deoxy-T3 sites as a function of Cu-Cu distance (dashed lines show the energy of electrostatic interaction between the two Cu(I) centers).25
Figure 11.

Comparison of the constrained structures of deoxy-Hc (PDB code 1JS8) and deoxy-T3 (PDB code 1GYC).
In summary deoxy Hc is electrostatically destabilized to react with O2 to form oxy Hc and this can be cooperatively regulated by changing the Cu(I)-Cu(I) distance in tensed and relaxed protein quaternary structures,26 while the reduced T3 site in the MCOs is electrostatically stable and does not react with O2 when the T2 Cu is not present.
O2 Reactivity: The Trinuclear Cu Cluster (TNC)
The native enzyme with its intact TNC reduced and a reduced T1 reacts with O2 to generate the native intermediate (NI).27,28 (Scheme 1, top) Derivatives of the native enzyme have been prepared where the T1 is either eliminated29,30 (replacement of the Cys ligand of the T1 with a Ser to generate a type 1 depleted or T1D form) or replaced by a redox innocent mercuric ion (the T1Hg derivative).31,32 These have valid TNCs which, when reduced, react with O2 with essentially the same rate constant as the native enzyme. (kNat = 1.7 × 10⁶ M−1s−1, kT1Hg = 2.2 × 10⁶ M−1s−1)33 This reaction generates a species with at least one less electron transferred to O2 which we have, in fact, determined to be a peroxide intermediate (PI).34 (Scheme 1, bottom) The rates of formation show that PI is kinetically competent to be a precursor to NI and indeed we have found that PI decays to NI. The conversion of PI to NI is very fast for the native enzyme as it involves two electron reduction of peroxide, but is ~106 slower for the T1D/T1Hg derivatives where the electron from the T1 is not available.35 We will first consider new results on PI, then the definition of the unique spectral features, and the electronic and geometric structure of NI. Using the decreased rate of the PI → NI decay in the T1D/T1Hg derivatives, we can then experimentally and computationally evaluate the reductive cleavage of the O-O bond.
Scheme 1.

Schematic of the O2 reactivity of both native and T1D/T1Hg forms of the MCOs and the cleavage of the O-O bond.
Peroxide Intermediate (PI)
In earlier studies we used isotope-ratio mass spectrometry (IRMS) and the ligand field (LF) transitions (from circular dichroism) to find that the reaction of reduced T1D/T1Hg with O2 produced a peroxide bound to two Cu(II) ions. From EPR, low temperature (LT) MCD, and SQUID magnetic susceptibility the Cu(II)’s are AF coupled and therefore bridged.34 There was no pH dependence or kinetic isotope effect (KIE) on the reaction of O2 with the reduced TNC; therefore, a proton is not involved in the formation of PI.35 From a combination of spectroscopic studies on the peroxide adduct (PA) of the TNC36 (where all Cu’s are oxidized with peroxide bound), QM/MM studies of PI and PA,37 and EXAFS studies we found that peroxide formed an internal bridge between the T2 and T3 Cu centers.
Importantly, from figure 12, the peroxide to Cu(II) charge transfer (CT) spectrum of PI is very different from that of oxy Hc indicating a very different geometric and electronic structure. However, if O2 is computationally added to the reduced TNC and optimized, a side-on bridged structure is obtained (figure 13, left), which as described earlier, is energetically unfavorable and not consistent with the absorption spectrum in figure 12. Importantly, if an Asp, present in the crystal structure (D94 in Fet3p) near the T2 Cu, is included in the calculation a structure consistent with the spectrum is obtained with the peroxide binding η2 to the T3 CuB (nearer to the Asp) and η1 to each of the other two Cu’s (figure 13, right).38 This computational result is consistent with experimental results where the D94A and D94N mutants do not react with O2, while replacing D with a negatively charged E residue allows the O2 reaction to occur.39,40 This μ3-1,1,2 structure appears to be required for the irreversible binding of O2 and its activation for further reduction. From electronic structure calculations supported by spectroscopic data (figure 14) both the T2 and T3CuB are oxidized due to the presence of the Asp which reduces their potential, and each has significant π*σ character leading to the strong AF coupling determined experimentally for PI.38
Figure 12.

Peroxide to Cu(II) Charge transfer absorption spectrum of oxy-Hc (black) and PI (red).38
Figure 13.

Calculated geometric structures of PI without and with D94. The PI structure without D94 (left) has both T3 Cu’s oxidized (Cu2+) and the T2 Cu reduced (Cu+) while in the structure with D94 (right), the T3B and the T2 are oxidized and the T3A is reduced.38
Figure 14.

Contours of the - (based on the T2 dx2-y2)and β- (based on the T3B dx2-y2) LUMOs of PI+D94. The side view of -LUMO is also shown in (a) for better viewing of 38 the T2 dx2-y2 orbital.38
Native Intermediate (NI)
When the reduced native MCOs react with oxygen, CT absorption features appear at 365 and 318 nm (27,560 and 31,780 cm−1), as do the spectral features of the oxidized T1 Cu. Therefore, at least one additional electron has been transferred to O2 relative to PI. From the XAS spectra in figure 15A, all Cu’s are fully oxidized in NI, yet from figure 15B, the TNC in NI has a very different EPR signal than the fully oxidized resting TNC or most Cu(II) complexes, as it has g values significantly lower than 2.0.41 The CT features of NI also show a unique derivative shaped pseudo-A term in the MCD spectrum (figure 15C positive band at 27,560 cm−1 and negative band at 31,780 cm−1). From the field dependence of the MCD signal at low temperature the ground state is S = ½. There is a very interesting behavior in the temperature dependent MCD spectrum where the signal does not just decrease with increasing temperature (as 1/T) but changes indicating a Boltzmann population of a low lying excited state with a different MCD signal. From the plot of the MCD intensity with respect to temperature in figure 15D, this excited state is at ~150 cm−1 above the ground state. Therefore, NI has a fully oxidized TNC but with strange spectral features: an S=1/2 ground state with g values below 2.0, a low lying excited state at ~150 cm−1, and an intense pseudo-A term in the CT region of the MCD spectrum.41 We consider the geometric and electronic structural origin of the unique spectral features of NI below.
Figure 15.

Cu K-edge XAS spectrum (A), LT X-band EPR spectrum (B), rapid freeze quench MCD spectrum (C), and plot of the temperature dependence of the MCD intensity at 25,000 cm−1 (D) of NI.41
Origin of the Low Lying Excited State: Spin Frustration
From EXAFS data, NI shows a Cu-Cu interaction at 3.3 Å which, from magneto-structural calculations, corresponds to a bridged pair of Cu(II)’s with a singlet/triplet splitting of 520 cm−1 (figure 16A).41 In a trinuclear Cu(II) system, the third S=1/2 couples to the dimer states to give a doublet ground state and doublet and quartet excited states at 2J (~520 cm−1) (figure 16B left). Including a bridge to the 3rd Cu splits the doublet/quartet energy but the excited doublet energy decreases only slightly to ~440 cm−1 (figure 16B center). However, upon adding a third bridge to fully couple the trimer, an interesting situation develops called spin frustration (figure 16B right). All spin pairs want to be AF coupled; however, this cannot be accomplished in a triangular configuration. This leads to the excited doublet state greatly decreasing in energy, close to the ground state doublet. The 150 cm−1 excited state splitting observed experimentally corresponds to the approximate pairwise exchange parameters given in figure 16C, indicating that NI must be an all bridged TNC.
Figure 16.

Magneto-structural correlations of the Cu-Cu distance and angle with exchange coupling constants (J) for OH bridged binuclear Cu(II) model complexes (A), energy splittings of doublet and quartet states of a Cu(II) trimer with 1, 2, and 3 bridging interactions (B), and pairwise exchange parameters for NI (C).41
Origin of the g < 2.0: Antisymmetric Exchange
As shown in figure 17, a symmetric all equally bridged TNC, through the spin frustration described above, has a 2E ground state. This will undergo a zero field splitting (ZFS) due to in-state spin-orbit coupling to produce two doublets split by Δ (figure 17, center). In a magnetic field aligned parallel to the z axis of the TNC, these undergo the usual Zeeman splitting with a g|| value greater than 2.0. However, when the field is rotated off the z axis there is an interaction between the doublets, leading to a non-linear field dependence and requiring higher fields to satisfy the EPR resonance condition and therefore, g⊥ ≪ 2.0 (figure 17 right). However, this predicted behavior has not been previously experimentally evaluated. Thus, we have performed single crystal EPR studies on the Tris-OH bridged trinuclear Cu(II) complex synthesized and structurally defined by Stack and Mirica (scheme 2).42 From the data in figure 18, while g|| = 2.3, the g value greatly decreases as the field is oriented off the z axis going down to an unprecedented g ~ 1.2 before it becomes too broad to observe.43 This experimentally confirms that the ZFS of the 2E ground state of this complex derives from antisymmetric exchange. This requires good ground-to-ground state exchange coupling, spin-orbit coupling (SOC) of the ground to an excited state on one Cu(II), and good exchange coupling of this excited state to the ground state on an adjacent Cu(II). From the contours in figure 19, the hydroxide bridges of the Tris-OH structure provide good exchange coupling between ground dx2-y2 orbitals on adjacent Cu(II)’s and good exchange coupling of the spin orbit coupled dxy excited state with the dx2-y2 ground state of adjacent Cu(II)’s. Importantly, these studies show that the low g values of NI logically derive from its all bridged structure. This leads to two possible structures for NI, either with three OH bridges (two from O2 reduction and one from H2O) or a μ3-oxo bridge (from O2 reduction) at the center of the cluster.
Figure 17.

Ground state splitting of spin-frustrated Cu(II) trimer due to antisymmetric exchange.42
Scheme 2.

Structures of the Tris-OH (A) and μ3-oxo (B) trinuclear Cu (II) model complexes.43
Figure 18.

Single crystal X-band EPR spectrum of Tris-OH bridged trinuclear Cu(II) complex as is it is rotated in the magnetic field (0° = magnetic field aligned along molecular z-axis).42
Figure 19.

Antisymmetric exchange mechanism based on orbital contours of the ground and ligand field excited state of the Tris-OH bridged trinuclear Cu(II) complex.43
Origin of MCD Pseudo-A Term: Excited State Spin-Orbit Coupling
Model complexes of both structures exist (scheme 2), and both exhibit pseudo-A terms in their μ2-hydroxo and μ3-oxo CT regions. The Tris-OH complex has the positive component of the MCD spectrum higher in energy (figure 20A) while the μ3-oxo model has its negative component higher in energy (figure 20B) as is also the case for NI (figure 20C, which is an expanded version of the high energy region of figure 15C). These pseudo-A terms require two perpendicular CT transitions that can SOC in a third, mutually perpendicular direction. This spin-orbit coupling is dominately a single center, one electron operator. For both complexes the CT transitions are in the trinuclear Cu (x,y) plane. As shown in figure 21A, for the Tris-OH structure the CT transitions involve two OH− to a single Cu(II) which SOC on the Cu center (x2-y2 ↔ xy). This predicts the positive component of the pseudo-A term higher in energy as observed experimentally (figure 20A). For the μ3-oxo structure in figure 21B, this involves oxo CT transitions to two different Cu centers which SOC on the oxygen (px ↔ py).44 The phases of this mechanism are consistent with the negative component of the pseudo-A term being higher in energy, as observed in the μ3-oxo model (figure 20B) and NI (figure 20C). From the temperature dependence of the MCD data on NI,41 the components of its pseudo-A term involve CT transitions to different Cu centers (see labels in figure 20C). Therefore, NI must have a μ3-oxo bridge, which is also consistent with sign of its pseudo- A term.
Figure 20.

MCD spectra of the Tris-OH bridged (A) and μ3-oxo bridged (B) trinuclear Cu(II) complexes, and NI (C).43 (Assignments of bands to specific Cu’s in C are based on their temperature dependence in ref. 41)
Figure 21.

Charge transfer MCD intensity mechanisms of Tris-OH bridged (A) and μ3-oxo bridged (B) trinuclear Cu(II) complexes. Two perpendicularly polarized transitions in the Cu3 plane (x,y) must spin-orbit couple with LzSz on a single atom (Cu for A and O for B).43
Geometric and Electronic Structure of NI
There remains the issue of whether the second oxygen atom of reduced O2 remains bound to the T3 center as a μ2-hydroxo bridge (figure 22A) (vide infra) or whether it protonates off leaving only the μ3-oxo bridge (figure 22B). Energetically it is more favorable (by 25 kcal/mol) to protonate the μ3-oxo due to its increased charge rather than the T3μ2OH. Also when the T3μ2OH is protonated, the magnetic orbital of one of the T3 Cu(II)’s rotates such that it delocalizes into the out-of-plane oxygen pz orbital (figure 23A) which is orthogonal to, and therefore ferromagnetically coupled to the magnetic orbitals on the other two Cu(II)’s, which is not consistent with the data on NI. Alternately, the μ3-oxo and the T3μ2OH doubly bridged structure produces magnetic orbitals on all three Cu(II)’s having in-plane oxo px,y overlap (figure 23B), producing three close to equivalent J values and thus the associated spin frustrated ground state with antisymmetric exchange.45
Figure 22.

Calculated geometric structures of NI (A) and NI with the T3μ2-OH protonated (B). In both structures, all Cu sites are in the Cu(II) oxidation state.
Figure 23.

Magnetic orbital of the T3A Cu site upon protonation of the μ2-hydroxo (A) and the magnetic orbitals of the three Cu(II) sites in the TNC in the μ3-oxo and μ2-hydroxo doubly bridged NI structure (B).46
Reductive Cleavage of the O-O Bond
At this point we have developed experimentally calibrated electronic and geometric structures of PI and NI. We can now explore the reductive cleavage of the O-O bond experimentally and theoretically.
Chemical Perturbations
Having eliminated the electron from the T1 Cu in the T1D and T1Hg derivatives we can trap PI and kinetically study the reductive cleavage of the O-O bond, i.e. the decay of PI. Figure 24A shows the loss of the peroxide to Cu(II) CT transitions in the conversion of PI to NI allowing the rate to be determined and studied as a function of different perturbations. First it should be noted that there is an 18O2 isotope effect of 1.11, clearly indicating that the O-O bond is cleaved in the decay of PI.35 From figure 24B black, the rate of PI decay is accelerated by a factor of 10 at low pH. This involves protonation of a nearby residue with a pKa of ~5.0 (this value is for Fet3p, it is measured to be 5.6 in laccase) requiring this to be a carboxylate. There are two candidates for this residue, E487 near the T3 Cu and D94 near the T2 Cu (figure 24C). Only in the E487A mutant is the pH effect eliminated (figure 24B green). This pH effect shows an inverse KIE of 0.89 in WT (figure 24B red) which goes to a normal KIE of 2.0 in the E487D mutant (figure 24B blue). Thus E487 near the T3 Cu provides the proton in accelerating O-O bond cleavage at low pH. From figure 24C this is likely associated with formation of the T3μ2OH bridge. Note that there is also a pH effect on the T2 Cu(II)-OH in the resting enzyme that is eliminated in the D94A/E mutants signifying that this residue can assist in removing a proton from H2O bound to the T2 Cu in the conversion of PI to NI.39,40
Figure 24.

Absorption spectra showing the decay of PI to NI. Inset shows the loss of the 340 nm transition as a function of time (A), rate of decay of PI as a function of pH and pD and as a function of pH in the E487D and E487A mutants (B), and schematic showing the movement of protons (in blue) upon cleavage of the O-O bond, i.e. conversion of PI+e− to NI (C).39
2D Potential Energy Surface
Reduction of PI with an electron (from the T1 Cu in the native enzyme) results in reduction of its T2 Cu and loss of its strong bond to peroxide (figure 25A). This is the starting structure for O-O bond cleavage which we considered to be a 2-dimensional potential energy surface problem with one axis being the O-O bond elongation (toward the front left in figure 25B) and the second being O-H bond formation (toward the front right in figure 25B, with the proton coming from E487). Thus, PI+e− → NI involves going from the rear to front corner in figure 25B. This reaction has a large thermodynamic driving force of 51 kcal/mol. There are two possible paths. Path 2 corresponds to the decay of PI at low pH and involves transfer of a proton before the transition state, leading to the inverse KIE. It has an activation energy of 4.5 kcal/mol, consistent with the reaction rate of the native enzyme. Path 1 involves O-O bond cleavage and then protonation after the transition state. This has an activation energy of only ~1 kcal/mol higher than the proton assisted pathway consistent with the limited acceleration of PI decay at low pH.38
Figure 25.

Structure of PI+e− (where an electron has transferred from the T1 to T2 Cu site before O-O bond cleavage) (A) and 2-D potential energy surface of the reductive cleavage of the O-O bond (B). In Path I the O-O bond is cleaved before proton transfer, while in Path II the proton is transferred before the transition state.38
Frontier Molecular Orbitals
The cleavage of the O-O bond at the TNC is a very facile process both with and without a proton. Insight into the effectiveness of the TNC in O-O bond cleavage is available from the frontier molecular orbitals (FMOs) involved. From figure 26A, as the O-O bond is cleaved, either with or without a proton, electrons, of opposite spin, are donated from the T2 and T3CuA into the σ* orbital of the peroxide. From figure 26B opposite spin densities on these Cu’s increase in parallel showing that (as with the two electron reduction of O2 in figure 8B) this is also a simultaneous two electron process. From the schematic in figure 27, the triangular topology of the TNC is key to the efficiency of this process. It allows good overlap between the redox active orbitals on the T2 and T3CuA with the peroxide σ*, while the T3CuB, which is oxidized still strongly interacts with the peroxide as a Lewis acid stabilizing its σ* orbital even in the absence of a proton. Together with the large driving force, these FMOs lead to the very low barrier for the two electron reductive cleavage of the peroxide O-O bond.38
Figure 26.

(A) Molecular orbitals involved in electron transfer during the PI+e+H → TS2 → NI process. In PI+e+H, only the T3B center is oxidized, and the α- and β-HOMOs are derived from the highest-energy d-electrons of T2 and T3A Cu centers. In TS2, both the T2 dx2-y2-based α-HOMO and T3A dx2-y2-based β-HOMO have good overlap and mixing with the peroxide LUMO (O22− σ*) that promotes facile simultaneous two-electron transfer from the donor T2 and T3A Cu’s to the acceptor peroxide for the O-O bond cleavage. Finally, in NI, the T2 and T3A Cu centers are fully oxidized and both O atoms fully reduced to μ3-oxo (O1) and μ-OH (O2) bridging ligands. The same type of MO correlation is present for the PI+e →TS1→ NI process. (B) A plot of the spin density on each of the three Cu’s of the TNC as a function of O-O distance. Solid lines indicate changes from PI+e+H to NI (i.e., with protonated peroxide), and dotted lines indicate changes from PI+e. PI+e with R(O1-O2) > 1.9 Å are not shown, as the proton transfer occurs spontaneously with no barrier at these O1-O2 distances.38
Figure 27.

Schematic of triangular topology of the TNC and depiction of the orbitals relevant in O-O cleavage. Note that T2 and T3A transfer two electrons into the peroxide σ* orbital and T3B is oxidized and acts as a Lewis Acid, similar to a proton, in stabilizing the σ* orbital.38
NI Conversion to Resting: Interconvesion of the two Fully Oxidized Forms of the Trinuclear Cluster
The NI and resting sites have very different spectral features due to the fully bridged structure of NI. From isotope studies, one oxygen from O2 reduction ends up bound to the T2 Cu(II) of the resting enzyme.34,45,46 Thus, there must be a rearrangement of the μ3-oxo bridge from inside to outside the cluster (figure 28A). This involves protons, the first to the μ3O and a second to the T3μ2OH, which breaks this bridge and allows the exchange of one oxygen from O2 into solvent. The internal μ3-hydroxo no longer binds to T3CuB and can rotate from inside to outside the cluster through the T3CuA-T2 Cu edge. From figure 28B this rotation removes one proton from the H2O at T3CuB to reform the T3μ2OH bridge and as the T2-T3CuA bridging H2O rotates out of the cluster it donates one proton to the terminal OH at the T2 Cu, weakening this bond and allowing its substitution by the rotated OH from O2 reduction.47 This process is calculated to have a barrier of ~ 8.5 kcal/mol which is reasonable given that the experimental barrier for the conversion of NI to resting is 8.8–13.9 kcal/mol.48 Importantly, this rate of conversion (k = 0.05 s−1)27 is orders of magnitude slower than the turnover rate of the enzyme (k= 350 s−1).49 Therefore, NI is actually the catalytically relevant fully oxidized form of the MCOs.
Figure 28.

Schematic showing the conversion of NI to resting marking the position of the oxygen atoms from dioxygen in red (A) and geometric structures and energies for the doubly protonated form of NI rotating the μ3-OH from inside to outside the TNC through the T3 CuA-T2 Cu edge (B). 46
Molecular Mechanism of O2 Reduction to H2O
The above detailed chemical, spectroscopic, and electronic structure studies have led to the mechanism of the MCO’s shown in figure 29 The reaction of the fully reduced enzyme with O2 occurs in two 2 electron steps, with the second being fast, so it is effectively a four electron process. The first step is rate determining and driven by the presence of an anionic Asp residue near the T2 Cu. The low barrier of the fast second step reflects the large driving force for two electron reduction of peroxide combined with the triangular topology of the TNC. Importantly, NI is a fully oxidized all bridged structure and is the catalytically relevant fully oxidized form of the enzyme. Our thoughts are that the μ3-oxo bridge provides superexchange pathways for rapid ET (proton coupled) to all three Cu’s of the TNC, and we are currently experimentally trapping intermediates in the rapid reduction of NI.
Figure 29.

Mechanism of O2 reduction to water by the MCOs. Red arrows indicate the steps that take place in catalytic cycle of the MCOs. Black arrows indicate steps that can be experimentally observed but are not part of the catalytic cycle. The dashed arrows at the right indicate the transfer of an electron from the T1 Cu to the T2 Cu to create PI+e−, that occurs in going from PI to NI but is not experimentally observed in the wild type enzyme.
Acknowledgments
We thank collaborators and past students for their contributions to this field. This research was funded by the National Institute of Health (DK31450). A.J.A is supported by a John Stauffer Stanford Graduate Fellowship and J.Y. by a Franklin Veatch Memorial Fellowship.
Biographies

Edward I. Solomon received his Ph.D. from Princeton University and was a Postdoctoral Fellow at the Ørsted Institute of the University of Copenhagen and at Caltech. He was a Professor at MIT and is now the Monroe E. Spaght Professor of Humanities and Science at Stanford University. His research is in the fields of physical-inorganic and bioinorganic chemistry with emphasis on the application of spectroscopic and computational methods to elucidate the electronic structures of transition metal complexes and their contributions to physical properties and reactivity.

T.J. Augustine was born in 1981 in Chicago, IL. He received a B.S. in Chemistry in 2003 from the University of Illinois where he did research with Prof. Yi Lu. Since then he has been working towards his Ph.D. as a Stanford Graduate Fellow in Chemistry at Stanford University with Prof. Edward Solomon. He is researching the roles of residues in the first and second coordination spheres of the trinuclear Cu cluster in the multicopper oxidases in reactivity.

Jungjoo Yoon was born in Seoul, Korea, in 1975. He received his Ph.D. degree in Bio-inorganic Chemistry in 2007 from Stanford University in the Solomon group, where he used spectroscopy and electronic structure calculations to characterize the oxygen intermediates of the multicopper oxidases. He is currently pursuing his post-doctoral research in molecular biology at University of California at Berkeley under the supervision of Professor Michael Marletta.
References
- 1.Solomon EI, Sundaram UM, Machonkin TE. Chem Rev. 1996;96:2563–2605. doi: 10.1021/cr950046o. [DOI] [PubMed] [Google Scholar]
- 2.Messerschmidt A, Ladenstein R, Huber R, Bolognesi M, Avigliano L, Petruzzelli R, Rossi A, Finazzi-Agro A. J Mol Biol. 1992;224:179–205. doi: 10.1016/0022-2836(92)90583-6. [DOI] [PubMed] [Google Scholar]
- 3.Nitta K, Kataoka K, Sakurai T. J Inorg Biochem. 2002;91:125–131. doi: 10.1016/s0162-0134(02)00440-3. [DOI] [PubMed] [Google Scholar]
- 4.Messerschmidt A, Rossi A, Ladenstein R, Huber R, Bolognesi M, Guiseppina G, Marchesini A, Petruzzelli R, Finazzi-Agro A. J Mol Biol. 1989;206:513–529. doi: 10.1016/0022-2836(89)90498-1. [DOI] [PubMed] [Google Scholar]
- 5.Taylor AB, Stoj CS, Ziegler L, Kosman DJ, Hart PJ. Proc Natl Acad Sci USA. 2005;102:15459–15464. doi: 10.1073/pnas.0506227102. [DOI] [PMC free article] [PubMed] [Google Scholar]
- 6.Zaitseva I, Zaitsev V, Card G, Moshkov K, Bax B, Ralph A, Lindley P. J Biol Inorg Chem. 1996;1:15–23. [Google Scholar]
- 7.Solomon EI, Chen P, Metz M, Lee SK, Palmer AE. Angew Chem, Int Ed. 2001;40:4570–4590. doi: 10.1002/1521-3773(20011217)40:24<4570::aid-anie4570>3.0.co;2-4. [DOI] [PubMed] [Google Scholar]
- 8.de Silva D, Askwith CC, Eide D, Kaplan J. J Biol Chem. 1995;270:1098–1101. doi: 10.1074/jbc.270.3.1098. [DOI] [PubMed] [Google Scholar]
- 9.Solomon EI, Pavel EG, Loeb KE, Campochiaro C. Coord Chem Rev. 1995;144:369–460. [Google Scholar]
- 10.Pavel EG, Kitajima N, Solomon EI. J Am Chem Soc. 1998;120:3949–3962. [Google Scholar]
- 11.Solomon EI, Brunold TC, Davis MI, Kemsley JN, Lee SK, Lehnert N, Neese F, Skulan AJ, Yang YS, Zhou J. Chem Rev. 2000;100:235–349. doi: 10.1021/cr9900275. [DOI] [PubMed] [Google Scholar]
- 12.Quintanar L, Gebhard M, Wang TP, Kosman DJ, Solomon EI. J Am Chem Soc. 2004;126:6579–6589. doi: 10.1021/ja049220t. [DOI] [PubMed] [Google Scholar]
- 13.Stoj C, Augustine AJ, Zeigler L, Solomon EI, Kosman DJ. Biochemistry. 2006;45:12741–12749. doi: 10.1021/bi061543+. [DOI] [PubMed] [Google Scholar]
- 14.Solomon EI. Inorg Chem. 2006;45:8012–8025. doi: 10.1021/ic060450d. [DOI] [PubMed] [Google Scholar]
- 15.Lowery MD, Guckert JA, Gebhard MS, Solomon EI. J Am Chem Soc. 1993;115:3012. [Google Scholar]
- 16.Augustine AJ, Kragh ME, Sarangi R, Fujii S, Liboiron BD, Stoj CS, Kosman DJ, Hodgson KO, Hedman B, Solomon EI. Biochemistry. doi: 10.1021/bi7020052. In Press. [DOI] [PubMed] [Google Scholar]
- 17.Allendorf MD, Spira DJ, Solomon EI. Proc Natl Acad Sci USA. 1985;82:3063–3067. doi: 10.1073/pnas.82.10.3063. [DOI] [PMC free article] [PubMed] [Google Scholar]
- 18.Spira-Solomon DJ, Allendorf MD, Solomon EI. J Am Chem Soc. 1986;108:5318–5328. [Google Scholar]
- 19.Quintanar L, Yoon J, Aznar C, Palmer AE, Andersson K, Britt D, Solomon EI. J Am Chem Soc. 2005;127:13832–13845. doi: 10.1021/ja0421405. [DOI] [PubMed] [Google Scholar]
- 20.Kau LS, Spira-Solomon DJ, Penner-Hahn JE, Hodgson KO, Solomon EI. J Am Chem Soc. 1987;109:6433. [Google Scholar]
- 21.LuBien CD, Winkler ME, Thamann TJ, Scott RA, Co MS, Hodgson KO, Solomon EI. J Am Chem Soc. 1981;103:7014. [Google Scholar]
- 22.Graziani MT, Morpurgo L, Rotilio G, Mondovi B. FEBS Lett. 1976;70:87. doi: 10.1016/0014-5793(76)80732-6. [DOI] [PubMed] [Google Scholar]
- 23.Magnus KA, Hazes B, Ton-That H, Bonaventura C, Bonaventura J, Hol WGJ. Proteins: Struct Funct Genet. 1994;19:302. doi: 10.1002/prot.340190405. [DOI] [PubMed] [Google Scholar]
- 24.Metz M, Solomon EI. J Am Chem Soc. 2001;123:4938–4950. doi: 10.1021/ja004166b. [DOI] [PubMed] [Google Scholar]
- 25.Yoon J, Solomon EI. Manuscript in Preparation. [Google Scholar]
- 26.Brouwer M, Bonaventura C, Bonaventura J. Biochemistry. 1978;17:2148–2154. doi: 10.1021/bi00604a019. [DOI] [PubMed] [Google Scholar]
- 27.Andreasson LE, Reinhammar B. Biochim Biophys Acta. 1976;445:579–597. doi: 10.1016/0005-2744(76)90112-1. [DOI] [PubMed] [Google Scholar]
- 28.Andreasson LE, Branden R, Reinhammar B. Biochim Biophys Acta. 1976;438:370–379. doi: 10.1016/0005-2744(76)90254-0. [DOI] [PubMed] [Google Scholar]
- 29.Blackburn NJ, Ralle M, Hassett R, Kosman DJ. Biochemistry. 2000;39:2316–2324. doi: 10.1021/bi992334a. [DOI] [PubMed] [Google Scholar]
- 30.Palmer AE, Quintanar L, Severance S, Wang TP, Kosman DJ, Solomon EI. Biochemistry. 2002;41:6438–6448. doi: 10.1021/bi011979j. [DOI] [PubMed] [Google Scholar]
- 31.Morie-Bebel MM, Morris MC, Menzie JL, McMillin DR. J Am Chem Soc. 1984;106:3677. [Google Scholar]
- 32.Cole JL, Clark PA, Solomon EI. J Am Chem Soc. 1990;112:9534–9548. [Google Scholar]
- 33.Cole JL, Tan GO, Yang EK, Hodgson KO, Solomon EI. J Am Chem Soc. 1990;112:2243. [Google Scholar]
- 34.Shin W, Sundaram UM, Cole JL, Zhang HH, Hedman B, Hodgson KO, Solomon EI. J Am Chem Soc. 1996;118:3202–3215. [Google Scholar]
- 35.Palmer AE, Lee SK, Solomon EI. J Am Chem Soc. 2001;123:6591–6599. doi: 10.1021/ja010365z. [DOI] [PubMed] [Google Scholar]
- 36.Sundaram UM, Zhang HH, Hedman B, Hodgson KO, Solomon EI. J Am Chem Soc. 1997;119:12525–12540. [Google Scholar]
- 37.Rulišek L, Solomon EI, Ryde U. Inorg Chem. 2005;44:5612–5628. doi: 10.1021/ic050092z. [DOI] [PubMed] [Google Scholar]
- 38.Yoon J, Solomon EI. J Am Chem Soc. 2007;129:13127–13136. doi: 10.1021/ja073947a. [DOI] [PMC free article] [PubMed] [Google Scholar]
- 39.Augustine AJ, Quintanar L, Stoj CS, Kosman DJ, Solomon EI. J Am Chem Soc. 2007;129:13118–13126. doi: 10.1021/ja073905m. [DOI] [PMC free article] [PubMed] [Google Scholar]
- 40.Quintanar L, Stoj C, Wang TP, Kosman DJ, Solomon EI. Biochemistry. 2005;44:6081–6091. doi: 10.1021/bi047379c. [DOI] [PubMed] [Google Scholar]
- 41.Lee SK, George SD, Antholine WE, Hedman B, Hodgson KO, Solomon EI. J Am Chem Soc. 2002;124:6180–6193. doi: 10.1021/ja0114052. [DOI] [PubMed] [Google Scholar]
- 42.Mirica LM, Stack TDP. Inorg Chem. 2005;44:2131–2133. doi: 10.1021/ic048182b. [DOI] [PubMed] [Google Scholar]
- 43.Yoon J, Mirica LM, Stack TDP, Solomon EI. J Am Chem Soc. 2004;126:12586–12595. doi: 10.1021/ja046380w. [DOI] [PubMed] [Google Scholar]
- 44.Yoon J, Mirica LM, Stack TDP, Solomon EI. J Am Chem Soc. 2005;127:13680–13693. doi: 10.1021/ja0525152. [DOI] [PubMed] [Google Scholar]
- 45.Branden R, Deinum J. FEBS Lett. 1977;73:144–146. doi: 10.1016/0014-5793(77)80967-8. [DOI] [PubMed] [Google Scholar]
- 46.Branden R, Deinum J, Coleman M. FEBS Lett. 1978;89:180–182. doi: 10.1016/0014-5793(78)80550-x. [DOI] [PubMed] [Google Scholar]
- 47.Yoon J, Liboiron BD, Sarangi R, Hodgson KO, Hedman B, Solomon EI. Proc Natl Acad Sci USA. 2007;104:13609–13614. doi: 10.1073/pnas.0705137104. [DOI] [PMC free article] [PubMed] [Google Scholar]
- 48.Huang HW, Zoppellaro G, Sakurai T. J Biol Chem. 1999;274:32718–32724. doi: 10.1074/jbc.274.46.32718. [DOI] [PubMed] [Google Scholar]
- 49.Petersen LC, Degn H. Biochim Biophys Acta. 1978;526:85–92. doi: 10.1016/0005-2744(78)90292-9. [DOI] [PubMed] [Google Scholar]