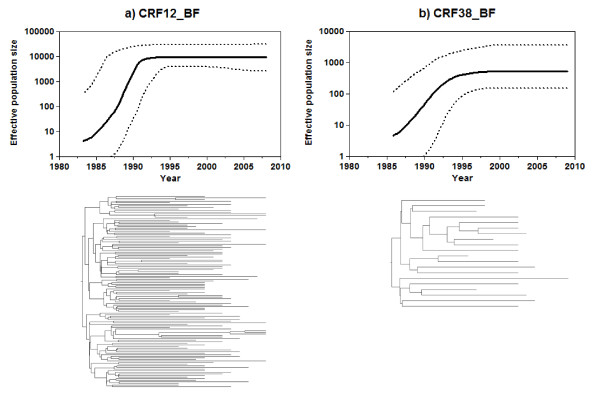
Figure 2.
Time-scaled Bayesian phylogenies and corresponding Bayesian skyline plots (BSP) for the HIV-1 CRF12_BF (a) and CRF38_BF (b) epidemics. Time-scaled phylogenies and BSP were generated under a relaxed molecular clock model using BEAST. Branch lengths of the trees represent time (see the time scale at the X-axis of each graph). BSP represent estimates of effective number of infections (Y-axis; log10 scale) through time (X-axis; calendar years). Median (solid line) and upper and lower 95% HPD (dashed lines) estimates of the effective number of infections are shown in each graph.

