

Abstract
Transgenic models with pseudo phosphorylation mutants of troponin I, PKA sites at Ser 22 and 23 (cTnIDD22,23 mice) or PKC sites at Ser 42 and 44 (cTnIAD22,23DD42,44) displayed differential force-frequency relationships and afterload relaxation delay in vivo. We hypothesized that cTnI PKA and PKC phospho-mimics impact cardiac muscle rate-related developed twitch force and relaxation kinetics in opposite directions. cTnIDD22,23 transgenic mice produces a force frequency relationship (FFR) equivalent to control NTG albeit at lower peak [Ca2+]i, while cTnIAD22,23DD42,44 TG mice had a flat FFR with normal peak systolic [Ca2+]i, thus suggestive of diminished responsiveness to [Ca2+]i at higher frequencies. Force-[Ca2+]i hysteresis analysis revealed that cTnIDD22,23 mice have a combined enhanced myofilament calcium peak response with an enhanced slope of force development and decline per unit of [Ca2+]i, whereas cTnIAD22,23DD42,44 transgenic mice showed the opposite. The computational ECME model predicts that the TG lines may be distinct from each other due to different rate constants for association/dissociation of Ca2+ at the regulatory site of cTnC. Our data indicate that cTnI phosphorylation at PKA sites plays a critical role in the FFR by increasing relative myofilament responsiveness, and results in a distinctive transition between activation and relaxation, as displayed by Force-[Ca2+]i hysteresis loops. These findings may have important implications for understanding the specific contribution of cTnI to β-adrenergic inotropy and lusitropy and to adverse contractile effects of PKC activation, which is relevant during heart failure development.
Keywords: Force-Frequency relation, cTnI phosphorylation, Protein Kinase A, Protein Kinase C, E-C coupling, isolated trabeculae, Myofilament Ca2+ sensitivity, Computational modeling
INTRODUCTION
In the normal heart, contractile force increases with increasing heart rate. This positive force-frequency relationship (FFR) is due, at least in part, to an increase in systolic Ca2+ transient amplitude [1–5]. The FFR is however blunted or even negative in failing hearts [6–8]. This maladaptation has been associated with decreased [8] or normal calcium transients amplitude, with the latter possibility suggestive of decreased myofilament Ca2+ responsiveness [6]. However, it is not yet clear whether a positive FFR relies on myofilament Ca2+ sensitization [3] or desensitization [9, 10].
Cardiac troponin I (cTnI), a thin filament protein, is the inhibitory element of the troponin complex that regulates calcium sensitivity and myocardial contraction. β-adrenergic/PKA mediated cTnI phosphorylation desensitizes myofilaments to Ca2+ and plays a pivotal role in enhanced systolic and diastolic performance [11, 12]. Analogous to β-adrenergic stimulation, enhanced inotropy and lusitropy seen during a positive FFR occurs through frequency-induced adaptations in key proteins influencing the calcium handling process [5], especially sarco(endo)plasmic reticulum Ca2+-ATPase (SERCA2a) and phospholamban (PLB) [13–17].
How adaptations of the myofilaments contribute to a positive FFR is less clear. The extent of cTnI phosphorylation appears to modulate FFR in vivo [9, 10, 18–20]. Our previous studies in transgenic (TG) mice demonstrated that mimicking cTnI PKA constitutive phosphorylation at Ser22,23 sites is sufficient to enhance in vivo heart rate-dependent inotropy and to lessen relaxation delay during increased afterload [18]. However, we have also established that mimicking hypophosphorylation at TnI PKA site (Ser22) combined with simulating hyperphosphorylation at PKC sites (Ser42,44) is sufficient to blunt in vivo heart-rate dependent inotropy, and exacerbate relaxation delay in presence of increased afterload [20]. This indicates that the regulation of phosphorylation at these cTnI sites is relevant to normal FFR and ventricular function. However, the mechanisms behind these changes have not been fully elucidated. Indeed, previous attempts to clarify these mechanisms in isolated muscle studies in nontransgenic (NTG) and cTnIDD22,23 mice could not establish differences in twitch contraction and relaxation kinetics, at baseline or after β-adrenergic stimulation [18]. However, these studies were limited because Ca2+ transients were not directly measured. The present work was designed to clarify the physiological consequences of pseudophosphorylation of cTnI PKA sites Ser22,23 and PKC Ser42,44 on excitation-contraction coupling during FFR. To this end, we simultaneously examined twitch force and Ca2+ transients during FFR in intact trabeculae from normal (NTG), enhanced (cTnIDD22,23) and blunted (cTnIAD22,23DD42,44) in vivo force-frequency responder mice. We complemented our studies by employing the ECME computational model in order to probe for potential mechanisms responsible for TG models divergent contractile behavior. Our studies show that cTnIDD22,23 and cTnIAD22,23DD42,44 differ from NTG mice mainly in their divergent ability to generate normal force per unit of [Ca2+]i, at both baseline and when challenged with increased stimulation frequency. The ECME model suggests that this might be due, at least in part, to altered rate constants for association/dissociation of the low affinity (regulatory) Ca2+ binding site of cTnC.
METHODS
Generation of transgenic models
The strategy for generation of TG mice model as well as the molecular confirmation of mutant cTnI replacement has been previously reported [18, 20] and explained more in detail in online supplemental data. For experimental studies, the two TG mice models were compared with NTG littermates or age-matched C57BL/6 mice. All animal protocols were performed in accordance with institutional guidelines and approval of the IACUC.
Trabeculae isolation, force, sarcomeric length and [Ca2+]i measurements
Male or female mice (6–9 months old) were anesthetized with pentobarbital (50mg/Kg−1) and heparinized (100 U) intraperitoneally. Trabeculae from the right ventricle of the heart were dissected and mounted between a force transducer (Scientific Instruments, Heidelberg) and a motor arm as previously described [21]. Force was expressed in millinewtons per square millimeter (mN/mm2) of cross-sectional area. Sarcomere length was adjusted as previously described [21], which correspond to resting sarcomeric lengths of 2.1–2.2 μm. [Ca2+]i was measured using the free acid form of fura-2 and absolute values calculated from in vivo calibrations described in our previous studies [3, 22, 23]. Measurements were collected and digitalized through a data acquisition board (National Instruments). Custom written software (developed in LabVIEW) was used to analyze data on and off-line. Analyzed data were used to generate graphs in Origin 6.0, for clarity of illustrations, representative tracings of force twitch, Ca2+ transients and Force-[Ca2+]i hysteresis loops were smoothed using adjacent averaging function (10 to 20 points).
Force-frequency relation in trabeculae
Muscles were kept at room temperature (21–22 °C), external [Ca2+]o of 1.5mM and allowed to stabilized at 0.5Hz, then subjected to a stepwise increases on stimulation frequency (1 to 4 Hz) where developed force and [Ca2+]i were recorded. Off-line Force-[Ca2+]I hysteresis loops were used to identify [Ca2+]i at 50% of twitch activation (ActECa50) and [Ca2+]i at 50% of relaxation (RelECa50), to calculate slope steepness of activation and relaxation, individual segments between points B to C and C to A were dissected and fitted for linearity.
Isolated skinned fiber studies
Freshly isolated cardiac trabeculae were dissected and mounted as previously described[20]. Skinned steady-state force-[Ca2+] relationships were determined experimentally and fit to the Hill equation to yield Fmax, or maximal Ca2+-activated force, ECa50, the [Ca2+] required for 50 % of maximal activation, and the Hill coefficient, as previously described [23].
Computational Methods
The integrated model (ECME) has been built in a modular way by assembling the expressions representing each of the processes taken into account. The code of the integrated ECME model, written in C++, contains 50 ordinary differential equations (ODEs) in Microsoft Visual Studio environment (Microsoft Corporation, Redmond, WA). Equations were integrated numerically using CVODE, a stiff ODEs solver in C, developed by Cohen and Hindmarsh, that uses variable-coefficient Adams and BDF methods. For more details about the source code of the ECME model, steady state simulations, relevant equations related to force development (Apendix I) and adjusted parameters used in the simulations (Table 5) see online supplemental data. A more detailed description of the model was presented elsewhere [24].
Statistics
Student’s t-test, one-way ANOVA and two-way ANOVA with repeated measures, followed by post-hoc pair wise comparison, when appropriate, was used for statistical analysis of the data. GraphPad 5.0 and Origin 6.0 were used for graphs and statistical analysis. A value of p < 0.05 was considered to indicate significant differences between groups. Unless otherwise indicated pooled data were expressed as mean ± standard error of the mean (S.E.M.).
Additional methods are available in online supplemental data
RESULTS
Force-frequency relationship is flat in cTnIAD22,23DD42,44 mice
We assessed first the effects of increasing stimulation frequency on twitch force and calcium transients in NTG, cTnIDD22,23, and cTnIAD22,23DD42,44 mice. In most mammalian species, FFR is positive as well as accompanied by a frequency-dependent increase in calcium transients while diastolic [Ca2+]i remain constant [5]. As expected, increasing stimulation frequency had profound effects on both twitch force and calcium transients. Figure 1 shows examples of tracings of Ca2+ transients (top panels) and force twitch (bottom panels) at two different stimulation rates (2 and 4 Hz) of NTG (Fig 1A,B), cTnIDD22,23 (Fig 1C,D) and cTnIAD22,23DD42,44 (Fig 1E,F) in intact trabeculae. Averaged twitch developed force are shown in Figure 2A. Both NTG and cTnIDD22,23 trabeculae displayed a positive FFR, where developed force increased over a frequency ranging from 1 to 4 Hz. Changes in NTG developed force at 4Hz when compared to 1 Hz were significant (19.7±4.5 vs 6.1±1.9 mN/mm2, n=9, *p< 0.05 by one-way ANOVA). Likewise, changes in cTnIDD22,23 developed force at 4Hz when compared to 1 Hz increased significantly (14.5±2.2 vs 5.1±1.4 mN/mm2, n=7 p< 0.05 by one-way ANOVA). Notably, cTnIAD22,23DD42,44 displayed a flat FFR, no change for 4Hz when compared to 1 Hz (6.3±2.2 vs 4.2±2.9 mN/mm2, n=7, p = ns by one-way ANOVA). Thus, a positive FFR was only observed in NTG and cTnIDD22,23 trabeculae while cTnIAD22,23DD42,44 displayed a flat or blunted FFR, a finding that is compatible with the phenotype of these mice in vivo. Overall FFR between genotypes was compared using two-way ANOVA. This analysis demonstrated there was no significant difference between NTG compared to cTnIDD22,23, however, the cTnIAD22,23DD42,44, showed significantly depressed FFR (p< 0.001). Online supplemental Table 1 shows a summary of absolute developed force values and post-hoc comparisons. Online supplemental Table 3 shows a summary of two-way repeated measure ANOVA results showing interactions and overall effects between frequency and genotype. Overall, this data support a critical role of cTnI phosphorylation at PKC target sites Ser42/44 to a normal FFR.
Figure 1. Examples of tracings of Twitch Force and Ca2+ Transients from isolated trabeculae stimulated at 2 and 4 Hz.
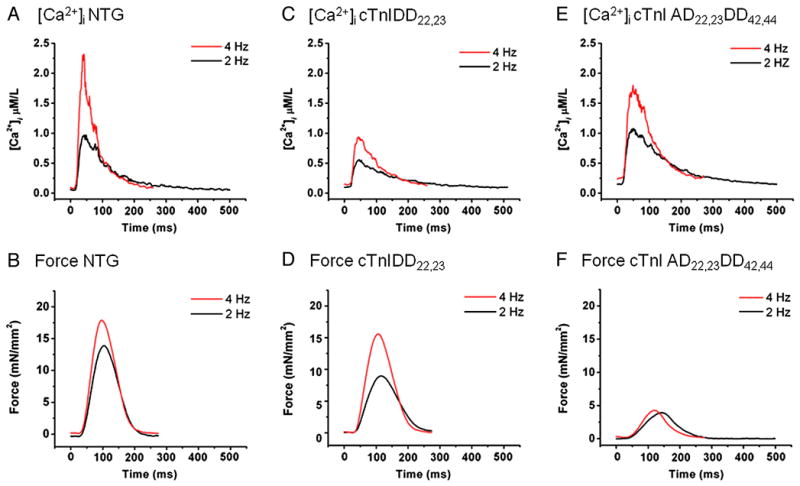
On the top panel, examples of Ca2+ transients at 2 Hz (black) and 4Hz (red) are shown for NTG (A), cTnIDD22,23 (C) and cTnIAD22,23DD42,44 (D), notice the smaller amplitude of cTnIDD22,23 Ca2+ transients, which show similar kinetics of relaxation. On the bottom panel, examples of twitch force tracings at 2 Hz (black) and 4Hz (red) are shown for NTG (B), cTnIDD22,23 (D) and cTnIAD22,23DD42,44 (F). Observe that cTnIAD22,23DD42,44 failed to increase force at increased frequency.
Figure 2. Developed Force and Ca2+ Transients during Force-Frequency Response.
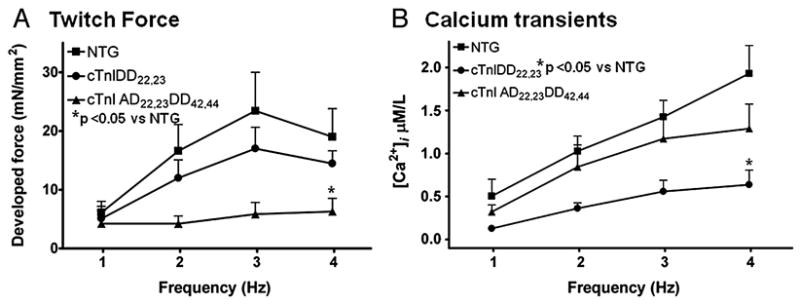
A, Shows averaged maximum twitch developed force at various stimulation frequencies (1, 2, 3 and 4 Hz) from NTG (n=8), cTnIDD22,23 (n=7) and cTnIAD22,23DD42,44 (n=7) mice. Force-Frequency Response was positive in NTG and cTnIDD22,23, whereas in cTnIAD22,23DD42,44 group there was not a significant increase of force with frequency. cTnIAD22,23DD42,44 showed statistical difference when compared to NTG (*p < 0.05 two-way RM ANOVA). B, Shows averaged Ca2+ transients corresponding to twitch force at same range of stimulation frequencies (1–4Hz). NTG (n=5), cTnIDD22,23 (n=4) and cTnIAD22,23DD42,44 (n=6) mice. Contrary to Force, Ca2+ transients from all three mice groups increased with frequency, although cTnIDD22,23 mice showed an overall significant difference when compared to NTG (*p < 0.05 two-way RM ANOVA). All data are expressed as means± s.e.m.
[Ca2+]i amplitude is diminished in cTnIDD22,23 mice at higher frequency
Averaged calcium transients for all four frequencies on all three mice groups (NTG, cTnIDD22,23 and cTnIAD22,23DD42,44) are shown in Figure 2B. The [Ca2+]i–frequency response was positive in NTG and both TG mouse models, with [Ca2+]i increasing significantly over a frequency ranging from 1 to 4 Hz. Changes in NTG calcium transients amplitude for 4 Hz when compared to 1Hz were significant (1.93±0.33 vs 0.5±0.2 μM/L, n=5, p< 0.001 by ANOVA). Changes in cTnIDD22,23 calcium transients amplitude were also significant (0.64±0.17 vs 0.13±0.02 μM/L, n=4, p< 0.05 by ANOVA). Changes in cTnIAD22,23DD42,44 calcium transients amplitude for 4 Hz when compared to 1Hz, were significant (1.29±0.29 vs 0.32±0.08 μM/L, n=6, *p< 0.01 by ANOVA). Surprisingly, cTnIDD22,23 displayed low peak amplitude of Ca2+ transients with preserved twitch force, cTnIDD22,23 calcium transients were significantly lower than NTG at 2, 3 and 4Hz (*p< 0.05 by two-way ANOVA RM, See Figure 2B) but not at 1 Hz (online Table 2) or 0.5Hz (0.09±0.02 μM/L for cTnIDD22,23 vs 0.34±0.16 μM/L for NTG, n=4 vs n=5, p= 0.1). When the three genotypes were compared across frequencies, cTnIDD22,23 genotype was demonstrated to have an overall effect on [Ca2+]i amplitude. Online supplemental Table 2 shows a summary of absolute Ca2+ transient’s amplitude values and post-hoc comparisons. Online supplemental Table 4 shows a summary of results showing interactions and overall effects between frequency and genotype by two-way repeated measure ANOVA. This findings support the role of cTnI PKA sites Ser22/23 phosphorylation in producing a greater relative peak twitch force for peak Ca2+ transient.
cTnIAD22,23DD42,44 mice have slower twitch and Ca2+ transient kinetics
Next, we examined if the differences found in FFR in twitch force and calcium transient were accompanied by changes in relaxation kinetics properties. Figure 3 provides summary data for twitch and [Ca2+]i kinetics. While there were no significant differences between NTG and cTnIDD22,23 in twitch force time to peak (TTP), cTnIAD22,23DD42,44 was slower, this impairment in time to peak was also visible in TTP of [Ca2+]i (*p< 0.05 by two-way ANOVA RM, Figure 3A,B, respectively). Only twitch force TTP shows a positive frequency-dependent acceleration (*p< 0.05 by ANOVA). On the other hand, accelerated relaxation parameters for twitch and [Ca2+]i were responsive to frequency in NTG and TG models. However, when the three groups were compared across frequencies, twitch RT75% and [Ca2+]i RT50% was significantly impaired in cTnIAD22,23DD42,44 mice when compared to NTG, see Figure 3D and Figure 4A (*p< 0.05 by two-way RM ANOVA). Notably, cTnIAD22,23DD42,44 mice closely mimicked features seen in heart failure models [25], thus supporting a role for altered phosphorylation pattern of the myofilaments in producing downstream effects on [Ca2+]I kinetics.
Figure 3. Relaxation time to 50% in Twitch Force and Ca2+ Transients Kinetics during Force-Frequency Response.
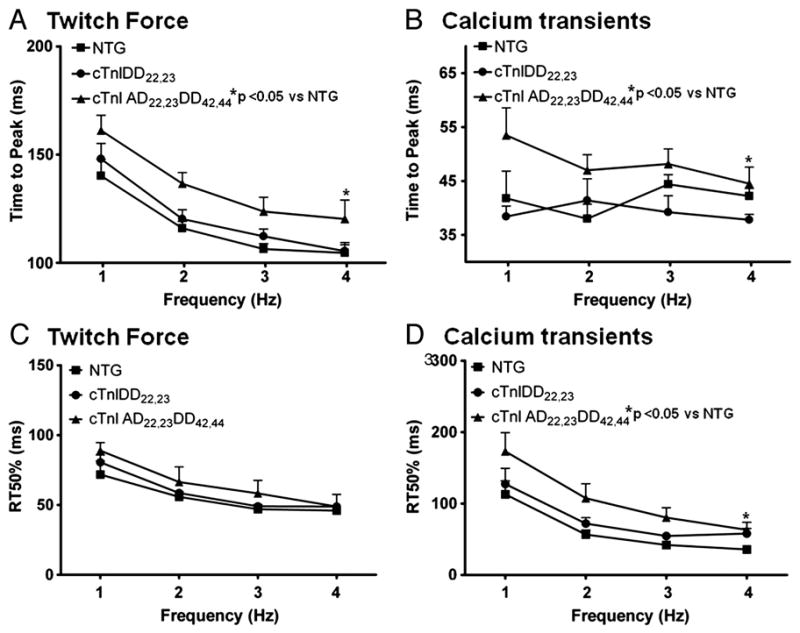
A, Twitch force kinetics showing time to peak (TTP) for NTG (n=5), cTnIDD22,23 (n=7) and cTnIAD22,23DD42,44 (n=7) mice, which accelerates as frequency increases from 1 to 4Hz. cTnIAD22,23DD42,44 was significantly slower than NTG (*p<0.05 two-way RM ANOVA). B, Corresponding TTP from Ca2+ transients NTG (n=5), cTnIDD22,23 (n=4) and cTnIAD22,23DD42,44 (n=6) mice, which does not accelerate in response to frequency increase, cTnIAD22,23DD42,44 was significantly slower than NTG (*p<0.05 two-way RM ANOVA). C, Twitch force kinetics showing relaxation time from peak to 50% (RT50) for corresponding mice groups. A positive frequency-dependent acceleration of relaxation (FDAR) is evident in all mice groups from 1 to 4 Hz (one-way ANOVA *p<0.05), however there were no differences between genotypes. D, Shows corresponding Relaxation time from peak to 50% (RT50) from Ca2+ transients at same range of stimulation frequencies. Ca2+ transients RT50% also showed a positive frequency-dependent acceleration of relaxation in all of the mice groups (one-way ANOVA *p<0.05). Genotype cTnIAD22,23DD42,44 showed an overall effect with slowed calcium transient kinetics of decay at RT50% (*p<0.05 two-way RM ANOVA).
Figure 4. Relaxation time to 75% and 90% on Twitch Force and Ca2+ Transients during FFR in NTG and TG models.
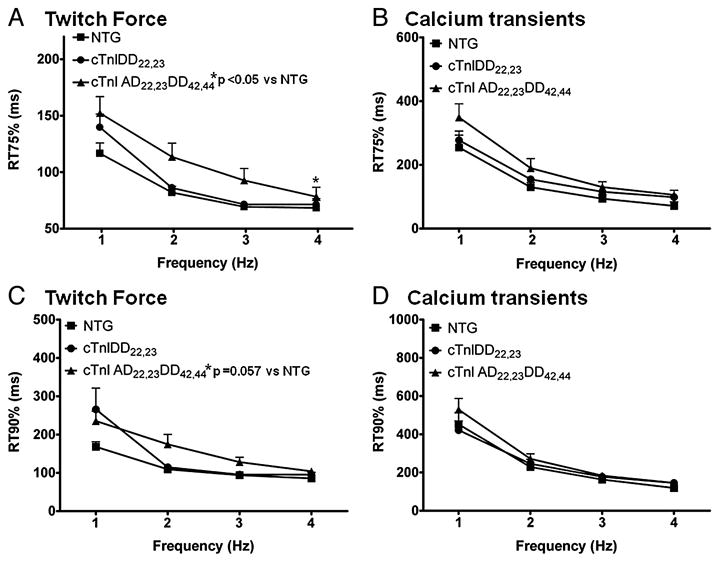
A, C Twitch force kinetics showing relaxation time from peak to 75% (RT75) and time from peak to 90% (RT90), respectively, for NTG (n=5), cTnIDD22,23 (n=7) and cTnIAD22,23DD42,44 (n=7) mice. As for other relaxation parameters, a positive FDAR is evident in all mice groups from 1 to 4 Hz. Genotype cTnIAD22,23DD42,44 showed an overall effect on slowing twitch kinetics at RT75% (*p<0.05), and a strong trend at RT90% (p=0.057) by two-way RM ANOVA. B, D Corresponding Ca2+ transients Relaxation time from peak 75% (RT75) and time from peak to 90% (RT90), respectively, NTG (n=5), cTnIDD22,23 (n=4) and cTnIAD22,23DD42,44 (n=6) mice. A positive FDAR was also evident in all groups from 1 to 4 Hz (one-way ANOVA *p<0.05). No difference was evident between groups.
Phase plane analyses of Force-[Ca2+]i loops in TG models
In order to further characterize twitch or [Ca2+]i kinetic differences between NTG and cTnIDD22,23 we performed Force-[Ca2+]i hysteresis analysis. With this approach Force and [Ca2+]i were plotted point-to-point over the whole twitch cycle. With an increase in stimulation frequency there are concomitant changes in force, [Ca2+]i and myofilament properties, which result in changes in loop shape. These changes make the transitional activation part of the Force-[Ca2+]i hysteresis loop (depicted as segment A to B to C) to shift predominantly rightwards (B more [Ca2+]i) and upwards (C more Force). On the other hand, the relaxation part of the force-[Ca2+]i hysteresis loop, which consists of a transitional relaxation from the segment C to A, has almost no shift. Examples of Force-[Ca2+]i loops tracings (shown in Figure 5) demonstrate the changes between 2 and 4Hz of same muscles. For NTG (see Figure 5A), the activation part of the Force-[Ca2+]i hysteresis loop reveals an evident frequency-dependent rightward shift.
Figure 5. Phase plane analyses of force-[Ca2+]i loops in NTG and TG lines.
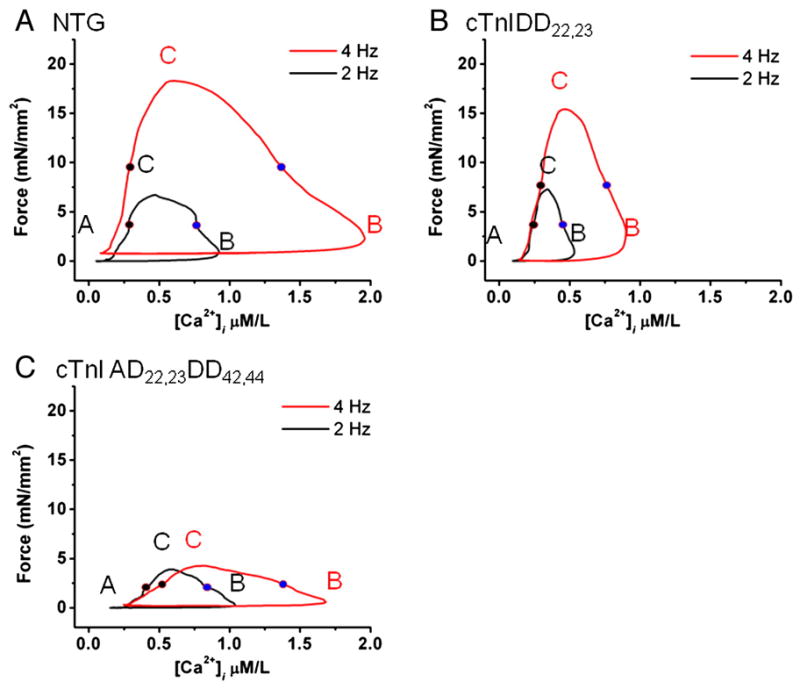
Examples of twitch forces vs. corresponding [Ca2+]i are shown at 2 Hz (black) and 4Hz (red) (1.5mM [Ca2+]o) in NTG, cTnIDD22,23 and cTnIAD22,23DD42,44 trabecular muscles. In the phase-plane analysis segments are indicated by letters A (rest), B (maximum [Ca2+]i) and C (maximum developed force). ECa50 of activation is depicted as blue filled circles while ECa50 of relaxation as black filled circles. Note the distinctive Force-[Ca2+]i hysteresis loops and ECa50. A, NTG shows that force-[Ca2+]i hysteresis loop is amplified with increased frequency, segment B and C are shifted to the right and upwards, respectively. ECa50 at 2Hz and 4Hz was 0.96±0.2 and 1.38±0.29 μM, respectively. B, cTnIDD22,23 force-[Ca2+]i hysteresis loop is modified at baseline and increase in frequency shifted point B modestly, while point C (maximal force) is preserved. ECa50 at 2Hz and 4Hz was 0.35±0.04 and 0.62±0.15 μM, respectively. C, cTnIAD22,23DD42,44 displays abnormal force-[Ca2+]i hysteresis loop, at 2 Hz transitions between B and C are less steep and the increase in frequency shifts point B rightward but does not shift point C (maximal developed force), thus the slopes of transition between B and C (force activation) and C to A (relaxation phase) are further compromised. ECa50 of activation at 2Hz and 4Hz was 0.80±0.17 and 1.12±0.23 μM, respectively.
Averaged [Ca2+]i at 50% of twitch activation (ActECa50) and [Ca2+]i at 50% of relaxation (RelECa50) in force-[Ca2+]i hysteresis loops and their relationship with frequency are shown in Figure 6A,B. This analyses confirmed that Force-[Ca2+]i loops EC50 of activation (ActECa50) increased in a frequency-dependent manner (*p< 0.05 by two-way ANOVA) in all groups, see Figure 6A. This is suggestive of a general frequency-dependent myofilament desensitization to Ca2+. However, ECa50 for activation (ActECa50) in cTnIDD22,23 was significantly lower, see Figure 6A (*p< 0.001 by two-way ANOVA), thus cTnIDD22,23 myofilaments were relatively sensitized to calcium when compared to NTG.
Figure 6. Comparison of EC50 and slopes or force-[Ca2+]i loops activation and relaxation in NTG and TG lines.

Slopes of activation and relaxation were calculated dissecting individual segments and fitting for linearity, here mid-point of activation or relaxation, as well as slope steepness was group averaged (n= 3–5 per line) and compared. A, Comparison of EC50 of activation phase (B to C segment) showed a frequency-dependent increase of EC50 in all groups, indicating a general frequency-dependent myofilament calcium desensitization, however, cTnIDD22,23 was relatively desensitized when compared to NTG (*p<0.001 by two-way ANOVA). B, Comparison of EC50 of relaxation phase (C to A segment) showed no dependence on frequency, however, cTnIDD22,23 EC50 was consistently desensitized when compared to NTG (*p<0.05 by two-way ANOVA). C, Comparison of steepness of Slopes of activation (B to C segment) reveal an increased slope in cTnIDD22,23 when compare to NTG (*p<0.001 by two-way ANOVA), on the contrary cTnIAD22,23DD42,44 displayed a decreased slope when compared to NTG (*p<0.05 by two-way ANOVA). D, Similarly, comparison of slopes of relaxation showed a marked increase in steepness in cTnIDD22,23 transition from C to A, when compare to NTG (*p<0.005 by two-way ANOVA), and a decreased slope in cTnIAD22,23DD42,44 when compared to NTG (*p<0.05 by two-way ANOVA).
On the other hand, Force-[Ca2+]i loops ECa50 of relaxation (RelECa50) did not change from 1 to 4Hz. However, cTnIDD22,23 displayed an overall significantly lower RelECa50, (see Figure 6B, *p< 0.05 by two-way ANOVA). This finding is also suggestive of relative myofilament calcium sensitization in cTnIDD22,23 when compared to NTG. Contrary to what is seen in cTnIDD22,23, ECa50 for activation (ActECa50) and relaxation (RelECa50) for cTnIAD22,23DD42,44 did not differ from NTG.
To evaluate the nature of the transitions between points B to C to A, we calculated the slopes of activation and relaxation segments. Figure 6C and 6D shows group average of activation and relaxation slopes and their relationship to frequency. This analysis showed that slope steepness was not significantly increased with frequency; however it confirmed that both TG models differed from NTG in a divergent fashion. For cTnIDD22,23, slopes of activation and relaxation were significantly steeper compared to NTG (see Figure 6C,D, *p< 0.05 by two-way ANOVA). In contrast, cTnIAD22,23DD42,44 displayed the opposite phenotype, demonstrated by significantly flatter slopes of activation and relaxation (*p< 0.05 by two-way ANOVA). This data suggests that the pseudophosphorylation of cTnI PKA sites 22/23 not only accelerates relaxation, but also accelerates force development per unit of [Ca2+]i (as demonstrated by cTnIDD22,23 having steeper slopes of activation when compared to NTG). Overall, these data support the notion that cTnIDD22,23 produces more force per unit of free [Ca2+]i and has enhanced twitch activation/relaxation kinetics per unit of [Ca2+]i.
Exogenous PKA exposure does not alter steady-state myofilament sensitivity in either TG model
Since a divergent response of the myofilaments to Ca2+ can be observed during the twitch contractile cycle versus steady-state activation, we also sought to determine steady-state force-Ca2+ relationships in skinned fibers from all three groups (NTG, cTnIDD22,23 and cTnIAD22,23DD42,44). Figure 7 shows Force-[Ca2+]o steady-state relations before and after PKA exposure, for NTG (Fig 7A), for cTnIDD22,23 (Fig 7B) and for cTnIAD22,23DD42,44 (Fig 7C). Figure 7D summarizes the ECa50 (Ca2+ required to half activation) of all three groups, before and after PKA exposure. Of note, at baseline cTnIAD22,23DD42,44 mice myofilaments were already desensitized (ECa50 of 1.99±0.44 μM for cTnIAD22,23DD42,44 vs. ECa50 of 1.23±0.09 μM for NTG, *p<0.05), thus confirming our previous data [20]. Likewise, cTnIDD22,23 mice showed a less prominent, although significant, desensitization (ECa50 of 1.48±0.1 μM for cTnIDD22,23 vs. ECa50 of 1.23±0.09 μM for NTG, *p<0.05). The relationship of myofilament MgATPase activity to Ca2+ was previously shown to be desensitized in this mouse line [18]. In agreement with our results with intact twitch muscles and force-[Ca2+]i loops analysis, maximal force of activation (Fmax) and the n Hill coefficient of cooperativity (n) were significantly reduced in cTnIAD22,23DD42,44 when compared to NTG (Fmax 29.48±6.87 mM/mm2 for cTnIAD22,23DD42,44 vs. Fmax of 59.33±5.6 mM/mm2 for NTG, *p<0.05). When these skinned fibers were exposed to the catalytic subunit of PKA (30 units for 1hr) only NTG myofilaments showed significant desensitization (ECa50 of 1.23±0.09 μM for NTG (−) PKA vs. ECa50 of 2.28±0.38 μM for NTG (+) PKA,*p<0.05). These results suggest that steady-state myofilament calcium sensitivity does not accurately predict the more physiological [Ca2+]i ECa50 observed in a twitching muscle, where cTnIDD22,23 showed a relatively enhanced calcium sensitivity and preserved force generation, particularly at higher frequencies despite modestly desensitized steady-state force-Ca2+ measurement.
Figure 7. Steady-State Force-Calcium Relationships in Skinned Fibers of NTG, cTnIDD22,23, cTnI PKA/PKC.

A, Freshly isolated trabeculae were skinned and exposed to various concentrations of calcium. NTG Control (n=6) PKA (−) solid lines, trabecuale were then washed in relaxing solution and incubated 1hr in relaxing solution containing 30 Units of PKA, then a new calcium activation protocol was carried out, NTG PKA (+) dashed lines (n=4). Same procedure was repeated B) for cTnIDD22,23 (n=5) and C) for cTnIAD22,23DD42,44 (n=5). D) Fmax comparison between NTG and TG models, cTnIAD22,23DD42,44 showed a significant reduction of force when compared with NTG (*p<0.05). E) ECa50 comparison between NTG and TG models. cTnIDD22,23 and cTnIAD22,23DD42,44 showed baseline desensitization compared to NTG. Only NTG skinned tabeculae showed a significant rightward shift after exposure to PKA (*p<0.05). F) Hill coefficient (n) comparison between NTG and TG models. cTnIAD22,23DD42,44 showed a significant reduction of cooperativity when compared with NTG (*p<0.05).
Myofilaments and Ca2+ handling protein analysis
Immunoblots for major calcium handling proteins showed a decrease in pPLB in cTnIAD22,23DD42,44 without compensatory increase in expression of SERCA2a, for more detailed see supplemental Figure 1 and online supplementary results and discussion. As determined by Pro-Q diamond protein staining, no compensatory phosphorylation was seen in other important regulatory myofilament proteins, including MyBP-C, TnT or MLC2, see supplemental Figure 2.
Computational simulations predict TG models diverge in rate constants of association for Ca2+ with the regulatory TnC site
Computer simulations were employed in order to probe for potential mechanisms by which force development and [Ca2+]i are divergent in these TG models. We chose to use an integrated model that encompasses electrophysiology, Ca2+ dynamics, contractile activity and mitochondrial energy metabolism (ECME model) for guinea pig ventricular cardiomyocytes [24]. We have focused our analysis specifically to the dynamics of contraction and Ca2+. A six state model of the tropomyosin interacting with troponin bound to Ca2+ was taken into account [24, 26], see Figure 8D. We have systematically explored a series of parameter changes with the ECME model to reproduce the type of alterations observed in the experimental dynamic force-[Ca2+]i loops at 2 Hz, FFR and steady-state force-Ca2+. Surprisingly, the set of simulation results that agree best with the experimental data are those involving changes exclusively in the association and dissociation rate constants for Ca2+ binding to both low-affinity and high-affinity binding sites in troponin C: and , see Figure 8A,B. A summary of simulation parameters for non-transgenic, cTnIDD22,23 and cTnI AD22,23DD42,44, genotype is available in supplemental Table 5 of the online supplemental data. The simulations of the contractile activity in the TG models differ in the value of the low-affinity site association constant for Ca2+, cTnI AD22,23DD42,44 , no change compared to NTG, whereas for cTnI DD22,23 , was increased 4-fold compared to NTG, overall changes in rate constants with respect to NTG are summarized in Figure 8B.
Figure 8. Computational model.

A, Computational Modeling simulation correlate with experimental results; a) Force-[Ca2+]i Loops at 2Hz and c) Force Frequency Relationship 0.5 to 2 Hz compared to corresponding experimental results, because ECME model does not extrapolate to 4Hz b) Force-[Ca2+]i at 2Hz and d) FFR 1 to 4 Hz. The ECME modeling was able to closely resemble the experimental FFR genotypes for both TG models, in particular close resemblance was displayed for experimental Force-[Ca2+]i loops of cTnIAD22,23DD42,44 genotype, however notice the different scales in frequency and [Ca2+]i. B, Summary of force generation parameters and changes predicted to impact force and calcium, cTnIDD22,23 distinctive increase in association constants to low affinity site is highlighted by a blue dashed circle. Lack of increase in the latter constant in cTnIAD22,23DD42,44. is the only parameter different from cTnIDD22,23, however simulation outcome greatly diverges. Results suggest that an increase in association-dissociation constants for high affinity Ca2+ sites are critical for successful computational modeling in both TG genotypes. Arrows express changes relative to NTG. C, Representation of phosphorylation sites on cTnI and regional interactions cTnC. Troponin complex structure molecular model, color coding of TnI (light pink), N-terminal domain and inhibitory region are schematically represented in thick black lines, phosphorylated sites are enumerated and highlighted in red circles, cTnT (light green), cTnC (light blue), Ca2+ ions (light yellow), cTnI C-Term/cTnC-N-term interactions highlighted by a blue dashed circle. Phosphorylation status of cTnI is thought to influence allosteric interactions with cTnC hydrophobic patch [33]. Troponin complex structure, PDB ID: 1J1D [53] was modeled using PDB Jmol Version 11.8.4. C, Schematic representation of model used in force generation. Troponin complex on and off rate constants (k) of Ca2+ influence tropomyosin transition states N0 to P0 and N1 to P1, P2 feeds-back to Ca2+ K off from troponin (modified from Cortassa S et al [24]).
Other simulations of contractile behavior have been run such that the rate constants of cross-bridges cycling were modified in an attempt to reproduce the experimental data. Those attempts failed to reproduce the experimental data observed in transgenic mice muscle. This does not definitively establish if these transgenic mouse models differ or not in their cross-bridge cycling rate. However, altering cross-bridge cycling rate constants could not produce similar phase plane loops between the experimental data and the ECME predicted loops.
DISCUSSION
In this study, two TG mice models with cTnI pseudophosphorylation mutants were evaluated to examine the dynamics of force development and [Ca2+]i at the cellular level. These models had previously been demonstrated to have divergent in vivo force- relationships. The main findings are that pseudophosphorylation of TnI Ser22,23 produces a FFR equivalent to control NTG albeit at lower peak [Ca2+]i. However cTnIAD22,23DD42,44 TG mice had a flat FFR for cTnIAD22,23DD42,44 with normal peak systolic calcium transients suggesting diminished responsiveness to [Ca2+]i at higher frequencies. The findings in the cTnIAD22,23DD42,44 TG mice are concordant with previous in vivo studies in which pressure-volume relationships were used to characterize FFR in intact murine ventricle [18, 20]. However, in the TG cTnIDD22,23 mice the FFR in vivo actually exceeds controls NTG and it is possible the overall increased [Ca2+]i responsiveness at the cellular level could contribute to this finding in the intact heart. In addition, cTnIAD22,23DD42,44 were found to have impaired calcium transient time to peak and transient decay (RT50%), likewise twitch force time to peak and relaxation kinetics (RT75%) were delayed. The cTnIDD22,23 did not display apparent differences in twitch or [Ca2+]i RT or TTP; however analysis of Force-[Ca2+]i hysteresis loops did reveal important differences in the lines. Analysis of slopes in transition between B and C (force activation) and C to A (relaxation phase) of Force-[Ca2+]i hysteresis loops again revealed divergent effects of genotype on slope steepness, namely, significantly greater slope steepness for cTnIDD22,23 and significantly reduced for cTnIAD22,23DD42,44. This genotype effect occurred over the range of frequencies studied.
Role of Phosphorylation of TnI at Ser 22,23
It is widely reported that PKA mediated phosphorylation of the myofilaments secondary to β-adrenergic stimulation induces a reduction in myofilament Ca2+ sensitivity, increasing cross-bridge cycling rate and twitch relaxation [27]. Phosphorylation of TnI plays a significant role in these effects, however more recent work has demonstrated that phosphorylation sites on MyBP-C may have more impact on accelerating cross-bridge cycling during this response [28–30]. Most of these studies show decreased myofilament Ca2+ sensitivity based on measurements of steady-state Force-Ca2+ relations in skinned preparations [31, 32]. In agreement with those studies, the steady-state Force-Ca2+ relations in skinned-fibers showed a decreased myofilament Ca2+ sensitivity for the cTnIDD22,23 TG mice. In terms of twitch dynamics, a shortened relaxation time was not evident, though Force-[Ca2+]i hysteresis loop analysis did reveal a steeper slope in both the activation (B to C) and relaxation (C to A) segments in the cTnIDD22,23 TG mice compared to NTG and the cTnIAD22,23DD42,44 TG line. Notably, our results on twitch dynamics differ slightly in this regard from a similar mouse developed by the Robbins laboratory [33, 34]. Yasuda et. al. have shown a small, but significant enhancement of RT50% and RT75% in this mouse line, though it does appear to be slightly more prominent in shortening unloaded cells in culture than in loaded cells. There are examples where calcium sensitivity may be altered without altering relaxation kinetics, such as Dai and colleagues [35] who reported an HNO donor that acts as a cardiac myofilament calcium sensitizer without affecting relaxation kinetics (RT50%). Nevertheless, our fundamental findings in vivo were similar to Sakthivel and colleagues [33] and showed enhanced ventricular relaxation. Thus, it appears possible to have enhanced relaxation in intact hearts in vivo without measurably enhanced twitch relaxation in vitro. The Force-[Ca2+]i hysteresis loop analysis provides some insight into the rapid decline of the tension per unit of [Ca2+]i which we speculate may underlie the enhanced relaxation in vivo.
Role of enhanced phosphorylation at TnI targets of PKC
A flat FFR in cTnIAD22,23DD42,44 mice supports the notion that increased PKC-mediated TnI phosphorylation modulates FFR in a negative fashion [9]. This finding appears to be in keeping with the fact that increased PKC activity is sufficient to impair cardiac contractility [36, 37]. This is also consistent with Roman and colleagues [38] who demonstrated that mutating residue 43 and 45 to Ala in a TG line to Ala (equivalent to 42,44 in this paper) protected the mice from the deleterious effects of overexpression of PKC eplislon. In addition, we found cTnIAD22,23DD42,44 had abnormal twitch kinetics (TTP and RT75%) accompanied by abnormal calcium transient kinetics (TTP and RT50%). These findings are in agreement with previous reports showing that activation of canonical cTnI PKC phosphorylation sites is sufficient to impair kinetics of relaxation at the myofilament level [39, 40]. One limitation in our study is that we did not mutate another PKC target site, Thr144, in the TG cTnIAD22,23DD42,44 model thus our interpretations related to PKC effect are limited. Note that this site has been reported to specifically enhance rather than decrease myofilament calcium sensitivity [41]. A recently published study demonstrated a line expressing low levels of a transgene with the Thr PKC site mutated to Glu had marked contractile depression [42].
Distinctive Force-[Ca2+]i hysteresis loops by cTnI phosphomimics
Previous studies of mouse and rat cardiac muscle including comprehensive Force-[Ca2+]i hysteresis loops analysis [3, 10, 19, 43] have proposed the myofilaments properties as the potential main contributors of activation and relaxation of the phase-plane segments. Our analysis of Force-[Ca2+]i hysteresis loops also suggest that the main differences between NTG and TG models reside in the intrinsic properties of myofilaments, though there are clear changes in Ca2+ dynamics which are likely secondary to altering the myofilaments.
In cTnIDD22,23 mice, the Force-[Ca2+]i loops demonstrate a combination of increased myofilament calcium responsiveness relative to NTG and an increased slope of transition segments between maximal calcium (point B) and maximal force (point C) which might underline the enhanced baseline and frequency related inotropy in these mice in vivo. cTnIDD22,23 phenotype in Force-[Ca2+]i loops is clearly different from the one observed in rat intact trabeculae after isoproterenol treatment, which may reflect a specific effect of cTnI phosphorylation as opposed to the broader isoproterenol effect on myofilament proteins [44]. Conversely, cTnIAD22,23DD42,44 mice have diminished myofilament calcium responsiveness and flatter slope on transition between activation and relaxation segments is found, which could partially explain their decreased force development and impaired relaxation kinetics. In a previous report, Tong and colleagues [19] concluded that CaMKII dependent phosphorylation of TnI and MyBP-C is critical in this transition segments between B to C points, in which a cross-bridge feedback mechanism is a potentially important mechanism.
One of the main findings of our studies is that cTnIDD22,23 and cTnIAD22,23DD42,44 specific alterations are able to induce distinctive transition mechanisms between activation and relaxation force-[Ca2+]i hysteresis loops segments. By delineating the specific cTnI amino acids relevant to FFR phenotype, this study fills important gaps in understanding the specific contribution of cTnI to β-adrenergic inotropy and lusitropy and to adverse contractile effects of PKC activation.
ECME model simulation predicts altered rate constants for Ca2+ association and dissociation from cTnC in TG models
We employed the ECME computational model in an attempt to gain insights into potential mechanisms that would explain our experimental data. Our analysis focused specifically to the dynamics of contraction and Ca2+, taking into account a six state model of the tropomyosin interacting with troponin bound to Ca2+ [24, 26]. Somewhat surprisingly, altering cross-bridge cycling rate contants, did not reproduce the Force-[Ca2+]i hysteresis loops. Instead, major divergence between TG models was reproduced when rate constants for association of the low affinity Ca2+ binding site of TnC are changed. Simulations altering the rate constants for this low affinity or physiological site, located in the N-terminal domain of TnC, appear to mimic the loops, albeit not perfectly as seen in Figure 8A,c). The simulations predicted that compared to NTG, an increase in rate of Ca2+ association (kon) for cTnIDD22,23 and no change in cTnIAD22,23 DD42,44, with a simultaneous 3-fold increase in the rate constant of dissociation (koff) was predicted for both TG models. Thus, a divergence in the rate constant of association of Ca2+ with the low affinity TnC binding site may be responsible for the divergent TG twitch and calcium transient’s behavior as well as divergent FFR. Evidently, more experimental work is needed to test this hypothesis. However, in association with this, both TG lines were predicted to have simultaneous changes in rates constants for association to (kon) and dissociation (koff) from the high affinity or structural sites, which are located in the C-terminal domain of TnC, see Figure 8B for a summary of changes respect to NTG.
The model of Sakthivel and colleagues [33], demonstrated by NMR chemical shift analyses that cTnI Ser22/23 phosphorylation by pseudomimicks influenced TnC N-terminal domain to adopt a more “closed” state, which is further closed if Ser43/45 and Thr144 are also pseudophosphorylated. This model lead us to speculate that structural changes of TnC N-terminal domain would correlate with changes in rate constants of binding for Ca2+ for TnC in our TG models. Indeed, our modeling predicts the fold increase (4-fold) in rate constants of association to and dissociation from the physiological or regulatory site in cTnIDD22,23 are in close agreement with experimental data of Dong and colleagues [45]. They determined the Ca2+ binding kinetics of cTnC regulatory site by means of studying fluorescence properties of IAANS labeled cTnC at Cys-35 in complex with cTnI. Their results also showed that cTnI PKA treatment induced a 2–3 fold increase in the rate constants of association (λf) and dissociation (λd1 and λd2) for the fluorescence transition associated with the conformational changes with Ca2+ binding to the regulatory site of TnC.
The modeling predictions about the decrease in rate constants of association and dissociation from the high affinity Ca2+ binding site on TnC are less straightforward to interpret. This is in part because of the very high affinity binding constant (~107 M−1) [46]. Although functional relevance is uncertain, it would be worthwhile to investigate the structural changes in troponin that are associated with these predicted alterations.
Limitations of the study
One limitation of this study is that both TG lines displayed altered Ca2+ dynamics compared to NTG. These TG mice lines might have experienced unidentified compensatory or secondary changes, which are not unusual in TG models. Nevertheless by carefully analyzing the response of the myofilaments, under both dynamic and steady state conditions the intrinsic myofilament properties could be examined. The findings in regards to the peak systolic Ca2+ transients appeared to differ from those described for a similar PKA cTnI site mutant mouse in Yasuda et al [34], however it is important to point out that Yasuda et al reported only data at basal pacing (apparently 0.5Hz). In our study, at 0.5 and 1Hz, we did not note significant differences in peak systolic Ca2+ transients or twitch force between NTG and TG models. Importantly, inclusion of data from 0.5Hz in the statistical analyses does not change the overall results or interpretation. Finally, there were differences in that we did not note shortened twitch relaxation times in our cTnIDD22,23 mice as performed by Yasuda et al. While we do not have an explanation for these differences, certainly it is not unusual to see occasional minor differences between lines generated in different labs. In addition, we cannot rule out that cTnIAD22,23DD42,44 might also have lower peak systolic Ca2+ transients if replacement was near complete as it is the case in the cTnIDD22,23 line.
Quantification of calcium handling proteins was not easily correlated with TG mouse phenotype in terms of Ca2+ dynamics. One variable not measured in this study was intrinsic SR Ca2+ load, which may have been secondarily alerted in these TG models. A difference was noted in these experiments, compared to our previous publication in that we found SERCA2a levels in cTnIAD22,23DD42,44 line was equivalent to NTG whereas our prior study had noted SERCA2a to be mildly decreased [20]. In the current study we utilized a different normalizing protein for the immunoblots and also used cardiac muscle from the exact samples from which trabeculae were taken as opposed to using stored frozen samples from separate animals in the Bilchick paper. This might account for differences, though we cannot discount a subtle change in the line. We did not systematically follow the mice with echocardiogram; therefore we can’t rule out further ventricular remodeling, since the physiologic studies were in a slightly older group than Bilchick et al. However, it is clear that even the older mice in this line do not become symptomatic so any change is unlikely to be marked.
Although our study is limited to exploring the impact of altered phosphorylation at cTnI PKA (Ser22/23) and PKC sites (Ser42/44) in the context of unperturbed Thr 144, recent studies in pseudo-phosphorylation cTnI (S43E/S45E) agree with our observations that activation of these sites is enough to lead to negative inotropy [47]. The mechanism was presumably via decreased cTnC affinity to Ca2+ and shifted actin-tropomyosin-troponin interaction to an inactive state, a phenomenon was particularly evident in cTnI S45E mutant [47].
Another potential limitation is that the physiologic experiments were performed at room temperature in this study, where the role of the myofilaments as the rate limiting step in relaxation might be less prominent [43]. Although intact trabecluae experiments in which both force and Ca2+ are measured at 37°C are feasible in rats [43], low yield of suitable trabeculae and increased susceptibility to injury with manipulation precluded us from attempting these experiments at higher temperatures. In addition, since the experiments were conducted in a mouse model and the computational model has been designed and optimized to simulate EC coupling and energetic behavior in guinea pig, there may well be quantitative differences in the force and Ca2+ dynamic behavior. Inherent to any computational model, the ECME computational model did not provide a completely satisfactory fit to experimental data. In spite of the latter, the qualitative performance of the model may still be compared to the experimental data and consequently model simulations could be used to test hypothesis about the mechanisms underlying the modifications in the behavior of TG models. Therefore the predicted alterations in rate constants should be placed in context of these ECME model limitations. Given the limitation in model being designed for guinea pig, we cannot rule strictly rule out the involvement of altered cross-bridge cycling behavior or other factors in the divergent behavior of TG models.
Conclusions
The present study demonstrates that differential pseudophosphorylation of TnI PKA and PKC sites have opposite effects on rate-related developed twitch force and determined in Force-[Ca2+]i hysteresis loops. This is in agreement with the divergent effects attributed to cTnI PKA Ser-22/23 and PKC Ser-42/44 site-specific phosphorylation [19, 31, 32, 38–40, 48–52]. It is likely that changes in force-generating properties observed in our study, i.e. enhanced for cTnIDD22,23 and impaired for cTnIAD22,23DD42,44, are the result of combined myofilament calcium responsiveness alterations and distinct changes in rates of force development and decline per unit of [Ca2+]i observed during hysteresis loops. The data indicates that cTnI phosphorylation at PKA sites plays a role in the FFR by increasing relative myofilament responsiveness and that TG models divergent contractile behavior might be due, at least in part, to altered rate constants for association of the low affinity Ca2+ binding site of cTnC. These findings have important implications for understanding the specific contribution of cTnI to β-adrenergic inotropy and lusitropy and to adverse contractile effects of PKC activation.
Supplementary Material
Acknowledgments
We thank John Robinson for expert technical assistance, Dr. Nazareno Paolocci and Dr. Jennifer Van Eyk for helpful comments and suggestions, Dr. David Graham for facilitating protein phosphorylation pattern analyses. G.A. Ramirez-Correa thanks the American Heart Association Minority Mentoring program for their support. Preliminary data of this work has been presented in the AHA Scientific Meeting 2008.
GRANTS
This work was supported by the National Institutes of Health Grants RO1-HL-63038 and NO1-HV-28180 for A.M. Murphy. W.D Gao is supported by AHA-0855439E.
Footnotes
DISCLOSURES
None
Publisher's Disclaimer: This is a PDF file of an unedited manuscript that has been accepted for publication. As a service to our customers we are providing this early version of the manuscript. The manuscript will undergo copyediting, typesetting, and review of the resulting proof before it is published in its final citable form. Please note that during the production process errors may be discovered which could affect the content, and all legal disclaimers that apply to the journal pertain.
References
- 1.Allen DG, Blinks JR. Calcium transients in aequorin-injected frog cardiac muscle. Nature. 1978 Jun 15;273(5663):509–13. doi: 10.1038/273509a0. [DOI] [PubMed] [Google Scholar]
- 2.Wier WG, Yue DT. Intracellular calcium transients underlying the short-term force-interval relationship in ferret ventricular myocardium. The Journal of physiology. 1986 Jul;376:507–30. doi: 10.1113/jphysiol.1986.sp016167. [DOI] [PMC free article] [PubMed] [Google Scholar]
- 3.Gao WD, Perez NG, Marban E. Calcium cycling and contractile activation in intact mouse cardiac muscle. The Journal of physiology. 1998 Feb 15;507( Pt 1):175–84. doi: 10.1111/j.1469-7793.1998.175bu.x. [DOI] [PMC free article] [PubMed] [Google Scholar]
- 4.Layland J, Kentish JC. Positive force- and [Ca2+]i-frequency relationships in rat ventricular trabeculae at physiological frequencies. Am J Physiol. 1999 Jan;276(1 Pt 2):H9–H18. doi: 10.1152/ajpheart.1999.276.1.H9. [DOI] [PubMed] [Google Scholar]
- 5.Endoh M. Force-frequency relationship in intact mammalian ventricular myocardium: physiological and pathophysiological relevance. Eur J Pharmacol. 2004 Oct 1;500(1–3):73–86. doi: 10.1016/j.ejphar.2004.07.013. [DOI] [PubMed] [Google Scholar]
- 6.Gwathmey JK, Slawsky MT, Hajjar RJ, Briggs GM, Morgan JP. Role of intracellular calcium handling in force-interval relationships of human ventricular myocardium. J Clin Invest. 1990 May;85(5):1599–613. doi: 10.1172/JCI114611. [DOI] [PMC free article] [PubMed] [Google Scholar]
- 7.Janssen PM, Datz N, Zeitz O, Hasenfuss G. Levosimendan improves diastolic and systolic function in failing human myocardium. Eur J Pharmacol. 2000 Sep 15;404(1–2):191–9. doi: 10.1016/s0014-2999(00)00609-9. [DOI] [PubMed] [Google Scholar]
- 8.Pieske B, Kretschmann B, Meyer M, Holubarsch C, Weirich J, Posival H, et al. Alterations in intracellular calcium handling associated with the inverse force-frequency relation in human dilated cardiomyopathy. Circulation. 1995 Sep 1;92(5):1169–78. doi: 10.1161/01.cir.92.5.1169. [DOI] [PubMed] [Google Scholar]
- 9.Lamberts RR, Hamdani N, Soekhoe TW, Boontje NM, Zaremba R, Walker LA, et al. Frequency-dependent myofilament Ca2+ desensitization in failing rat myocardium. The Journal of physiology. 2007 Jul 15;582(Pt 2):695–709. doi: 10.1113/jphysiol.2007.134486. [DOI] [PMC free article] [PubMed] [Google Scholar]
- 10.Varian KD, Janssen PM. Frequency-dependent acceleration of relaxation involves decreased myofilament calcium sensitivity. American journal of physiology. 2007 May;292(5):H2212–9. doi: 10.1152/ajpheart.00778.2006. [DOI] [PubMed] [Google Scholar]
- 11.Kobayashi T, Solaro RJ. Calcium, thin filaments, and the integrative biology of cardiac contractility. Annu Rev Physiol. 2005;67:39–67. doi: 10.1146/annurev.physiol.67.040403.114025. [DOI] [PubMed] [Google Scholar]
- 12.Metzger JM, Westfall MV. Covalent and noncovalent modification of thin filament action: the essential role of troponin in cardiac muscle regulation. Circ Res. 2004 Feb 6;94(2):146–58. doi: 10.1161/01.RES.0000110083.17024.60. [DOI] [PubMed] [Google Scholar]
- 13.del Monte F, Harding SE, Dec GW, Gwathmey JK, Hajjar RJ. Targeting phospholamban by gene transfer in human heart failure. Circulation. 2002 Feb 26;105(8):904–7. doi: 10.1161/hc0802.105564. [DOI] [PMC free article] [PubMed] [Google Scholar]
- 14.del Monte F, Harding SE, Schmidt U, Matsui T, Kang ZB, Dec GW, et al. Restoration of Contractile Function in Isolated Cardiomyocytes From Failing Human Hearts by Gene Transfer of SERCA2a. 1999:2308–11. doi: 10.1161/01.cir.100.23.2308. [DOI] [PMC free article] [PubMed] [Google Scholar]
- 15.Hashimoto K, Perez NG, Kusuoka H, Baker DL, Periasamy M, Marban E. Frequency-dependent changes in calcium cycling and contractile activation in SERCA2a transgenic mice. Basic Res Cardiol. 2000 Apr;95(2):144–51. doi: 10.1007/s003950050176. [DOI] [PubMed] [Google Scholar]
- 16.Huke S, Liu LH, Biniakiewicz D, Abraham WT, Periasamy M. Altered force-frequency response in non-failing hearts with decreased SERCA pump-level. Cardiovasc Res. 2003 Sep 1;59(3):668–77. doi: 10.1016/s0008-6363(03)00436-x. [DOI] [PubMed] [Google Scholar]
- 17.Bluhm WF, Kranias EG, Dillmann WH, Meyer M. Phospholamban: a major determinant of the cardiac force-frequency relationship. American journal of physiology. 2000 Jan;278(1):H249–55. doi: 10.1152/ajpheart.2000.278.1.H249. [DOI] [PubMed] [Google Scholar]
- 18.Takimoto E, Soergel DG, Janssen PM, Stull LB, Kass DA, Murphy AM. Frequency- and afterload-dependent cardiac modulation in vivo by troponin I with constitutively active protein kinase A phosphorylation sites. Circ Res. 2004 Mar 5;94(4):496–504. doi: 10.1161/01.RES.0000117307.57798.F5. [DOI] [PubMed] [Google Scholar]
- 19.Tong CW, Gaffin RD, Zawieja DC, Muthuchamy M. Roles of phosphorylation of myosin binding protein-C and troponin I in mouse cardiac muscle twitch dynamics. The Journal of physiology. 2004 Aug 1;558(Pt 3):927–41. doi: 10.1113/jphysiol.2004.062539. [DOI] [PMC free article] [PubMed] [Google Scholar]
- 20.Bilchick KC, Duncan JG, Ravi R, Takimoto E, Champion HC, Gao WD, et al. Heart failure-associated alterations in troponin I phosphorylation impair ventricular relaxation-afterload and force-frequency responses and systolic function. American journal of physiology. 2007 Jan;292(1):H318–25. doi: 10.1152/ajpheart.00283.2006. [DOI] [PubMed] [Google Scholar]
- 21.Gao WD, Liu Y, Mellgren R, Marban E. Intrinsic myofilament alterations underlying the decreased contractility of stunned myocardium. A consequence of Ca2+-dependent proteolysis? Circ Res. 1996 Mar;78(3):455–65. doi: 10.1161/01.res.78.3.455. [DOI] [PubMed] [Google Scholar]
- 22.Backx PH, Gao WD, Azan-Backx MD, Marban E. The relationship between contractile force and intracellular [Ca2+] in intact rat cardiac trabeculae. J Gen Physiol. 1995 Jan;105(1):1–19. doi: 10.1085/jgp.105.1.1. [DOI] [PMC free article] [PubMed] [Google Scholar]
- 23.Gao WD, Backx PH, Azan-Backx M, Marban E. Myofilament Ca2+ sensitivity in intact versus skinned rat ventricular muscle. Circ Res. 1994 Mar;74(3):408–15. doi: 10.1161/01.res.74.3.408. [DOI] [PubMed] [Google Scholar]
- 24.Cortassa S, Aon MA, O’Rourke B, Jacques R, Tseng HJ, Marban E, et al. A computational model integrating electrophysiology, contraction, and mitochondrial bioenergetics in the ventricular myocyte. Biophys J. 2006 Aug 15;91(4):1564–89. doi: 10.1529/biophysj.105.076174. [DOI] [PMC free article] [PubMed] [Google Scholar]
- 25.Schwinger RH, Bohm M, Muller-Ehmsen J, Uhlmann R, Schmidt U, Stablein A, et al. Effect of inotropic stimulation on the negative force-frequency relationship in the failing human heart. Circulation. 1993 Nov;88(5 Pt 1):2267–76. doi: 10.1161/01.cir.88.5.2267. [DOI] [PubMed] [Google Scholar]
- 26.Rice JJ, Winslow RL, Hunter WC. Comparison of putative cooperative mechanisms in cardiac muscle: length dependence and dynamic responses. Am J Physiol. :276. doi: 10.1152/ajpheart.1999.276.5.H1734. [DOI] [PubMed] [Google Scholar]; Heart Circ Physiol. 1999;45:H1734–H1754. [Google Scholar]
- 27.Layland J, Solaro RJ, Shah AM. Regulation of cardiac contractile function by troponin I phosphorylation. Cardiovasc Res. 2005 Apr 1;66(1):12–21. doi: 10.1016/j.cardiores.2004.12.022. [DOI] [PubMed] [Google Scholar]
- 28.Stelzer JE, Patel JR, Walker JW, Moss RL. Differential roles of cardiac myosin-binding protein C and cardiac troponin I in the myofibrillar force responses to protein kinase A phosphorylation. Circ Res. 2007 Aug 31;101(5):503–11. doi: 10.1161/CIRCRESAHA.107.153650. [DOI] [PubMed] [Google Scholar]
- 29.Tong CW, Stelzer JE, Greaser ML, Powers PA, Moss RL. Acceleration of crossbridge kinetics by protein kinase A phosphorylation of cardiac myosin binding protein C modulates cardiac function. Circ Res. 2008 Oct 24;103(9):974–82. doi: 10.1161/CIRCRESAHA.108.177683. [DOI] [PMC free article] [PubMed] [Google Scholar]
- 30.Bardswell SC, Cuello F, Rowland AJ, Sadayappan S, Robbins J, Gautel M, et al. Distinct sarcomeric substrates are responsible for protein kinase D-mediated regulation of cardiac myofilament Ca2+ sensitivity and crossbridge cycling. The Journal of biological chemistry. 2009 Dec 22; doi: 10.1074/jbc.M109.066456. [DOI] [PMC free article] [PubMed] [Google Scholar]
- 31.Strang KT, Sweitzer NK, Greaser ML, Moss RL. Beta-adrenergic receptor stimulation increases unloaded shortening velocity of skinned single ventricular myocytes from rats. Circ Res. 1994 Mar;74(3):542–9. doi: 10.1161/01.res.74.3.542. [DOI] [PubMed] [Google Scholar]
- 32.Zhang R, Zhao J, Mandveno A, Potter JD. Cardiac troponin I phosphorylation increases the rate of cardiac muscle relaxation. Circ Res. 1995 Jun;76(6):1028–35. doi: 10.1161/01.res.76.6.1028. [DOI] [PubMed] [Google Scholar]
- 33.Sakthivel S, Finley NL, Rosevear PR, Lorenz JN, Gulick J, Kim S, et al. In vivo and in vitro analysis of cardiac troponin I phosphorylation. The Journal of biological chemistry. 2005 Jan 7;280(1):703–14. doi: 10.1074/jbc.M409513200. [DOI] [PubMed] [Google Scholar]
- 34.Yasuda S, Coutu P, Sadayappan S, Robbins J, Metzger JM. Cardiac transgenic and gene transfer strategies converge to support an important role for troponin I in regulating relaxation in cardiac myocytes. Circ Res. 2007 Aug 17;101(4):377–86. doi: 10.1161/CIRCRESAHA.106.145557. [DOI] [PubMed] [Google Scholar]
- 35.Dai T, Tian Y, Tocchetti CG, Katori T, Murphy AM, Kass DA, et al. Nitroxyl increases force development in rat cardiac muscle. The Journal of physiology. 2007 May 1;580(Pt.3):951–60. doi: 10.1113/jphysiol.2007.129254. [DOI] [PMC free article] [PubMed] [Google Scholar]
- 36.Braz JC, Gregory K, Pathak A, Zhao W, Sahin B, Klevitsky R, et al. PKC-alpha regulates cardiac contractility and propensity toward heart failure. Nat Med. 2004 Mar;10(3):248–54. doi: 10.1038/nm1000. [DOI] [PubMed] [Google Scholar]
- 37.Takeishi Y, Chu G, Kirkpatrick DM, Li Z, Wakasaki H, Kranias EG, et al. In vivo phosphorylation of cardiac troponin I by protein kinase Cbeta2 decreases cardiomyocyte calcium responsiveness and contractility in transgenic mouse hearts. J Clin Invest. 1998 Jul 1;102(1):72–8. doi: 10.1172/JCI2709. [DOI] [PMC free article] [PubMed] [Google Scholar]
- 38.Roman BB, Goldspink PH, Spaite E, Urboniene D, McKinney R, Geenen DL, et al. Inhibition of PKC phosphorylation of cTnI improves cardiac performance in vivo. American journal of physiology. 2004 Jun;286(6):H2089–95. doi: 10.1152/ajpheart.00582.2003. [DOI] [PubMed] [Google Scholar]
- 39.Pi Y, Kemnitz KR, Zhang D, Kranias EG, Walker JW. Phosphorylation of troponin I controls cardiac twitch dynamics: evidence from phosphorylation site mutants expressed on a troponin I-null background in mice. Circ Res. 2002 Apr 5;90(6):649–56. doi: 10.1161/01.res.0000014080.82861.5f. [DOI] [PubMed] [Google Scholar]
- 40.Pi Y, Zhang D, Kemnitz KR, Wang H, Walker JW. Protein kinase C and A sites on troponin I regulate myofilament Ca2+ sensitivity and ATPase activity in the mouse myocardium. The Journal of physiology. 2003 Nov 1;552(Pt 3):845–57. doi: 10.1113/jphysiol.2003.045260. [DOI] [PMC free article] [PubMed] [Google Scholar]
- 41.Wang H, Grant JE, Doede CM, Sadayappan S, Robbins J, Walker JW. PKC-betaII sensitizes cardiac myofilaments to Ca2+ by phosphorylating troponin I on threonine-144. J Mol Cell Cardiol. 2006 Nov;41(5):823–33. doi: 10.1016/j.yjmcc.2006.08.016. [DOI] [PubMed] [Google Scholar]
- 42.Kirk JA, Macgowan GA, Evans C, Smith SH, Warren CM, Mamidi R, et al. Left Ventricular and Myocardial Function in Mice Expressing Constitutively Pseudophosphorylated Cardiac Troponin I. Circ Res. 2009 Oct 22; doi: 10.1161/CIRCRESAHA.109.205427. [DOI] [PMC free article] [PubMed] [Google Scholar]
- 43.Janssen PM, Stull LB, Marban E. Myofilament properties comprise the rate-limiting step for cardiac relaxation at body temperature in the rat. American journal of physiology. 2002 Feb;282(2):H499–507. doi: 10.1152/ajpheart.00595.2001. [DOI] [PubMed] [Google Scholar]
- 44.Varian KD, Raman S, Janssen PM. Measurement of myofilament calcium sensitivity at physiological temperature in intact cardiac trabeculae. American journal of physiology. 2006 May;290(5):H2092–7. doi: 10.1152/ajpheart.01241.2005. [DOI] [PubMed] [Google Scholar]
- 45.Dong WJ, Wang CK, Gordon AM, Rosenfeld SS, Cheung HC. A kinetic model for the binding of Ca2+ to the regulatory site of troponin from cardiac muscle. The Journal of biological chemistry. 1997 Aug 1;272(31):19229–35. doi: 10.1074/jbc.272.31.19229. [DOI] [PubMed] [Google Scholar]
- 46.Gordon AM, Homsher E, Regnier M. Regulation of contraction in striated muscle. Physiol Rev. 2000 Apr;80(2):853–924. doi: 10.1152/physrev.2000.80.2.853. [DOI] [PubMed] [Google Scholar]
- 47.Mathur MC, Kobayashi T, Chalovich JM. Negative charges at protein kinase C sites of troponin I stabilize the inactive state of actin. Biophys J. 2008 Jan 15;94(2):542–9. doi: 10.1529/biophysj.107.113944. [DOI] [PMC free article] [PubMed] [Google Scholar]
- 48.Burkart EM, Sumandea MP, Kobayashi T, Nili M, Martin AF, Homsher E, et al. Phosphorylation or glutamic acid substitution at protein kinase C sites on cardiac troponin I differentially depress myofilament tension and shortening velocity. The Journal of biological chemistry. 2003 Mar 28;278(13):11265–72. doi: 10.1074/jbc.M210712200. [DOI] [PubMed] [Google Scholar]
- 49.Herron TJ, Korte FS, McDonald KS. Power output is increased after phosphorylation of myofibrillar proteins in rat skinned cardiac myocytes. Circ Res. 2001 Dec 7;89(12):1184–90. doi: 10.1161/hh2401.101908. [DOI] [PubMed] [Google Scholar]
- 50.Kentish JC, McCloskey DT, Layland J, Palmer S, Leiden JM, Martin AF, et al. Phosphorylation of troponin I by protein kinase A accelerates relaxation and crossbridge cycle kinetics in mouse ventricular muscle. Circ Res. 2001 May 25;88(10):1059–65. doi: 10.1161/hh1001.091640. [DOI] [PubMed] [Google Scholar]
- 51.MacGowan GA, Evans C, Hu TC, Debrah D, Mullet S, Chen HH, et al. Troponin I protein kinase C phosphorylation sites and ventricular function. Cardiovasc Res. 2004 Aug 1;63(2):245–55. doi: 10.1016/j.cardiores.2004.04.010. [DOI] [PubMed] [Google Scholar]
- 52.Noland TA, Jr, Guo X, Raynor RL, Jideama NM, Averyhart-Fullard V, Solaro RJ, et al. Cardiac troponin I mutants. Phosphorylation by protein kinases C and A and regulation of Ca(2+)-stimulated MgATPase of reconstituted actomyosin S-1. The Journal of biological chemistry. 1995 Oct 27;270(43):25445–54. doi: 10.1074/jbc.270.43.25445. [DOI] [PubMed] [Google Scholar]
- 53.Takeda S, Yamashita A, Maeda K, Maeda Y. Structure of the core domain of human cardiac troponin in the Ca(2+)-saturated form. Nature. 2003 Jul 3;424(6944):35–41. doi: 10.1038/nature01780. [DOI] [PubMed] [Google Scholar]
Associated Data
This section collects any data citations, data availability statements, or supplementary materials included in this article.