Abstract
Skeletal fragility is an important health problem with a large genetic component. We performed a 603 animal F2 reciprocal intercross of the recombinant congenic strains HcB-8 and HcB-23 to genetically map quantitative trait loci (QTLs) for tissue-level femoral biomechanical performance. These included elastic and post-yield strain, Young’s modulus, stress and maximum strain, and toughness and were calculated from 3-point bend testing of femora by the application of standard beam equations. We mapped these with R/qtl and QTL Cartographer and established significance levels empirically by permutation testing. Significant QTLs for at least one trait are present on chromosomes 1, 6, and 10 in the full F2 population, with additional QTLs evident in subpopulations defined by sex and cross direction. On chromosome 10, we find a QTL for post-yield strain and toughness, phenotypes that have not been mapped previously. Notably, the HcB-8 allele at this QTL increases post-yield strain and toughness, but decreases bone mineral density (BMD), while the material property QTLs on chromosomes 1, 6, and at a second chromosome 10 QTL are independent of BMD. We found significant sex × QTL and cross-direction × QTL interactions. A robust, pleiotropic chromosome 4 QTL that we previously reported at the whole bone level showed no evidence of linkage at the tissue level, supporting our interpretation that modeling capacity is its primary phenotype. . Our data demonstrate an inverse relationship between femoral perimeter and Young’s modulus, with R2 = 0.27, supporting the view that geometric and material bone properties are subject to an integrated set of regulatory mechanisms. Mapping QTLs for tissue-level biomechanical performance advances understanding of the genetic basis of bone quality.
Keywords: recombinant congenic mice, biomechanics, linkage mapping, systems biology, bone quality
INTRODUCTION
Skeletal fragility is an important health problem (for review, see [1]). In developed countries, the burden of fracture-related morbidity and mortality is increasing as the population ages. Multiple risk factors for fracture have been identified in epidemiological studies (e.g. [2, 3]). Moreover, it is well-established that the genetic contribution to fracture risk is substantial (for review, see ([4–6]).
For these reasons, there has been substantial interest in identifying the genes and alleles that underlie the genetic contribution to differences in fracture risk. The majority of this literature is devoted to bone mineral density as the phenotype of interest, although an increasing fraction now also addresses bone size as well. Biomechanical performance has been studied as a phenotypic endpoint in only a small number of rodent genetic mapping experiments [7–17]. The relative dearth of biomechanical genetic investigations reflects the very real barriers to their successful completion: greater technical difficulty, lesser robustness of the phenotypes, and ultimately lesser statistical power to find quantitative trait loci (QTLs). Thus, in striking the balance between the similarity of the outcome measures to the clinical endpoint of fracture and experimental feasibility, the balance has generally favored the pragmatic issues.
Yet, to achieve the ultimate goal of identifying the genes responsible for variation in bone’s biomechanical performance, will require that we understand the biology underlying the phenotypes studied. These are generally remote from the actions of individual genes at the cellular level, so that identifying a QTL with a specific gene is challenging even under the most favorable circumstances. When confronted with a set of positional candidate genes identified by linkage mapping or whole genome association mapping, it is necessary to consider the mechanisms that might lead from gene to the measured phenotype to decide which among them is likeliest to be the responsible gene. Moreover, clinically important phenotypes are not equally well represented by surrogate measures such as bone mineral density. Bone mineral density is a reasonably useful marker for the load that a bone can tolerate, but it provides no insight into how much a bone can bend, or how well a damaged bone is able to resist completion of a fracture. These bone properties are both aspects of bone quality, and are difficult to measure noninvasively, and are therefore appropriate targets for study in a model system.
It is useful to distinguish the relative contributions of bone tissue’s inherent mechanical behavior, bone size, and bone architecture to whole bone strength and to map genes for each of them. However, these conceptual components of bone biomechanical performance do not correspond to the usual measurements that are obtained in real experimental settings. This is particularly true in mice, whose bones are too small to allow uniform specimens to be prepared for mechanical testing. A standard approach to achieve this end is to test whole bones and then apply beam theory to “factor out” the contribution of bone size to its mechanical performance. Simple algebraic transformations calculate material, i.e. tissue-level, properties (strain, stress, toughness, modulus) from biomechanical tests of whole bones (displacement, load, energy, and stiffness) and measures of whole bone geometry [18]. Here, we report application of beam theory to map genes for tissue-level biomechanical performance in a reciprocal intercross of the recombinant congenic strains HcB-8 and HcB-23 that we recently analyzed at the whole bone level [19]. HcB-8 and HcB-23 were chosen as parental strains because we previously found that they differ greatly in tissue-level mechanical performance of humeral cortical bone, and that these differences are accompanied by differences in collagen cross-linking and apatite crystallinity [20, 21]. We find that most of the QTLs identified in that prior study also include material-level mechanical performance phenotypes. We report here successful linkage mapping of QTLs for post-yield strain and toughness, phenotypes that have not previously been mapped genetically. We also note an important negative result: a robust pleiotropic chromosome 4 QTL affecting bone size, strength and bone mineral density, which yielded the strongest evidence of linkage for whole bone biomechanics [19], was not detected for any aspect of tissue-level biomechanical performance.
MATERIALS AND METHODS
Mice
The parental mice in this study were the recombinant congenic strains HcB-8 and HcB-23, produced by inbreeding N3 C3H/DiSnA (C3H) × C57BL/10ScSnA (B10) mice to fixation [22]. This breeding program resulted in inbred strains harboring alleles of B10 origin at approximately 1/8 of the genome on a C3H background. Therefore, only approximately ¼ of the genome segregates in an intercross of HcB-8 and HcB-23, with the remaining portions of the genome fixed for the same allele in both parental strains. We performed a reciprocal F2 intercross, producing 603 F2 mice, and maintained the animals to an age of 17 ± 1 weeks, as this is the age at which mice achieve peak bone mass [23]. Mice were housed 2–5 mice per 500cm2 cages, with 12h light-dark cycling, given autoclaved tap water and fed laboratory rodent chow 5001 (PMI Nutrition International, Richmond, IN) ad lib. Animals were euthanized by CO2 inhalation, following AVMA recommendation. Immediately following sacrifice, animals were weighed and measured (rostro-anal length), viscera were harvested for DNA isolation (Puregene), and femora and humeri were dissected free of soft tissue for additional phenotyping. Bones were wrapped in phosphate buffered saline-saturated gauze and stored frozen at −70°. The animal protocol was approved by the University of Wisconsin and the William S. Middleton Memorial Veterans’ Hospital IACUCs.
Phenotyping
We measured areal BMD of isolated femora by DXA as previously described [24].
We tested femoral diaphysis biomechanical performance and bone dimensions in the plane of testing as previously described [19]. Whole bone biomechanical properties were obtained directly from the load-displacement curves and included elastic displacement (bending of the bone at the yield point), post-yield strain (bending of the bone between the yield point and fracture), total deflection (sum of elastic and post-yield deflections), yield load (load at the yield point, where the slope of the load-displacement curve declines by 5%), maximum load, stiffness (slope of the linear region of the load-displacement curve), and energy to failure (area under the load-displacement curve). Images of the fracture surface yielded the bone geometry, including the anteroposterior diameter and anteroposterior cross-sectional moment of inertia used in the beam equations.
We used the geometric properties and the whole bone mechanical testing data to calculate the material properties of the bone tissue according to the standard beam theory equations [18], using the averages of both femora for linkage analysis: Stress (σ), (MPa) = FLc/4I with F= force, L = length, c = outer diameter in the plane of bending
Strain (ε), (mm/mm) = 12cd/L2 with c = outer diameter in the plane of bending, d = displacement, L = length
Young’s Modulus (E), (MPa) = (F/d)(L3/48I), with F = force, L = length, and I = cross sectional moment of inertia in the plane of bending.
Toughness (K), (MPa) = area under the stress strain curve
Genotyping and linkage analysis
We genotyped the F2 progeny at 41 microsatellite markers informative in the cross [25], using standard methods. Map positions of markers and genes are based the Mouse Genome Database (build 37) (http://www.informatics.jax.org/genes.shtml) [26]. We adjusted the locations of D1Mit105, and D3Mit199 to reflect the observed recombination frequencies in our cross [19]. The markers, map locations, and reaction conditions are given in table 1 of reference 15.
We performed the primary linkage analysis by interval mapping [27] as implemented in R/qtl [28], using the Haley-Knott regression method [29] We performed the linkage analysis using sex and cross arm as additive covariates (.i.e. phenotypes adjusted by linear regression for sex and cross direction). We performed secondary analyses by composite interval mapping analysis [30] and multiple trait linkage analysis [31] as implemented in QTL Cartographer [32, 33]. For tests of QTL interactions with sex, cross direction, or both, we explicitly compared the covariate in question as an interactive covariate in the full linkage model and compared it to a model in which both sex and cross direction were treated as additive covariates. Algebraically, the additive model can be represented as follows:
P = q1 + q2 + ….qn + R, where P is the sex and cross-adjusted phenotype value, the qi’s are the contributions of each QTL to the phenotype, and R is the residual phenotypic variance. A model including sex × QTL interactions is then:
P = q1 + q2 + …qn + q1*S + q2*S …qn*S, where qi*S is the interaction of each QTL with sex. Cross × QTL interactions follow exactly the same form, with inclusion of a series of qi*C terms. Simultaneous sex and cross interaction models include both sets of interaction terms in the model. The interaction LOD score is the difference between full model LOD score and additive model LOD score [28, 34]. We established significance thresholds empirically by permutation tests [35]. For the interaction tests, we used the same seed value to ensure that the permutation tests examined the same simulated data sets. The additive model includes 2 degrees of freedom (additive and dominance effects), and the interactive models include an additional 2 degrees of freedom for each included interactive factor (factor × QTL additive effect and factor × QTL dominance effect). Thus, the full model including interactions for both sex and cross direction has 6 degrees of freedom. The significance threshold for the interaction test was experiment-wide p < 0.05.
Other statistical analyses
Comparisons of intercross subgroups were by 2-way ANOVA, with sex and cross direction as factors, with post hoc evaluation of significant differences between groups by the Holm-Sidak test. If necessary, we transformed the raw data to satisfy the assumptions of parametric statistical testing or used the non-parametric rank sum test or ANOVA on ranks when common transforms failed to normalize the data and stabilize the variances. Statistical analyses were performed with SigmaStat 3.0 (SPSS).
RESULTS
We phenotyped 603 F2 mice by quasi-static 3-point bending and image analysis of the fracture surfaces. We applied standard beam equations to calculate strain and stress. The parental phenotypes, at both the whole bone and tissue levels, are summarized in table 1. The parental strains HcB-8 and HcB-23 differ in multiple whole bone phenotypes, with HcB-23 having larger, more elliptical, stiffer, and more brittle bones whose yield and maximum loads are larger but whose energy to failure is lower than HcB-8 bones. At the tissue level, HcB-8 bones have greater yield and maximum stress, post-yield and total strain, Young’s modulus, and toughness.
Table 1.
Femoral Biomechanical Performance and Geometry in HcB-8 and HcB231
| HcB-8 | HcB-23 | |||
|---|---|---|---|---|
| female (N = 6) | male (N = 7) | female (N = 14) | male N = 16) | |
| Body Mass (g)2,3 | 19.9 ± 2.2 | 22.6 ± 1.6 | 23.9 ± 2.2 | 27.9 ± 1.8 |
| Body Length (cm)2,6 | 8.8 ± 0.4 | 9.0 ± 0.3 | 9.5 ± 0.4 | 9.6 ± 0.3 |
| CSA (mm2)2 | 0.90 ± 0.12 | 0.91 ± 0.08 | 1.02 ± 0.08 | 1.15 ± 0.12 |
| Perimeter (mm)2,3 | 4.18 ± 0.32 | 4.42 ± 0.24 | 4.52 ± 0.19 | 4.96 ± 0.23 |
| Inner Minor Axis (mm)3 | 0.50 ± 0.06 | 0.61 ± 0.06 | 0.53 ± 0.03 | 0.58 ± 0.04 |
| Inner Major Axis (mm)2,3,4 | 0.68 ± 0.06 | 0.83 ± 0.08 | 0.80 ± 0.07 | 0.86 ± 0.07 |
| Outer Minor Axis (mm)2,5 | 1.08 ± 0.10 | 1.12 ± 0.05 | 1.15 ± 0.04 | 1.16 ± 0.04 |
| Outer Major Axis (mm)2,3 | 1.43 ± 0.12 | 1.55 ± 0.10 | 1.58 ± 0.08 | 1.81 ± 0.11 |
| Shape Factor (unitless)2,3,4 | 1.35 ± 0.07 | 1.40 ± 0.07 | 1.37 ± 0.08 | 1.56 ± 0.07 |
| CSMI (mm4)2,3 | 0.080 ± 0.02 | 0.090 ± 0.02 | 0.107 ± 0.01 | 0.118 ± 0.01 |
| Femoral Length (mm) | 15.51 ± 0.45 | 15.36 ± 0.23 | 15.32 ± 0.38 | 15.36 ± 0.28 |
| Slenderness (unitless)2,3 | 3.73 ± 0.21 | 3.48 ± 0.19 | 3.39 ± 0.14 | 3.11 ± 0.16 |
| Yield Displacement (mm) | 0.14 ± 0.02 | 0.14 ± 0.02 | 0.14 ± 0.02 | 0.15 ± 0.02 |
| Post-Yield Displacement (mm)2,5 | 0.40 ± 0.18 | 0.35 ± 0.04 | 0.18 ± 0.03 | 0.14± 0.03 |
| Total Displacement (mm)2,5 | 0.54 ± 0.16 | 0.49 ± 0.05 | 0.32 ± 0.04 | 0.28 ± 0.05 |
| Stiffness (N/mm)2 | 122 ± 27 | 125 ± 16 | 137 ± 15 | 142 ± 14 |
| Yield Load (N)2 | 14.1 ± 2.3 | 13.9 ± 2.0 | 16.3 ± 1.5 | 16.4 ± 0.9 |
| Maximum Load (N)2 | 17.3 ± 3.3 | 17.9 ± 1.9 | 19.7 ± 1.6 | 19.9 ± 1.4 |
| Energy (N-mm)2,5 | 7.14 ± 3.23 | 6.46 ± 0.87 | 4.28 ± 0.73 | 3.54 ± 0.65 |
| Yield Strain (unitless)5 | 0.016 ± 0.001 | 0.017 ± 0.002 | 0.018 ± 0.002 | 0.019 ± 0.004 |
| Post-Yield Strain (unitless)2,6 | 0.049 ± 0.026 | 0.042 ± 0.004 | 0.023 ± 0.006 | 0.017 ± 0.004 |
| Total Strain (unitless)2,6 | 0.066 ± 0.025 | 0.059 ± 0.006 | 0.039 ± 0.005 | 0.035 ± 0.006 |
| Modulus (MPa)2,3 | 13480 ± 570 | 12230 ± 1040 | 11330 ± 1260 | 10680 ± 1510 |
| Yield Stress (MPa)2,3 | 181 ± 6 | 159 ± 9 | 165 ± 15 | 153 ± 14 |
| Maximum Stress (MPa)2,3,5 | 222 ± 15 | 209 ± 7 | 199 ± 17 | 186 ± 23 |
| Toughness (MPa)2,6 | 10.75 ± 4.58 | 8.85 ± 0.85 | 5.44 ± 1.00 | 4.19 ± 0.64 |
| Areal BMD (mg/cm2)2,3,4 | 59.9 ± 4.1 | 54.8 ± 3.3 | 60.9 ± 3.3 | 59.9 ± 2.0 |
Data shown as mean ± SD
Significant difference between strains
Significant difference between sexes
Significant interaction between strain and sex.
Data transformed to satisfy ANOVA assumptions of normality and equal variance
Data analyzed by non-parametric rank sum test.
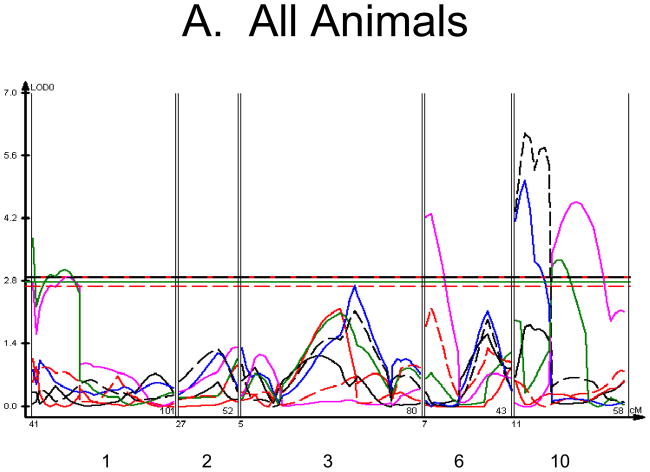
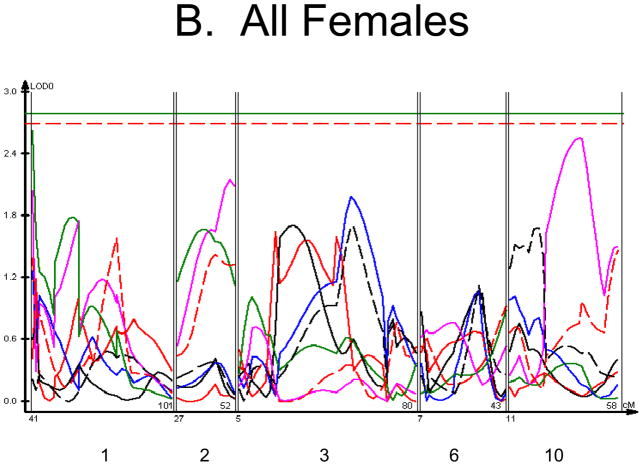
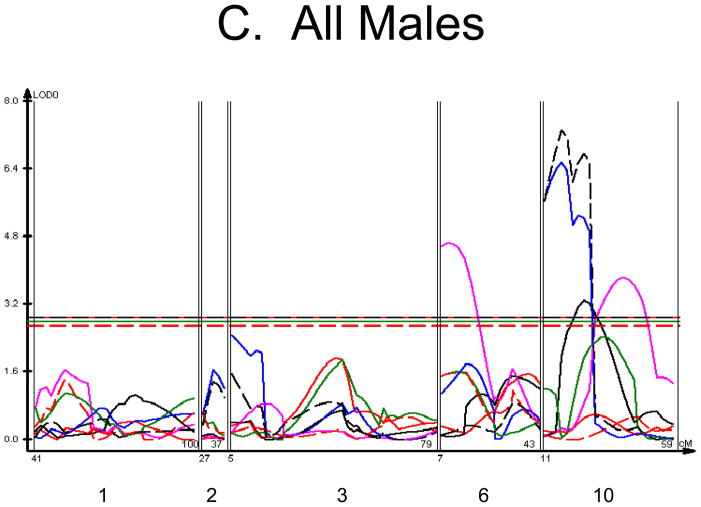
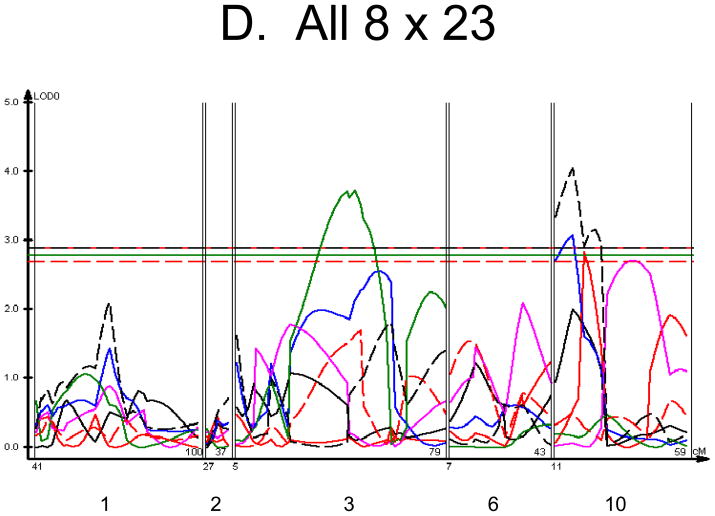
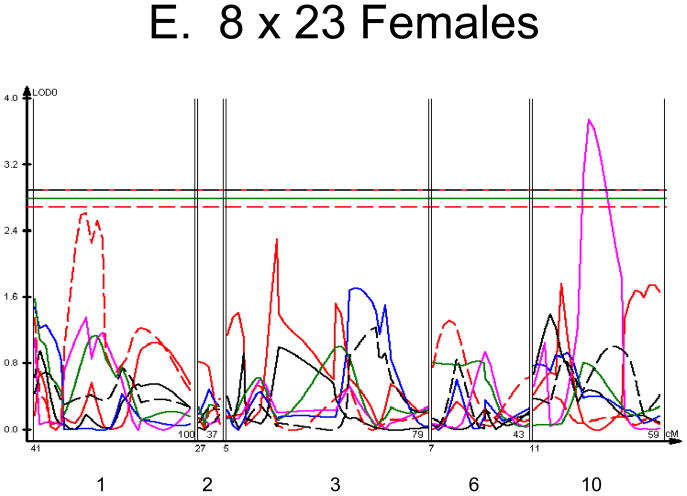
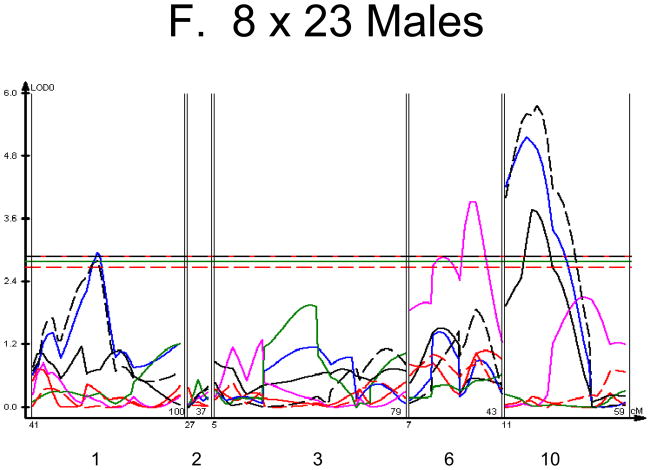
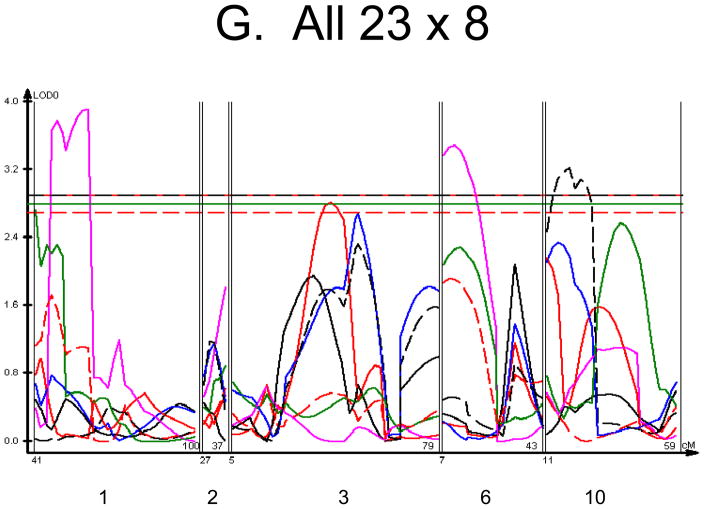
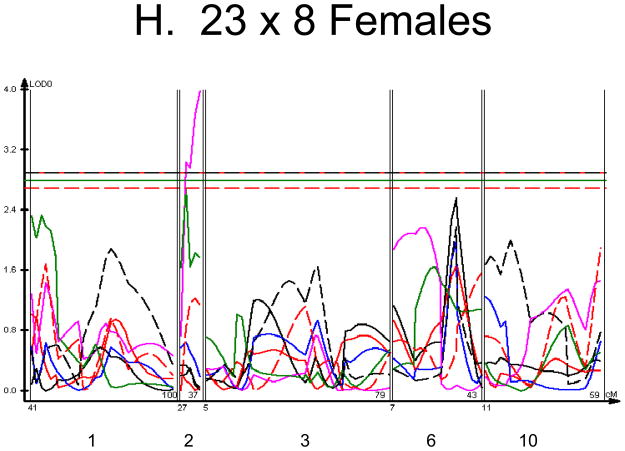
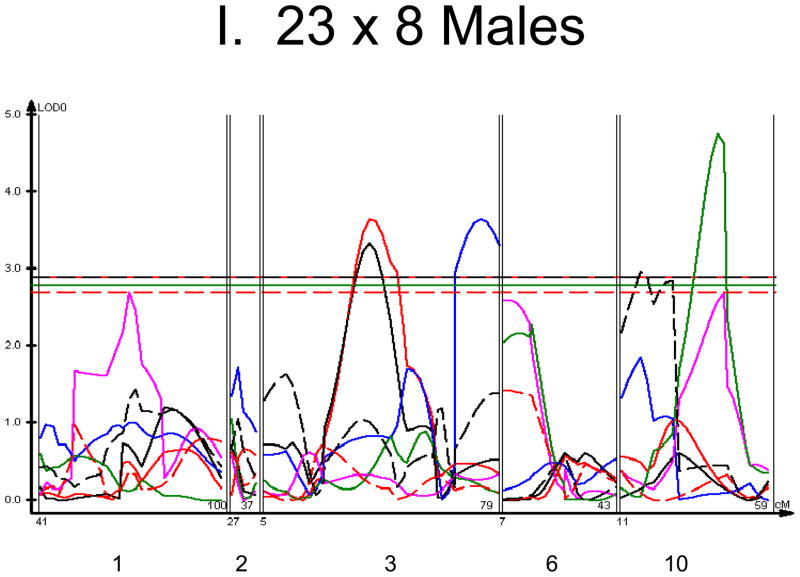
We used each calculated material-level biomechanical property as a trait to perform linkage analysis. The traits used for linkage mapping were yield strain, post-yield strain, failure strain, yield stress, maximum stress, Young’s modulus, and toughness. Because of the breeding scheme by which HcB-8 and HcB-23 were established, only ~1/4 of the genome segregates, and QTLs can only be found within those regions of the genome. The informative regions for linkage include segments on chromosomes 1, 2, 3, 4, 6, 9, 10, 15, 17, and 19. The results are summarized in figure 1 and table 2. Chromosomes 1, 6, and 10 display significant linkage to one or more material properties in the entire 603 animal F2 population. Significant linkages are also present on chromosomes 2 and 3 in one or more subgroups of the F2. All the traits except for Young’s modulus yielded at least one significant QTL in at least one subgroup of the F2 population. The effect sizes for the material property QTLs are summarized in table 3.
Figure 1. Linkage Maps of the HcB-8 × HcB-23 Intercross.
A. All animals. B. All females. C. All males. D. All 8 × 23. E. 8 × 23 females. F. 8 × 23 males. G. All 23 × 8. H. 23 × 8 females. G. 23 × 8 males. In each panel the linkage map includes chromosomes 1, 2, 3, 6, and 10. While there are informative regions on chromosomes 4, 9, 15, 17, and 19, none harbor significant QTLs and they are therefore omitted for greater clarity. Location in the genome is shown on the X axis, with chromosomes labeled. LOD score is shown on the Y axis. The continuous horizontal lines are the p = 0.05 experiment-wide significance thresholds established by permutation testing, and these range from LOD = 2.7 to LOD = 2.9. Line types are as follows: yield strain = red solid, post-yield strain = blue solid, total strain = black solid, yield stress = green solid, maximum strain = magenta solid, Young’s modulus = red dashed, toughness = black dashed.
Table 2.
Summary of Linkage Data1
| Trait (5% threshold) | All F2 | All Female | All Male | All 8×23 | 8×23 Female | 8×23 Male | All 23×8 | 23×8 Female | 23×8 Male |
|---|---|---|---|---|---|---|---|---|---|
| Yield Strain (2.9) | 3, 38, 3.6 | ||||||||
| Max Strain (2.8) | 10, 26, 3.3 | 10, 22, 3.8 | 3, 38, 3.3 | ||||||
| Post-Yield Strain (2.8) | 10, 16, 5.0 | 10, 17, 6.5 | 10, 18, 3.1 | 1, 66, 2.9 10, 19, 5.2 |
3, 73, 3.7 | ||||
| Max Stress (2.8) | 1, 56, 2.9 6, 10, 4.3 10, 37, 4.5 |
6, 10, 4.6 10, 38, 3.8 |
10, 32, 3.7 | 6, 32, 3.9 |
1, 60, 3.9 6, 12, 3.5 |
2, 36, 4.0 | |||
| Yield Stress (2.8) |
1, 41, 3.7 10, 28, 3.3 |
3, 47, 3.7 | 10, 42, 4.7 | ||||||
| Young’s Modulus (2.7) | |||||||||
| Toughness (2.9) | 10, 16, 6.1 | 10, 18, 7.2 | 10, 18, 4.0 | 10, 23, 5.7 | 10, 19, 3.2 | 10,18, 3.0 |
Cells show the chromosome, map position of the maximum LOD score on the chromosome, and the LOD score. Each chromosome is shown on a separate line within the cell. Linkage signals with experiment-wide p < 0.01 are shown in bold face.
Table 3.
Material Properties QTL Effect Sizes
| Chromosome | Position | HcB-8 Phenotype1 (SEM) | Heterozygote Phenotype1 (SEM) | HcB-23 Phenotype1 (SEM) | Additive Effect2 | Dominance Effect3 | % F2 Variance | |
|---|---|---|---|---|---|---|---|---|
| Post-Yield Strain (unitless) | 10 | 16 | 2.05×10⁻³ (7.1×10⁻⁴) | −7×10⁻⁵ (5.1×10⁻⁴) | −2.26×10⁻³ (6.59×10⁻⁴) | −4.31×10⁻³ | −5×10⁻⁵ | 3.1 |
| Max Stress (MPa) | 1 | 41 | −4 (2) | −1 (2) | 6 (3) | 5 | −2 | 1.9 |
| 6 | 10 | −2 (3) | −3 (2) | 9 (2) | 5 | −7 | 2.8 | |
| 10 | 37 | 5 (2) | 2 (2) | −8 (2) | −7 | 4 | 3.0 | |
| Yield Stress (MPa) | 1 | 56 | −5 (3) | −2 (2) | 8 (3) | 7 | −4 | 2.3 |
| 10 | 28 | 3 (3) | 1 (2) | −7 (3) | −5 | 3 | 1.2 | |
| Toughness (MPa) | 10 | 16 | 0.9 (0.3) | 0.0 (0.2) | −1.0 (0.2) | −1.0 | 0.1 | 4.5 |
Phenotype values are age and sex adjusted.
Additive effect = ½[average HcB-23 phenotype-average HcB-8 phenotype]
Dominance effect = average heterozygote phenotype-1/2[average HcB-8 phenotype + average HcB-23 phenotype
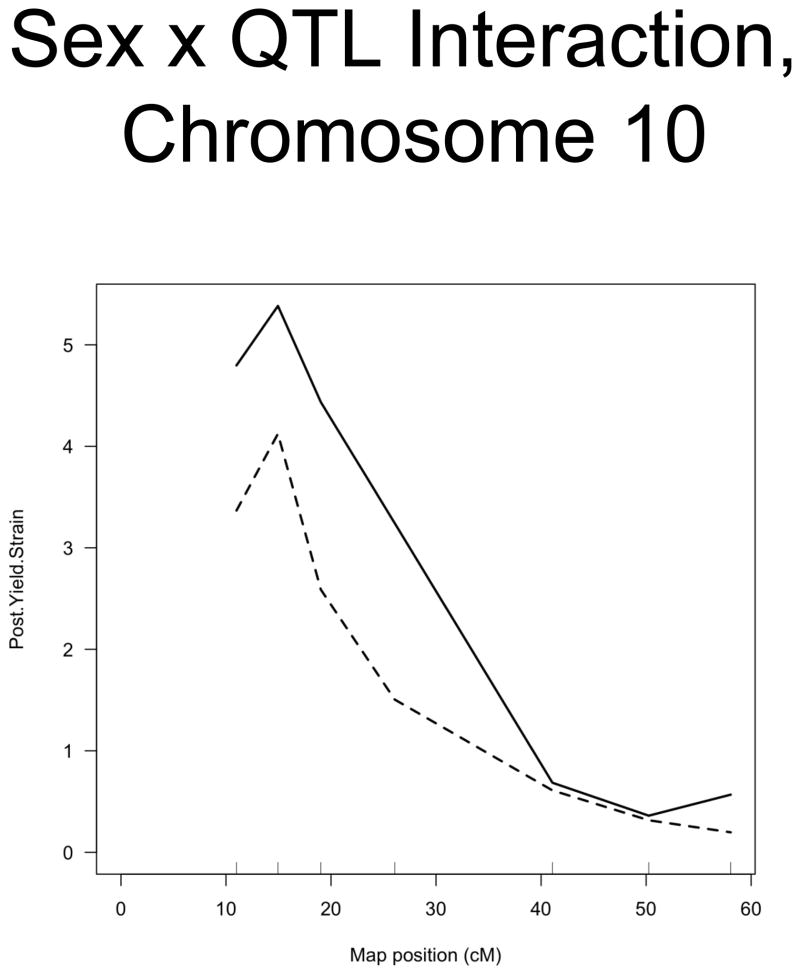
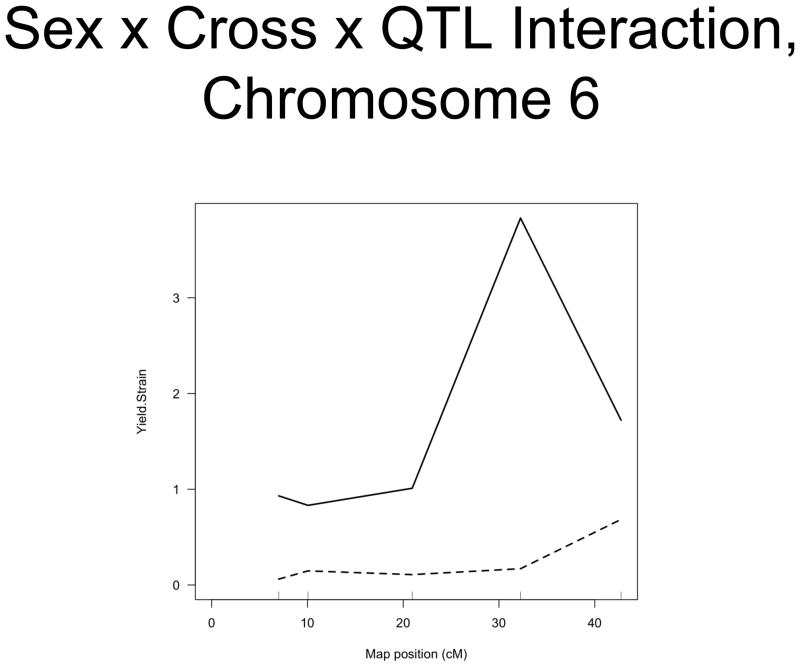
The linkage analysis revealed significant sex × QTL interactions on chromosomes 6 and 10 and a significant cross × QTL interaction on chromosome 6. These are summarized in table 4 and figure 2. These interactions represent a difference in the linkage relationship by virtue of sex or cross direction, not simply the tendency of the phenotype to differ between males and females, or between 8 × 23 and 23 × 8 animals. Graphically, the interactive effect is the distance separating the LOD solid and dotted plots, which show the LOD scores in the interactive and additive models (figure 2). The biological impact of the interaction is easily appreciated by comparing the male and female chromosome 6 linkage plots (figure 1c v figure 1b). There is a significant QTL on chromosome 6 in males, but not in females. The magnitude of the QTL in males is sufficient so that the QTL remains apparent in the entire population.
Table 4.
Sex × QTL and Cross × QTL Interactions
| Covariate | Chromosome | Map Position | Trait (interaction p value) |
|---|---|---|---|
| Sex | 10 | 19 | Post-Yield Strain (0.049) |
| Sex and Cross | 6 | 32 | Yield Strain (0.016) |
Figure 2. Significant Interactions of Sex and Cross Direction with QTLs.
A. Sex × QTL interaction on chromosome 10. B. Sex × Cross Direction × QTL Interaction on chromosome 6. Map position is plotted on the X axis and LOD score is plotted on the Y axis. The solid lines indicate the LOD scores for the interactive model, while the dotted lines indicate the LOD scores for the model in which sex and cross direction are both additive covariates (i.e. trait values adjusted for sex and cross direction).
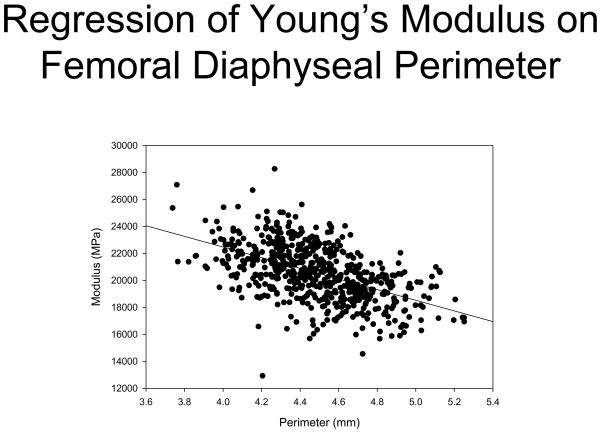
Finally, we explored the relationship between Young’s modulus and bone size, finding that there is a strong inverse correlation between these as shown in figure 3. Perimeter accounts for more than ¼ of the observed variability of modulus. Adding cortical thickness into the model did not improve the regression model’s explanatory power.
Figure 3. Regression of Young’s modulus on femoral diaphysis perimeter.
Each point represents 1 animal, and is the average of the measurements of the left and right femora. N = 603.
DISCUSSION
Our study reveals QTLs for post yield strain and toughness on chromosome 10, for yield and maximum stress on chromosomes 1 and 10, and maximum stress on chromosome 6. The chromosome 1 and 6 QTLs do not coincide with BMD QTLs [19]. The chromosome 10 QTL for post-yield strain and toughness also affects BMD, but the relationship between BMD and the tissue level properties is inverse, with the HcB-8 allele increasing post-yield strain and toughness but decreasing BMD. The chromosome 10 QTL for yield and maximum stress is located 20 cM from that affecting BMD, post-yield strain, and toughness. The chromosome 10 post-yield strain, toughness and BMD QTL overlaps that reported for maximum load and energy to failure observed in a C57BL/6J × C3H/HeJ intercross [8]. Notably, these investigators noted that this QTL affected biomechanical performance but not bone geometry, in exact accordance with our data. Additional material property QTLs are identified in specific subgroups of the F2 population. The locations of the material property QTLs coincide with those of QTLs we mapped for either whole bone biomechanical performance or bone geometry in this cross [19]. The QTL on chromosome 6 is more robust at the tissue level than at the whole bone level, raising the possibility that this locus’s primary effect may be exerted at the level of bone matrix composition, rather than by an effect on bone modeling. Wergedal and colleagues [9] undertook comprehensive mapping of femoral biomechanical performance and geometry in a NZB/B1NJ × RF/J intercross, and reported that the majority of the mechanical performance QTLs also impacted either bone size or BMD. By mapping tissue-level biomechanical performance QTLs, the data presented here represent an advance in identifying the genetic factors that underlie bone quality.
Notably absent is a linkage peak on chromosome 4, where we found a pleiotropic QTL for whole bone biomechanical performance and bone geometry in our earlier work [19]. Our experiment provided 65% power to detect a QTL with effect size = 2% of the F2 variance, 80% power to detect a QTL with effect size = 3%, and 95% power to detect a QTL with effect size 4% [27]. Traditionally, a population is deemed sufficient if it yields 50% power to detect a QTL. In our cross, the threshold effect size by this criterion is 1.7% of the F2 variance [36]. This QTL included the highest LOD scores we obtained at the whole-bone level: LODs of 17.5 for shape factor, 13.4 for cross-sectional area, 13.1 for maximum load, 12.7 for outer major axis, 9.5 for yield load, 9.2 for slenderness, 8.8 for femoral BMD, 7.8 for perimeter, 6.5 for stiffness, 4.8 for body mass, 4.1 for cross-sectional moment of inertia, and 4.1 for femoral length. The minimum fraction of the whole bone F2 variance explained by the chromosome 4 QTL (i.e. its weakest contribution to any of the linked phenotypes) was 2.5%. The negative linkage result for chromosome 4 therefore can’t simply be dismissed as a result of an underpowered experiment. The negative result for tissue-level biomechanical performance suggests that the biomechanical impact of the chromosome 4 QTL is exerted via its effect on bone geometry rather than via an alteration the composition or structural organization of the bone matrix. We proposed that the gene responsible for the chromosome 4 QTL is Ece1, and that it exerts its actions by modulating Wnt signaling, resulting in differential mechanical responsiveness and consequent differences in bone modeling during growth. The absence of a material property QTL at this site supports the putative mechanism, which involves changes in bone size but not intrinsic tissue-level mechanical performance. The absence of a tissue-level QTL on chromosome 4 once again highlights that BMD reflects only a subset of biomechanical properties.
A QTL’s LOD score is a function of three different properties of an experiment. First among these is the inherent strength of the genetic contribution to the observed phenotypic differences. Large phenotypic differences between the parental strains and restriction of the segregating portion of the genome both contribute to increasing the probability that the underlying genetic contribution will be large. The second contributor is the distance between the marker loci and the mapped QTL, with large distances between markers and QTLs reducing LOD scores. In contemporary mouse experiments, it is possible to obtain virtual saturation of the genome with markers, so that marker spacing can largely be ignored when medium- to high-density genotyping is performed. The third determinant of linkage signal strength is the robustness of the phenotypes being mapped. Indeed, the performance characteristics of biomechanical testing outcomes are poorer than those of anatomical measurements of bones, and hence would be expected to yield lower LOD scores even if the inherent strength of the genetic signal was equal. Our mapping data reinforce earlier work assessing the reproducibility of biomechanical testing [37]. This work demonstrated that maximum load is the most robust property measured in 3-point bending of rodent bones, performing nearly twice as well as whole bone stiffness and approximately five times as well as energy to failure. By measuring all the phenotypes in both femora in each animal and using the average values for linkage mapping, we were able to partially overcome the poor reproducibility of 3-point bend testing. In our earlier report [19], we obtained the greatest LOD scores for bone size phenotypes, followed by strength phenotypes, and with the least robust LOD scores obtained for energy and displacement. In mapping the calculated tissue-level properties here, application of the standard beam equations revealed sufficiently large differences between the parental strains’ toughness for the QTL for toughness on chromosome 10 to be the single strongest linkage signal in this study in spite of the technical limitations of the test.
The HcB-8 and HcB-23 mechanical properties at the femur are consistent with those we earlier reported at the humerus [20, 21], with HcB-8 bones being smaller, less brittle, and having greater modulus and failure stress than HcB-23 bones. In that earlier work, we reported that FTIR-spectroscopy suggested that HcB-8 bones contain collagen with a higher proportion of mature collagen cross-links and more crystalline apatite than do HcB-23 bones, thus providing a possible chemical basis for the lesser brittleness and greater modulus of HcB-8 bones [20, 21]. The greater energy to failure and calculated fracture toughness of HcB-8 femora is at variance with Ritchie et al.’s assertion [38] that energy to failure calculated from 3 point bending tests of intact bones reflects the same properties as indices of strength. Were these authors correct, then there would be a high correlation between yield stress or maximum stress and toughness. This is not the case in our data, and the discrepancy is important biologically [39, 40]. Post-yield strain, not yield or maximum stress, is the dominant factor in determining toughness. However, we agree with those authors that such tests are less than ideal for measuring toughness, and that crack propagation experiments provide a theoretically better, but technically more challenging approach to the problem. In the context of a genetic mapping experiment, in which hundreds of animals must be studied, crack propagation is not feasible.
We report a strong inverse relationship between the femoral diaphyseal perimeter and its modulus, with R2 = 0.27. The mechanostat hypothesis [41, 42] postulates that strain is the physiological perturbation whose excursion is being limited by bone modeling. Strain can be reduced either by increasing a bone’s size, thus increasing its structural stiffness, or by increasing the tissue’s inherent stiffness, i.e. its modulus. The inverse relationship we observe is therefore fully consistent with the model, but does not allow us to determine which is the “primary” phenotype and which represents an adaptation to the primary phenotype. Jepsen and colleagues [40, 43, 44] have used the developmental trajectories of mouse femora to extract descriptive equations for the relationship between periosteal bone apposition and cortical thickness. These models provide an understanding of the adaptive range over which biologically optimized solutions to maintaining bone stiffness can occur, but are unable to provide insight into the cellular and molecular mechanisms that lead to varied growth trajectories. Rather, that understanding will require that the responsible genes and their variants be identified and their functions be elaborated.
The experiments reported here have important limitations that should be recognized. First, only ~1/4 of the genome is informative in the cross, thus limiting our ability to map genes that contribute to bone biomechanical performance to the chromosome segments where HcB-8 and HcB-23 harbor different alleles. Second, other mouse strains harbor additional alleles that contribute to variation in biomechanical performance. Third, 3-point bending and use of beam equations to calculate tissue-level biomechanical performance are each far from ideal [37, 45]. Beam equations systematically underestimate modulus, in part because bones do not satisfy the theory’s assumptions and in part because differences in cortical thickness affect apparent stiffness [45]). Indeed, these limitations may contribute to our failure to map any QTLs for Young’s modulus.
In summary, linkage mapping of tissue-level biomechanical performance in an intercross between HcB-8 and HcB-23 identifies QTLs that coincide with those for whole bone biomechanics and femoral diaphyseal geometry. Notably absent, however, is evidence of linkage to chromosome 4, supporting our inference [19] that the chromosome 4 QTL acts primarily on bone size. Our data support the existence of a reciprocal relationship between bone size and Young’s modulus, reflecting homeostatic regulation of strain, as predicted by the mechanostat hypothesis. Given the known association of bone size and BMD with biomechanical performance, our data mapping tissue-level biomechanical QTLs represent a step toward identifying the genetic basis of bone quality.
Acknowledgments
This material is based upon work supported by the Office of Research and Development, Biomedical Laboratory R&D Service, Department of Veterans Affairs (RDB) and performed in the Geriatrics Research, Education, and Clinical Center at the William S. Middleton Memorial Veterans Hospital. This report is Madison GRECC manuscript 2009–11. This work is also supported in part by NIH grant AR-54753 (RDB).
Footnotes
Publisher's Disclaimer: This is a PDF file of an unedited manuscript that has been accepted for publication. As a service to our customers we are providing this early version of the manuscript. The manuscript will undergo copyediting, typesetting, and review of the resulting proof before it is published in its final citable form. Please note that during the production process errors may be discovered which could affect the content, and all legal disclaimers that apply to the journal pertain.
Literature Cited
- 1.Harvey N, Earl S, Cooper C. Epidemiology of Osteoporotic Fractures. In: Favus MJ, editor. Primer on the Metabolic Bone Diseases and Disorders of Mineral Metabolism. Washington, D.C: American Society for Bone and Mineral Research; 2006. pp. 244–248. [Google Scholar]
- 2.Cummings SR. Treatable and untreatable risk factors for hip fracture. Bone. 1996;18:165S–167S. doi: 10.1016/8756-3282(95)00505-6. [DOI] [PubMed] [Google Scholar]
- 3.Kanis JA, Oden A, Johnell O, Johansson H, De Laet C, Brown J, Burckhardt P, Cooper C, Christiansen C, Cummings S, Eisman JA, Fujiwara S, Gluer C, Goltzman D, Hans D, Krieg MA, La Croix A, McCloskey E, Mellstrom D, Melton LJ, 3rd, Pols H, Reeve J, Sanders K, Schott AM, Silman A, Torgerson D, van Staa T, Watts NB, Yoshimura N. The use of clinical risk factors enhances the performance of BMD in the prediction of hip and osteoporotic fractures in men and women. Osteoporos Int. 2007;18:1033–46. doi: 10.1007/s00198-007-0343-y. [DOI] [PubMed] [Google Scholar]
- 4.Ralston SH. Genetics of osteoporosis. Proc Nutr Soc. 2007;66:158–65. doi: 10.1017/S002966510700540X. [DOI] [PubMed] [Google Scholar]
- 5.Williams FM, Spector TD. Recent advances in the genetics of osteoporosis. J Musculoskelet Neuronal Interact. 2006;6:27–35. [PubMed] [Google Scholar]
- 6.Eisman JA. Genetics of Osteoporosis. In: Favus MJ, editor. Primer on the Metabolic Bone Diseases and Disorders of Mineral Metabolism. Washington, D.C: American Society for Bone and Mineral Research; 2006. pp. 249–254. [Google Scholar]
- 7.Li X, Masinde G, Gu W, Wergedal J, Mohan S, Baylink DJ. Genetic dissection of femur breaking strength in a large population (MRL/MpJ x SJL/J) of F2 Mice: single QTL effects, epistasis, and pleiotropy. Genomics. 2002;79:734–40. doi: 10.1006/geno.2002.6760. [DOI] [PubMed] [Google Scholar]
- 8.Koller DL, Schriefer J, Sun Q, Shultz KL, Donahue LR, Rosen CJ, Foroud T, Beamer WG, Turner CH. Genetic effects for femoral biomechanics, structure, and density in C57BL/6J and C3H/HeJ inbred mouse strains. J Bone Miner Res. 2003;18:1758–65. doi: 10.1359/jbmr.2003.18.10.1758. [DOI] [PubMed] [Google Scholar]
- 9.Wergedal JE, Ackert-Bicknell CL, Tsaih SW, Sheng MH, Li R, Mohan S, Beamer WG, Churchill GA, Baylink DJ. Femur mechanical properties in the F2 progeny of an NZB/B1NJ x RF/J cross are regulated predominantly by genetic loci that regulate bone geometry. J Bone Miner Res. 2006;21:1256–66. doi: 10.1359/jbmr.060510. [DOI] [PubMed] [Google Scholar]
- 10.Lang DH, Sharkey NA, Mack HA, Vogler GP, Vandenbergh DJ, Blizard DA, Stout JT, McClearn GE. Quantitative trait loci analysis of structural and material skeletal phenotypes in C57BL/6J and DBA/2 second-generation and recombinant inbred mice. J Bone Miner Res. 2005;20:88–99. doi: 10.1359/JBMR.041001. [DOI] [PMC free article] [PubMed] [Google Scholar]
- 11.Volkman SK, Galecki AT, Burke DT, Miller RA, Goldstein SA. Quantitative trait loci that modulate femoral mechanical properties in a genetically heterogeneous mouse population. J Bone Miner Res. 2004;19:1497–505. doi: 10.1359/JBMR.040506. [DOI] [PubMed] [Google Scholar]
- 12.Li X, Masinde G, Gu W, Wergedal J, Hamilton-Ulland M, Xu S, Mohan S, Baylink DJ. Chromosomal regions harboring genes for the work to femur failure in mice. Funct Integr Genomics. 2002;1:367–74. doi: 10.1007/s10142-001-0045-z. [DOI] [PubMed] [Google Scholar]
- 13.Jiao Y, Chiu H, Fan Z, Jiao F, Eckstein EC, Beamer WG, Gu W. Quantitative trait loci that determine mouse tibial nanoindentation properties in an F2 population derived from C57BL/6J × C3H/HeJ. Calcif Tissue Int. 2007;80:383–90. doi: 10.1007/s00223-007-9030-4. [DOI] [PubMed] [Google Scholar]
- 14.Alam I, Sun Q, Liu L, Koller DL, Fishburn T, Carr LG, Econs MJ, Foroud T, Turner CH. Identification of a quantitative trait locus on rat chromosome 4 that is strongly linked to femoral neck structure and strength. Bone. 2006;39:93–9. doi: 10.1016/j.bone.2005.12.009. [DOI] [PubMed] [Google Scholar]
- 15.Alam I, Sun Q, Liu L, Koller DL, Liu Y, Edenberg HJ, Econs MJ, Foroud T, Turner CH. Genomic expression analysis of rat chromosome 4 for skeletal traits at femoral neck. Physiol Genomics. 2008;35:191–6. doi: 10.1152/physiolgenomics.90237.2008. [DOI] [PMC free article] [PubMed] [Google Scholar]
- 16.Alam I, Sun Q, Liu L, Koller DL, Fishburn T, Carr LG, Econs MJ, Foroud T, Turner CH. Whole-genome scan for linkage to bone strength and structure in inbred Fischer 344 and Lewis rats. J Bone Miner Res. 2005;20:1589–96. doi: 10.1359/JBMR.050512. [DOI] [PubMed] [Google Scholar]
- 17.Alam I, Sun Q, Liu L, Koller DL, Carr LG, Econs MJ, Foroud T, Turner CH. Sex-specific genetic loci for femoral neck bone mass and strength identified in inbred COP and DA rats. J Bone Miner Res. 2008;23:850–9. doi: 10.1359/JBMR.080221. [DOI] [PMC free article] [PubMed] [Google Scholar]
- 18.Turner CH, Burr DB. Basic biomechanical measurements of bone: a tutorial. Bone. 1993;14:595–608. doi: 10.1016/8756-3282(93)90081-k. [DOI] [PubMed] [Google Scholar]
- 19.Saless N, Litscher SJ, Lopez Franco GE, Houlihan MJ, Sudhakaran S, Raheem KA, O’Neil TK, Vanderby R, Demant P, Blank RD. Quantitative trait loci for biomechanical performance and femoral geometry in an intercross of recombinant congenic mice: restriction of the Bmd7 candidate interval. Faseb J. 2009;23:2142–54. doi: 10.1096/fj.08-118679. [DOI] [PubMed] [Google Scholar]
- 20.Yershov Y, Baldini TH, Villagomez S, Young T, Martin ML, Bockman RS, Peterson MG, Blank RD. Bone strength and related traits in HcB/Dem recombinant congenic mice. J Bone Miner Res. 2001;16:992–1003. doi: 10.1359/jbmr.2001.16.6.992. [DOI] [PubMed] [Google Scholar]
- 21.Blank RD, Baldini TH, Kaufman M, Bailey S, Gupta R, Yershov Y, Boskey AL, Coppersmith SN, Demant P, Paschalis EP. Spectroscopically determined collagen Pyr/deH-DHLNL cross-link ratio and crystallinity indices differ markedly in recombinant congenic mice with divergent calculated bone tissue strength. Connect Tissue Res. 2003;44:134–42. doi: 10.1080/03008200390223918. [DOI] [PubMed] [Google Scholar]
- 22.Demant P, Hart AA. Recombinant congenic strains--a new tool for analyzing genetic traits determined by more than one gene. Immunogenetics. 1986;24:416–22. doi: 10.1007/BF00377961. [DOI] [PubMed] [Google Scholar]
- 23.Beamer WG, Donahue LR, Rosen CJ, Baylink DJ. Genetic variability in adult bone density among inbred strains of mice. Bone. 1996;18:397–403. doi: 10.1016/8756-3282(96)00047-6. [DOI] [PubMed] [Google Scholar]
- 24.Lopez Franco GE, O’Neil TK, Litscher SJ, Urban-Piette M, Blank RD. Accuracy and precision of PIXImus densitometry for ex vivo mouse long bones: comparison of technique and software version. J Clin Densitom. 2004;7:326–33. doi: 10.1385/jcd:7:3:326. [DOI] [PubMed] [Google Scholar]
- 25.Stassen AP, Groot PC, Eppig JT, Demant P. Genetic composition of the recombinant congenic strains. Mamm Genome. 1996;7:55–8. doi: 10.1007/s003359900013. [DOI] [PubMed] [Google Scholar]
- 26.Eppig JT, Blake JA, Bult CJ, Kadin JA, Richardson JE. The mouse genome database (MGD): new features facilitating a model system. Nucleic Acids Res. 2007;35:D630–7. doi: 10.1093/nar/gkl940. [DOI] [PMC free article] [PubMed] [Google Scholar]
- 27.Lander ES, Botstein D. Mapping mendelian factors underlying quantitative traits using RFLP linkage maps [published erratum appears in Genetics 1994 Feb;136(2):705] Genetics. 1989;121:185–99. doi: 10.1093/genetics/121.1.185. [DOI] [PMC free article] [PubMed] [Google Scholar]
- 28.Broman KW, Wu H, Sen S, Churchill GA. R/qtl: QTL mapping in experimental crosses. Bioinformatics. 2003;19:889–90. doi: 10.1093/bioinformatics/btg112. [DOI] [PubMed] [Google Scholar]
- 29.Haley CS, Knott SA. A simple regression method for mapping quantitative trait loci in line crosses using flanking markers. Heredity. 1992;69:315–24. doi: 10.1038/hdy.1992.131. [DOI] [PubMed] [Google Scholar]
- 30.Zeng ZB. Precision mapping of quantitative trait loci. Genetics. 1994;136:1457–68. doi: 10.1093/genetics/136.4.1457. [DOI] [PMC free article] [PubMed] [Google Scholar]
- 31.Jiang C, Zeng ZB. Multiple trait analysis of genetic mapping for quantitative trait loci. Genetics. 1995;140:1111–27. doi: 10.1093/genetics/140.3.1111. [DOI] [PMC free article] [PubMed] [Google Scholar]
- 32.Basten CJ, Weir BS, Zeng Z-B. Zmap- a QTL Cartographer. In: Smith C, Gavora JS, Benkel B, Chesnais J, Fairfull W, Gibson JP, Kennedy BW, Burnside EB, editors. 5th World Conference on Genetics Applied to Livestock Production: Computing Strategies and Software. Vol. 22. Guelph; Ontario: 1994. pp. 65–66. [Google Scholar]
- 33.Basten CJ, Weir BS, Zeng Z-B. QTL Cartographer. Raleigh, NC: North Carolina State University; 1999. [Google Scholar]
- 34.Ishimori N, Stylianou IM, Korstanje R, Marion MA, Li R, Donahue LR, Rosen CJ, Beamer WG, Paigen B, Churchill GA. Quantitative Trait Loci for Bone Mineral Density in an SM/J by NZB/BlNJ Intercross Population and Identification of Trps1 as a Probable Candidate Gene. J Bone Miner Res. 2008 doi: 10.1359/JBMR.080414. [DOI] [PMC free article] [PubMed] [Google Scholar]
- 35.Churchill GA, Doerge RW. Empirical threshold values for quantitative trait mapping. Genetics. 1994;138:963–71. doi: 10.1093/genetics/138.3.963. [DOI] [PMC free article] [PubMed] [Google Scholar]
- 36.Darvasi A. Experimental strategies for the genetic dissection of complex traits in animal models. Nat Genet. 1998;18:19–24. doi: 10.1038/ng0198-19. [DOI] [PubMed] [Google Scholar]
- 37.Leppanen OV, Sievanen H, Jarvinen TL. Biomechanical testing in experimental bone interventions--May the power be with you. J Biomech. 2008;41:1623–31. doi: 10.1016/j.jbiomech.2008.03.017. [DOI] [PubMed] [Google Scholar]
- 38.Ritchie RO, Koester KJ, Ionova S, Yao W, Lane NE, Ager JW., 3rd Measurement of the toughness of bone: a tutorial with special reference to small animal studies. Bone. 2008;43:798–812. doi: 10.1016/j.bone.2008.04.027. [DOI] [PMC free article] [PubMed] [Google Scholar]
- 39.Jepsen KJ, Goldstein SA, Kuhn JL, Schaffler MB, Bonadio J. Type-I collagen mutation compromises the post-yield behavior of Mov13 long bone. J Orthop Res. 1996;14:493–9. doi: 10.1002/jor.1100140320. [DOI] [PubMed] [Google Scholar]
- 40.Jepsen KJ, Hu B, Tommasini SM, Courtland HW, Price C, Terranova CJ, Nadeau JH. Genetic randomization reveals functional relationships among morphologic and tissue-quality traits that contribute to bone strength and fragility. Mamm Genome. 2007;18:492–507. doi: 10.1007/s00335-007-9017-5. [DOI] [PMC free article] [PubMed] [Google Scholar]
- 41.Frost HM. The Utah paradigm of skeletal physiology: an overview of its insights for bone, cartilage and collagenous tissue organs. J Bone Miner Metab. 2000;18:305–16. doi: 10.1007/s007740070001. [DOI] [PubMed] [Google Scholar]
- 42.Frost HM. From Wolff’s law to the Utah paradigm: insights about bone physiology and its clinical applications. Anat Rec. 2001;262:398–419. doi: 10.1002/ar.1049. [DOI] [PubMed] [Google Scholar]
- 43.Price C, Herman BC, Lufkin T, Goldman HM, Jepsen KJ. Genetic variation in bone growth patterns defines adult mouse bone fragility. J Bone Miner Res. 2005;20:1983–91. doi: 10.1359/JBMR.050707. [DOI] [PubMed] [Google Scholar]
- 44.Jepsen KJ, Hu B, Tommasini SM, Courtland HW, Price C, Cordova M, Nadeau JH. Phenotypic integration of skeletal traits during growth buffers genetic variants affecting the slenderness of femora in inbred mouse strains. Mamm Genome. 2009;20:21–33. doi: 10.1007/s00335-008-9158-1. [DOI] [PMC free article] [PubMed] [Google Scholar]
- 45.van Lenthe GH, Voide R, Boyd SK, Muller R. Tissue modulus calculated from beam theory is biased by bone size and geometry: implications for the use of three-point bending tests to determine bone tissue modulus. Bone. 2008;43:717–23. doi: 10.1016/j.bone.2008.06.008. [DOI] [PubMed] [Google Scholar]


