Abstract
Bone is an amazing material evolved by nature to elegantly balance structural and metabolic needs in the body. Bone health is an integral part of overall health, but our lack of understanding of the ultrastructure of healthy bone precludes us from knowing how disease may impact nanoscale properties in this biological material. Here, we show that quantitative assessments of a distribution of Type I collagen fibril morphologies can be made using atomic force microscopy (AFM). We demonstrate that normal bone contains a distribution of collagen fibril morphologies and that changes in this distribution can be directly related to disease state. Specifically, by monitoring changes in the collagen fibril distribution of sham-operated and estrogen-depleted sheep, we have shown the ability to detect estrogen-deficiency-induced changes in Type I collagen in bone. This discovery provides new insight into the ultrastructure of bone as a tissue and the role of material structure in bone disease. The observation offers the possibility of a much-needed in vitro procedure to complement the current methods used to diagnose osteoporosis and other bone disease.
Keywords: AFM, Ultrastructure, Nanoscale, 2D FFT, Disease Diagnosis
Introduction
Bone is an exquisitely evolved biological material with a complex hierarchical structure. At its most fundamental level, bone is a two-phase composite composed of a relatively soft and ductile collagen matrix which is impregnated with and surrounded by a much stiffer, stronger reinforcing carbonated apatite phase. Despite the importance of bone health to overall health, there is a critical lack of knowledge regarding the ultrastructure of bone and how mineral and collagen, and their interaction with one another, relate to clinically-relevant tissue-level and structural-level properties (1,2). Disease, nutrition, trauma and mechanical loads can impact bone at multiple levels of the tissue hierarchy, including the tissue ultrastructure. It is therefore imperative to develop quantitative methods to assess the ultrastructure in bone and other tissues.
Type I collagen is the most abundant protein in the body and forms the structural scaffolding upon which bone is built. The need for accurate quantitative analytical methods to assess collagen’s nanoscale morphology and mechanical integrity with as little disruption to the tissue as possible has prompted us to study the collagen ultrastructure of bone using atomic force microscopy (AFM). Other methods successfully used to image the collagen ultrastructure of bone (e.g. transmission and scanning electron microscopy (3,4)) require the removal of the sample from its natural surroundings followed by harsh preparation techniques including full dehydration and ultra-high vacuum, which may induce artifacts and ultimately reduce one’s ability to draw accurate conclusions from the data (5). By way of comparison, AFM is a less-destructive high-resolution imaging modality which requires less sample preparation (6). Samples imaged using AFM can remain intact, implying that measured properties are characteristics of the sample and less likely artifacts of the processing or imaging. Other investigators have utilized AFM to image the collagen matrix in mineralized dentin (5) and bone (7-9) yielding high resolution images. However, previous studies did not perform quantitative analyses of the bone ultrastructure to increase our understanding of the tissue morphology at this fundamental level of organization. We hypothesized that by using AFM, we could image and quantitatively analyze the morphology of collagen fibrils in fully intact and mineralized bone to learn more about the normal nanoscale properties of this material.
Although many diseases affect bone through changes in mineral and the organic matrix, osteoporosis is the most common bone disease and is a major medical and economic burden facing our society. Each year, an estimated 1.5 million Americans suffer an osteoporotic fracture resulting in direct-care expenditures of 18 billion dollars a year and often leading to a downward spiral in quality of life or even death (10). An estimated 10 million Americans over the age of 50 have osteoporosis, and another 34 million are considered at risk. On a more global scale, 75 million people in the US, Europe and Japan combined have osteoporosis (11), and as many as 9 million osteoporotic fractures were reported worldwide in the year 2000 (12). A combination of the aging population coupled with a lack of knowledge concerning the material mechanism of the disease and less than ideal diagnostic tools means that the number of osteoporotic hip fractures in the United States could triple by the year 2040 (10).
Clinically, osteoporosis is defined as a person having a bone mineral density (BMD) that is 2.5 standard deviations below the peak bone mass of the average healthy person of the same gender, as measured by dual-energy x-ray absorptiometry (DEXA) (13). Although popular and widely used, DEXA has several limitations. Most significantly, standard DEXA uses a two-dimensional projection to measure areal BMD (g/cm2) versus true volumetric BMD (g/cm3). This two dimensional measurement is therefore dependent on the size and shape of the measured bone and can underestimate true BMD (14). Regardless of the method used to measure BMD, estimating fracture risk based solely on BMD is not sufficient. Normal BMD does not guarantee protection from osteoporotic fracture, and many cases of osteoporosis do not become clinically evident until fracture occurs (14,15).
Current diagnostic methods for osteoporosis focus exclusively on bone quantity and mineral content, disregarding the important role that collagen plays in bone health. We therefore hypothesized that by analyzing bone samples from sham-operated and estrogen-depleted animals using the AFM methods developed to analyze the collagen fibril morphology of normal bone, we could distinguish between healthy bone and bone from animals with a known disease state. This important observation could have significant implications to understanding disease mechanism, and could provide a complementary in vitro diagnostic technique which may lead to earlier disease detection.
Materials and Methods
Animals
Mice from the C3H/He background strain were used with prior approval (University of Michigan, UCUCA protocol #8518). Five male mice were sacrificed at 11 weeks of age by CO2 inhalation. The right femur from each mouse was harvested and the proximal (above the third trochanter) and distal ends were removed using a low-speed sectioning saw (South Bay Technology, Model 650; San Clemente, CA) with a diamond wafering blade (Mager Scientific) leaving approximately 7 mm of compact bone of the diaphysis. The marrow cavity of each bone was cleaned using a small tube brush.
Five year-old Columbia-Ramboulliet cross sheep were anesthetized and ovariectomized (OVX, n=3) or subjected to a sham surgery (n=3) [Colorado State University, ACUC # 03-010A-02]. After 2 years, the ewes were sacrificed with an intravenous overdose of a barbiturate, and 2 beams approximately 1.75 mm × 1.75 mm × 9 mm were removed from the mid-diaphysis of the left radius as previously described (16).
Atomic Force Microscopy (AFM) imaging and analysis
Bones were mounted to a steel disk using a thin layer of cyanoacrylate glue (mouse bones were posterior-side down). A flat polished surface was created using a 3 μm polycrystalline water-based diamond suspension and a 0.05 μm deagglomerated alumina suspension (Buehler LTD; Lake Bluff, Il). The bones were sonicated for 15 seconds to remove polishing residue and debris. To remove extrafibrillar surface mineral and expose underlying collagen fibrils, each bone was demineralized using 0.5M EDTA at a pH of 8.0 for up to 45 minutes (mouse bones only required 5 minutes of treatment), then vigorously rinsed with ultrapure water and soaked at 4°C for at least 16 hours. EDTA is often used in bone research to remove mineral while keeping collagen and cells intact and viable (17,18). This slow and “gentle” demineralization technique was used in the current study and allowed us to maintain the integrity of the native collagen structure along with the intrafibrillar mineral (19). Before imaging, the sample was briefly sonicated to remove any surface bound mineral.
Samples were imaged in air using a PicoPlus 5500 AFM (Agilent, formerly Molecular Imaging). Images were acquired in tapping mode using a silicon cantilever with tip radius <10 nm (VistaProbes T300R, force constant 40 N/m, resonance frequency 300 kHz, length 125 μm; nanoScience Instruments; Phoenix, AZ) at line scan rates of 2 Hz or lower at 512 lines per frame.
Making absolute x-y distance measurements with AFM has multiple limitations. Prior to sampling, calibration of the system was performed according manufacturer guidelines. A calibration grating with a 10 μm period was imaged with the scan size set just under the range of the piezo (80 μm scan size) at 512 pixels by 512 pixels. This results in a pixel size of roughly 160 nm. To overcome limitations imposed by pixel size, multiple consecutive periods were measured. The measured period was defined as the total measured length divided by the number of periods. The calibration was adjusted until the measured period was within 50 nm of the actual 10 m period. This calibration method results in a maximum error of 0.50%, which is less than the 1% tolerance specified by the manufacturer. For the imaging of collagen fibrils, scan sizes were reduced to 3.5 μm at 512 × 512 pixels. Because of the effective linearity of the piezo, error scales with the reduction of scan size reducing the 50 nm tolerance to 2.2 nm.
Image Analysis
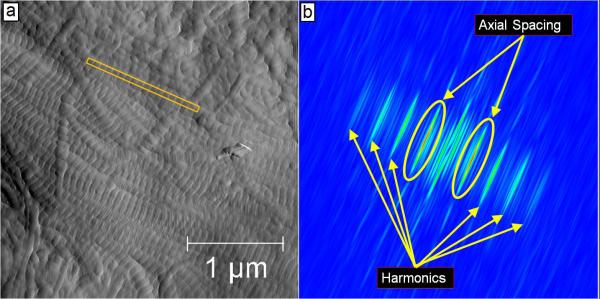
Images were acquired from at least 3 axial locations in each sample. At each location, 3.5 μm × 3.5 μm amplitude (error) images were analyzed without leveling to investigate the D-periodic axial gap/overlap spacing, chosen as our key metric of fibril morphology. Ten fibrils from each axial location were analyzed (SPIP v4.8.2, Image Metrology; Hørsholm, Denmark). Following image capture, a rectangular region of interest (ROI) was chosen along straight segments of individual fibrils (Figure 1). The ROI was drawn to ensure that it started and ended at the edge of a gap zone, a method which minimizes edge effects that can degrade resolution. For each evaluated fibril, a two dimensional Fast Fourier Transform (2D FFT) was performed and the primary peak from the 2D power spectrum was analyzed to determine the value of the D-periodic gap/overlap spacing. This process decouples the measured D-Period repeat distance from both pixel size and fibril orientation. A detailed analysis of the uncertainty associated with this type of measurement in fibrils from the current study demonstrated that using at least 9 D-period repeats sets the minimum bin size for population studies at 0.8 nm (In preparation; B.E., J.W., C.L, B.O., M.M.BH). For all histograms, the bin size was therefore set at 1 nm.
Figure 1. Schematic of Two Dimensional Fast Fourier Transform Measurements in Mineralized Bone.
Panel a shows a representative 3.5 μm × 3.5 μm amplitude (error) image that was used to measure the collagen fibril axial D-periodicity. The yellow box represents a fibril that was chosen for measurement. Panel b shows the corresponding 2D FFT from this fibril. As indicated, the 2D spectrum contains information about the harmonic characteristics of the fibril. The circled peaks are the first harmonic in the spectrum. The maximum value in this peak corresponds to the axial repeat distance of the fibril (in this case, 68 nm).
Statistical Analysis
All statistical analyses utilized SPSS (Version 16.0, SPSS Inc.). For all investigations, a value of p<0.05 was considered significant. To investigate differences in fibril morphology between species and due to estrogen deficiency, D-periodic axial spacing values measured from an individual sample were pooled, yielding an average value for that sample. The values from mice (n=5), sham sheep (n=6) and OVX sheep (n=5) were then compared using One Way ANOVA with posthoc Bonferroni tests.
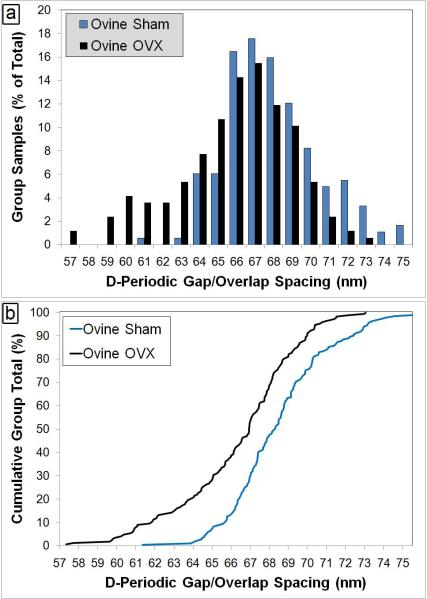
To examine differences in the distribution of fibril morphology between sham and OVX groups, the Cumulative Distribution Function (CDF) of each group was computed. The CDF shows what fraction of a given sample is contained up to a particular value, easily demonstrating differences between distributions in both mean and standard deviation. In Figure 5b, Cumulative Group Total (%) is used on the y-axis to make it clear that the CDF is a percentage within each group up to each spacing value. To test for statistical significance between distributions, Kolmogorov-Smirnov (K-S) tests were then applied to the data. This test is sensitive to changes in both the mean value and standard deviation of a distribution.
Figure 5. Axial D-Periodic Gap/Overlap Spacings from Ovine Radii.
Panel a shows the histogram representation of the axial gap/overlap spacing from sham operated sheep and ovariectomized (OVX) sheep. When the axial gap/overlap spacings from all fibrils are viewed as histograms with a 1 nm bin size, there is a population of fibril spacings in the OVX sheep at 64 nm or below that is almost completely absent from the Sham sheep. Panel b displays the Cumulative Density Function (CDF) calculated from each population. The CDF shows what fraction of a given sample is contained up to a particular value. A Kolmogorov-Smirnov (K-S) test performed on the two groups indicates that there is a significant difference in the population distributions of the two groups (p<0.001).
Results
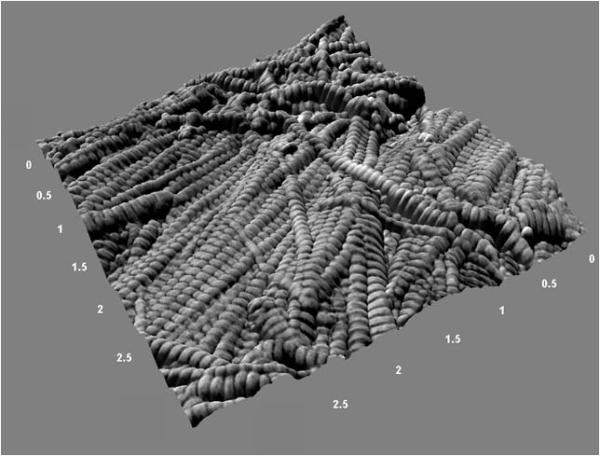
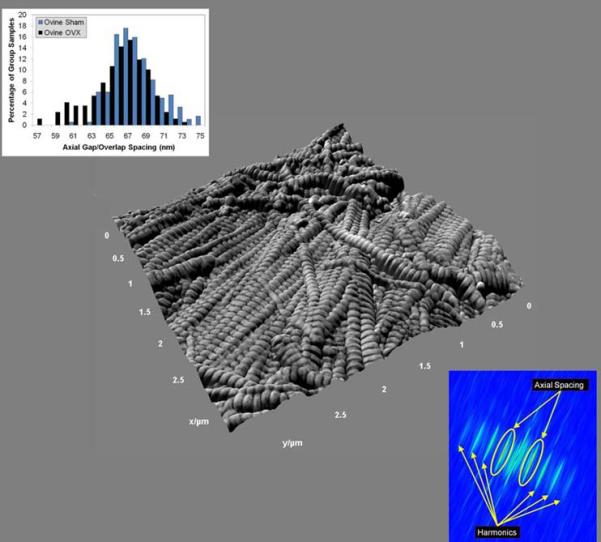
To quantitatively assess the axial gap/overlap spacing in murine cortical bone as a baseline, femora from 11 week old male mice of the C3H/He background strain were used. In the intracortical bone along the anterior surface of the diaphysis, 3 axial locations were analyzed. At each axial location, a 10 μm × 10 μm scan was performed to find suitable sites for closer inspection. Figure 2 shows a representative 3D rendering of a bone surface displaying bundles of well-oriented fibrils surrounded by less organized fibrils in a woven configuration. At least 10 fibrils were chosen in each axial location, yielding at least 30 measurements from each bone. In total, 193 fibrils were analyzed.
Figure 2. Three Dimensional Rendering of an Intracortical Region in the Murine Femur.
To produce this figure, a phase image was used as a texture overlay on the corresponding topography (height) image to produce a rendering of the surface. In this representative 3.5 μm × 3.5 μm image (150 nm height), the rich sample topography characteristic of bone is evident. A bundle of collagen fibrils is seen spanning the surface immediately adjacent to disorganized, woven collagen.
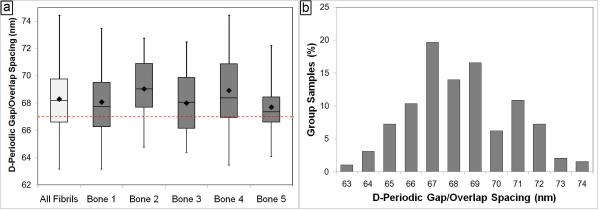
For each of the analyzed bones, the measurements within each bone were pooled to yield the mean fibril spacing for that bone. These mean values ranged from 67.7 nm to 69.0 nm (Figure 3a), with an overall mean axial spacing for all 5 bones of 68.3 ± 2.4 nm. The median value for all 193 measures of 68.2 nm was in good agreement with the mean. The dashed horizontal lines in Figures 3a and 4 are for reference and correspond to the 67 nm axial spacing that is predicted by the Hodge-Petruska model (20). As noted in the materials and methods section, the ability to measure absolute distances with AFM was limited by the ~2.2 nm tolerance set during the calibration of our system. Therefore, it is not possible to state that there is an absolute difference between the 68.3 nm mean in the mouse fibrils and the 67 nm value predicted by Hodge and Petruska. The histogram of all 193 fibrils shows that there is a distribution of spacings ranging from 63 nm to 74 nm (Figure 3b).
Figure 3. Axial D-Periodic Gap/Overlap Spacings from Murine Femora.
Panel a shows the boxplot representation of the axial gap/overlap spacing from each of the 5 femurs measured, as well as from all fibrils combined. The dashed horizontal line indicates the expected 67 nm repeat distance. For each sample, the box is the interquartile region (middle 50% of the data), the horizontal line inside of the box is the median, and the diamond is the mean. The whiskers on the box are the minimum and maximum observation in each group. When the axial gap/overlap spacings from all 193 fibrils are viewed as a histogram with a 1 nm bin size in panel b, there is a population of fibrils near the theoretical 67 nm value. However, the spacing of the fibrils has a distribution ranging from near 63 nm to 74 nm. This type of distribution is often overlooked, but may have important implications to the development of the anisotropic mechanical behavior of the bone tissue.
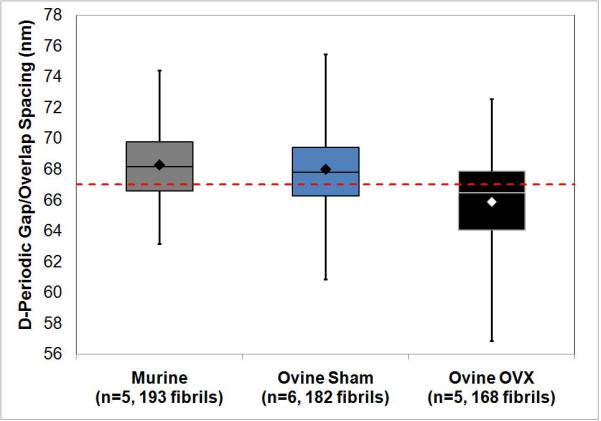
Figure 4. Axial D-Periodic Gap/Overlap Spacings from Murine Femora and Ovine Radii.
Figure 4 shows the boxplot representation of the axial gap/overlap spacing from mouse, sham operated sheep and ovariectomized (OVX) sheep. The dashed horizontal line indicates the theoretical 67 nm repeat distance. When the sham samples were compared to OVX by One Way ANOVA, there was a significant difference present (p=0.048).
Using a model of estrogen-depletion in sheep, it was hypothesized that it would be possible to distinguish between normal bone and bone from animals with a known disease state by monitoring changes in the distribution of collagen fibril morphologies. Samples from ovariectomized (OVX) and sham-operated sheep were processed as described in the materials and methods section. It was found that the fibrils from the sham sheep were similar in terms of mean (68.0 ± 2.6 nm) and distribution when statistically compared with mouse fibrils (Figure 4, p=1.00 for ANOVA, p=0.319 for KS test). However, comparison of sham samples (n= 6) to OVX samples (n=5) showed striking differences. The mean from the OVX samples was 65.9 ± 3.1 nm. When the mean values from Sham and OVX samples were compared by One-Way ANOVA, there was a significant effect of estrogen-depletion on the fibril spacing (p=0.048). When the fibrils in each group are viewed in histogram form, there are different populations of fibrils within the 2 groups (Figure 5). The bins which contain the main population of fibrils in each group were selected such that they contain the mean of the sham fibrils ± 1 standard deviation (65 nm to 71 nm). The sham bones had a population of fibrils (11.5% of total fibril measured) with spacings of 72 nm or greater which was almost completely absent from the OVX group (1.8%). Similarly, the OVX bones had a population of fibrils with spacings of 64 nm or less (28.0%) which was less prominent in the sham bones (7.1%). When compared using a K-S test, the CDFs from the groups was significantly different (p<0.001) indicating a significant difference in the population distributions of the groups (Figure 5b).
Discussion
Our data indicate that as opposed to a single value, normal bone contains a distribution of collagen fibril D-periodic axial gap/overlap spacings. This measure captures many aspects of the fibril hierarchy and can be related to the state of the individual triple helices, post-translational modifications and cross-linking. By monitoring this distribution in normal bone and bone from estrogen-depleted animals, we have demonstrated the ability to detect disease-induced differences in the Type I collagen ultrastructure of bone.
In this study, 2D FFTs were used to determine the value of the D-periodic gap/overlap spacing (Figure 1). At least one other study has used analysis by FFT to derive spacing data from AFM images of collagen (5). This previous study relied on the 1D FFT, a method which allows the user to determine the power spectrum of the wavelength component along a single line in an image. This method is dependent on the angular orientation of a line that is drawn on the collagen fibril by the user and can lead to errors in the measured spacing values. From our calculation, as little as a 5° deviation in the line that is drawn from the normal direction of the fibril spacing can alter the measured spacing by as much as 5 to 10%, depending on the measured length of the fibril. A 10% error on a measurement of a 67 nm fibril means that the spacing value could range from 60–74 nm, making it impossible to detect the type of changes in fibril morphology seen and discussed below. The combination of more accurate measures and the assessment of variability associated with those measures provide us with confidence that the values we obtain are true characteristics of the tissues being measured.
To quantitatively assess the Type I collagen morphology in murine compact bone as a baseline, femora from 11 week old male mice from the C3H/He background strain were used. The use of a specific age, gender and background strain of mouse guarantees that the known influence of these properties on skeletal structure and function were avoided (21-24). Further, by investigating multiple axial locations along the length of one type of bone, the effect of variations within and between bones was reduced. Figure 2 shows a representative 3D rendering of a bone surface displaying bundles of well-oriented fibrils surrounded by less organized fibrils in a woven configuration.
Using 2D FFT analyses, we found a distribution of spacings in normal murine bone ranging from 63 nm to 74 nm (Figure 3). Although the most commonly accepted value for this D-periodic spacing is 67 nm (as predicted by Hodge and Petruska (20)), this value is based on a theoretical model of a single collagen fibril in isolation. As mentioned above, the ability to accurately measure absolute distances using AFM is intrinsically limited by the calibration process. The error associated with these absolute measurements therefore reduces our ability to make a comparison of the absolute mean to the expected 67 nm value, as the difference between these values is within the error of the technique. However, the strength of this study is that a distribution of spacing values was present in normal tissue. This range of values is a real observation and is not impacted by the absolute error. The concept of a distribution is often overlooked in measurements of collagen, and the mean value is reported without explanation. For example, a study in dentin showed a distribution in fibril spacings, but reported that there was a “relatively narrow distribution” in the measurements around 67 nm (5). We hypothesize that although the mean value of the D-periodic spacing in a mineralized fibril is important, the distribution itself may have even greater significance. This distribution of fibril morphologies is found in wild type bone meaning that it is a fundamental property of normal tissue. The influences that a distribution of collagen morphologies (versus a single value) could have on the mechanical properties of the tissue are profound. Bone is a heterogeneous tissue with anisotropic mechanical properties. Given that a whole bone is typically under a complex loading state including tension, compression and shear, it is imperative that the structure as a whole be mechanically competent in multiple directions. The material itself is much more specialized, and the anisotropic tissue properties that contribute to overall mechanical competence begin at the most fundamental levels of the tissue hierarchy (25). It is likely that the distribution of fibril morphologies measured here is partially responsible.
Alterations in the distribution of fibril morphology in cases of disease may indicate flaws in the collagen fibrils from misalignment or over-modification of the individual collagen molecules within the fibrils, changes that could be compensated for over larger length scales. Using a model of estrogen-depletion in sheep, it was hypothesized that it would be possible to distinguish between normal bone and bone from animals with a known disease state by monitoring changes in this distribution. The fibrils from the sham sheep were similar in terms of mean and distribution compared with the normal mouse fibrils (Figure 4), verifying the utility of this method in different species. However, a comparison of sham sheep to OVX sheep showed striking differences both in terms of overall mean as well as in distribution (Figures 4 and 5). This ability to measure fibril morphology and to distinguish between normal and diseased bone not only provides a powerful method to study the mechanism of disease at the nanoscale, but it also has important implications to the future diagnosis of disease in bone, and perhaps other collagenous tissues (e.g. dentin, tendon, skin, ligament). The current gold-standard for diagnosis of osteoporosis focuses exclusively on BMD, as measured from a 2D DEXA projection, and is therefore dependent on bone size and shape. Further, using BMD to diagnose osteoporosis is problematic, as normal BMD does not guarantee protection from fracture and many osteoporosis cases do not become clinically evident until fracture occurs (14,15). The current study shows that measuring properties of the organic matrix may provide powerful complementary information to BMD, as changes in collagen may become apparent earlier in the progression of the disease. Although this method would currently require a biopsy, something that is a standard practice for the diagnosis of many bone diseases, the benefit of earlier diagnosis and treatment may outweigh the risk. Future work will be aimed at investigating changes in Type I Collagen morphology in cortical and trabecular locations from normal and osteoporotic human patients.
Although AFM requires less sample preparation than other high resolution imaging modalities (6), there is still the possibility of artifacts for sample preparation and imaging. Samples in the current study were imaged in air meaning that contraction of fibrils could occur from dehydration. However, most examples of contraction were observed using electron microscopy which fully dehydrates the tissue and requires ultra-high vacuum. In our experience imaging bone, dentin and tendon from multiple species and from normal and diseased animals, contraction of fibril spacing or the appearance of new fibril populations due to dehydration has never been observed (Wallace et al., Submitted). The collagen in bone is impregnated with and surrounded by mineral which must be removed. After 30 minutes of continuous treatment with 10% citric acid, intrafibrillar mineral is protected from demineralization (19). Further, treatment with EDTA removes extrafibrillar mineral while leaving the underlying collagen intact (9). EDTA can remove mineral while keeping cells and collagen intact and viable (18). Our mouse bones were only treated for ~5 minutes with EDTA while the sheep bones required up to 45 minutes. There were no differences in either mean spacing value or in the distribution of fibril morphologies between the mouse bones and the sham sheep bones. Further the comparison between bone, dentin (also mineralized) and tail tendon (not mineralized and, therefore, not treated with EDTA) showed no differences in mean fibril spacing (Wallace et al., Submitted). This comparison between samples which required sonication (bones and teeth) and samples which did not (tendons) further indicates that the effects of sonication were minimal. All samples in the current study were imaged under identical conditions and we are interested only in relative differences between groups. Therefore the differences seen here are likely true disease-induced changes in Type I collagen morphology.
In conclusion, the current study demonstrates the ability to utilize AFM imaging to make quantitative assessments of the distribution of collagen fibril morphologies in bone. It is clearly shown that normal bone contains a distribution of collagen fibril morphologies and that changes in this distribution can be directly related to disease state. Osteoporosis is a significant medical and economic burden facing our society and is projected to worsen with the aging population. Although more research on the causes of this disease is important, early diagnosis and treatment is imperative. Monitoring changes in the fibril morphology distribution as a function of disease not only increases our fundamental understanding of bone as a material, but also provides important insight into disease progression and offers the possibility of a much-needed in vitro procedure to complement the use of BMD for disease diagnosis.
Acknowledgements and Funding Sources
The authors would like to thank Dr. Nadder Sahar from the University of Michigan Department of Biomedical Engineering for help in developing the method used to polish bones in this study. The authors would also like to thank Drs. Jennifer M. MacLeay and A. Simon Turner of Colorado State University, and Dr. David P. Fyhrie of the University of California-Davis, for their contributions to the design and implementation of the in-vivo stages of the ovine study. Finally, the authors would like to thank Carola Pechey and Elisabeth Michels from Henry Ford Hospital for their contributions to sample preparation for the sheep studies.
This work was generously funded by the National Institute of Dental and Craniofacial Research (National Institutes of Health) through a Ruth L. Kirschstein National Service Award (Grant number 1F32DE018840-01 A1) and by the National Institute of Arthritis and Musculoskeletal and Skin Diseases (Grant number AR50562).
Footnotes
Publisher's Disclaimer: This is a PDF file of an unedited manuscript that has been accepted for publication. As a service to our customers we are providing this early version of the manuscript. The manuscript will undergo copyediting, typesetting, and review of the resulting proof before it is published in its final citable form. Please note that during the production process errors may be discovered which could affect the content, and all legal disclaimers that apply to the journal pertain.
REFERENCES
- [1].Gupta HS, Wagermaier W, Zickler GA, et al. Nanoscale deformation mechanisms in bone. Nano Lett. 2005;5:2108–11. doi: 10.1021/nl051584b. [DOI] [PubMed] [Google Scholar]
- [2].Fratzl P, Gupta HS, Paschalis EP, Roschger P. Structure and mechanical quality of the collagen-mineral nano-composite in bone. Journal of Materials Chemistry. 2004;14:2115–23. [Google Scholar]
- [3].Giraud-Guille MM. Twisted plywood architecture of collagen fibrils in human compact bone osteons. Calcif Tissue Int. 1988;42:167–80. doi: 10.1007/BF02556330. [DOI] [PubMed] [Google Scholar]
- [4].Weiner S, Arad T, Sabanay I, Traub W. Rotated plywood structure of primary lamellar bone in the rat: Orientations of the collagen fibril arrays. Bone. 1997;20:509–14. doi: 10.1016/s8756-3282(97)00053-7. [DOI] [PubMed] [Google Scholar]
- [5].Habelitz S, Balooch M, Marshall SJ, Balooch G, Marshall GW., Jr. In situ atomic force microscopy of partially demineralized human dentin collagen fibrils. J Struct Biol. 2002;138:227–36. doi: 10.1016/s1047-8477(02)00029-1. [DOI] [PubMed] [Google Scholar]
- [6].Morris VJ, Kirby AR, Gunning AP. Atomic force microscopy for biologists. Imperial College Press; Norwich, UK: 1999. [Google Scholar]
- [7].Hassenkam T, Fantner GE, Cutroni JA, Weaver JC, Morse DE, Hansma PK. High-resolution AFM imaging of intact and fractured trabecular bone. Bone. 2004;35:4–10. doi: 10.1016/j.bone.2004.02.024. [DOI] [PubMed] [Google Scholar]
- [8].Baranauskas V, Garavello-Freitas I, Jingguo Z, Cruz-Höfling MA. Observation of the bone matrix structure of intact and regenerative zones of tibias by atomic force microscopy. Journal of Vacuum Science & Technology A: Vacuum, Surfaces, and Films. 2001;19:1042. [Google Scholar]
- [9].Kindt JH, Thurner PJ, Lauer ME, et al. In situ observation of fluoride-ion-induced hydroxyapatite-collagen detachment on bone fracture surfaces by atomic force microscopy. Nanotechnology. 2007;18:135102. doi: 10.1088/0957-4484/18/13/135102. [DOI] [PubMed] [Google Scholar]
- [10].U.S. Department of Health and Human Services. Office of the Surgeon General . Bone health and osteoporosis: A report of the surgeon general. 2004. [PubMed] [Google Scholar]
- [11].Lindsay R, Christiansen C, Einhorn TA, Hart DM, Ljunghall S, Mautalen CA. Consensus development statement: Who are candidates for prevention and treatment for osteoporosis. Osteoporosis Int. 1997;7:1–6. [Google Scholar]
- [12].Johnell O, Kanis JA. An estimate of the worldwide prevalence and disability associated with osteoporotic fractures. Osteoporosis Int. 2006;17:1726–33. doi: 10.1007/s00198-006-0172-4. [DOI] [PubMed] [Google Scholar]
- [13].WHO Assessment of fracture risk and its application to screening for postmenopausal osteoporosis. report of a WHO study group. World Health Organ Tech Rep. 1994;843:1. [PubMed] [Google Scholar]
- [14].WHO . Prevention and management of osteoporosis: Report of a WHO scientific group. World Health Organization; Geneva: 2003. p. 192. [Google Scholar]
- [15].Heaney RP. Is the paradigm shifting? Bone. 2003;33:457–65. doi: 10.1016/s8756-3282(03)00236-9. [DOI] [PubMed] [Google Scholar]
- [16].Les CM, Spence CA, Vance JL, et al. Determinants of ovine compact bone viscoelastic properties: Effects of architecture, mineralization, and remodeling. Bone. 2004;35:729–38. doi: 10.1016/j.bone.2004.04.006. [DOI] [PubMed] [Google Scholar]
- [17].Jonsson R, Tarkowski A, Klareskog L. A demineralization procedure for immunohistopathological use. EDTA treatment preserves lymphoid cell surface antigens. J Immunol Methods. 1986;88:109–14. doi: 10.1016/0022-1759(86)90058-x. [DOI] [PubMed] [Google Scholar]
- [18].Klein-Nulend J, Burger EH, Semeins CM, Raisz LG, Pilbeam CC. Pulsating fluid flow stimulates prostaglandin release and inducible prostaglandin G/H synthase mRNA expression in primary mouse bone cells. J Bone Miner Res. 1997;12:45–51. doi: 10.1359/jbmr.1997.12.1.45. [DOI] [PubMed] [Google Scholar]
- [19].Balooch M, Habelitz S, Kinney JH, Marshall SJ, Marshall GW. Mechanical properties of mineralized collagen fibrils as influenced by demineralization. J Struct Biol. 2008;162:404–10. doi: 10.1016/j.jsb.2008.02.010. [DOI] [PMC free article] [PubMed] [Google Scholar]
- [20].Hodge AJ, Petruska JA. Recent Studies with the Electron Microscope on Ordered Aggregates of the Tropocollagen Molecule. In: Ramachandran GN, editor. Aspects of protein structure. Academic Press; New York: 1963. p. 289. [Google Scholar]
- [21].Beamer WG, Donahue LR, Rosen CJ, Baylink DJ. Genetic variability in adult bone density among inbred strains of mice. Bone. 1996;18:397–403. doi: 10.1016/8756-3282(96)00047-6. [DOI] [PubMed] [Google Scholar]
- [22].Ferguson VL, Ayers RA, Bateman TA, Simske SJ. Bone development and age-related bone loss in male C57BL/6J mice. Bone. 2003;33:387–98. doi: 10.1016/s8756-3282(03)00199-6. [DOI] [PubMed] [Google Scholar]
- [23].Wergedal JE, Sheng MH, Ackert-Bicknell CL, Beamer WG, Baylink DJ. Genetic variation in femur extrinsic strength in 29 different inbred strains of mice is dependent on variations in femur cross-sectional geometry and bone density. Bone. 2005;36:111–22. doi: 10.1016/j.bone.2004.09.012. [DOI] [PubMed] [Google Scholar]
- [24].Wallace JM, Rajachar RM, Chen XD, et al. The mechanical phenotype of biglycan-deficient mice is bone- and gender-specific. Bone. 2006;39:106–16. doi: 10.1016/j.bone.2005.12.081. [DOI] [PubMed] [Google Scholar]
- [25].Fan Z, Swadener JG, Rho JY, Roy ME, Pharr GM. Anisotropic properties of human tibial cortical bone as measured by nanoindentation. Journal of Orthopaedic Research. 2002;20:806–810. doi: 10.1016/S0736-0266(01)00186-3. [DOI] [PubMed] [Google Scholar]
- [26].Klein-Nulend J, Roelofsen J, Semeins CM, Bronckers AL, Burger EH. Mechanical stimulation of osteopontin mRNA expression and synthesis in bone cell cultures. J Cell Physiol. 1997;170:174–81. doi: 10.1002/(SICI)1097-4652(199702)170:2<174::AID-JCP9>3.0.CO;2-L. [DOI] [PubMed] [Google Scholar]


