Abstract
Motor and cognitive functions are severely impaired in Rett syndrome (RTT). Here, we examined local synaptic circuits of layer 2/3 (L2/3) pyramidal neurons in motor-frontal cortex of male hemizygous MeCP2-null mice at 3–4 weeks of age. We mapped local excitatory input to L2/3 neurons using glutamate uncaging and laser scanning photostimulation, and compared synaptic input maps recorded from MeCP2-null and wild type (WT) mice. Local excitatory input was significantly reduced in the mutants. The strongest phenotype was observed for lateral (horizontal, intralaminar) inputs, that is, L2/3→2/3 inputs, which showed a large reduction in MeCP2−/y animals. Neither the amount of local inhibitory input to these L2/3 pyramidal neurons nor their intrinsic electrophysiological properties differed by genotype. Our findings provide further evidence that excitatory networks are selectively reduced in RTT. We discuss our findings in the context of recently published parallel studies using selective MeCP2 knockdown in individual L2/3 neurons.
Keywords: MeCP2, Rett syndrome, cortical circuits, circuitopathy, laser scanning photostimulation, glutamate uncaging
Rett syndrome (RTT) (OMIM #312750), a severe neurodevelopmental disease with prominent motor and cognitive features, is caused by mutations in methyl-CpG-binding protein 2 (MeCP2) (Amir et al., 1999; Hagberg et al., 1983; Percy, 2002; Zoghbi, 2003). The availability of mouse models of RTT (Chen et al., 2001; Collins et al., 2004; Guy et al., 2001; Shahbazian et al., 2002) has made it possible to study the relationships between MeCP2, neural circuits, and the RTT neurological phenotype (Chahrour and Zoghbi, 2007; Cohen and Greenberg, 2008; Moretti and Zoghbi, 2006; Zoghbi, 2003). From these studies a picture has emerged that MeCP2 is critically involved in experience-dependent maturation and regulation of neuronal circuits (Cohen and Greenberg, 2008; Ramocki and Zoghbi, 2008).
Reduced excitatory synaptic transmission to cortical pyramidal neurons has been demonstrated using mouse models of RTT (Chao et al., 2007; Dani et al., 2005; Tropea et al., 2009). Recently, we explored how MeCP2 deficiency affects excitatory intracortical pathways in mouse cortex using an RNA-interference (RNAi) model system, in which a sparse subset of L2/3 pyramidal neurons was rendered MeCP2 deficient (Wood et al., 2009). We focused on circuits in motor-frontal (M1) cortex, both because of the motor-cognitive features of Rett syndrome and because basic excitatory circuits in this area in the mouse have recently been mapped (Weiler et al., 2008; Shepherd, 2009). The RNAi experiments revealed a specific reduction in ascending excitatory synaptic input from middle cortical layers (L3/5A→2/3 inputs), with no change in horizontal (L2/3→2/3) inputs or in local inhibitory inputs.
In the present study, we used the same general strategy (i.e., same slice preparation and mapping methods, with recordings targeted to L2/3 pyramidal neurons in motor-frontal cortex of 3–4 week old mice) as in the companion study (Wood et al., 2009), but here we used a RTT mutant mouse model instead of an RNAi-based model. This approach allowed us to survey the local excitatory network organization in this more widely used mutant model, and offered a relatively direct comparison between the circuit abnormalities observed for the two RTT model systems involving either sparse (Wood et al., 2009) or widespread (present study) MeCP2 deficiency.
MATERIALS AND METHODS
MeCP2−/y mice
Male wild type (WT) and hemizygous MeCP2−/y littermates were obtained from colonies of heterozygous mutant females and WT males (MeCP2tm1.1Bird, Jackson Laboratories) (Guy et al., 2001). Experiments involving MeCP2−/y mice were performed with the experimenter blind to genotype. Tail samples were collected at the time of recordings, and genotyped according to the vendor’s PCR protocol (http://jaxmice.jax.org). Primers were MeCP2-common (5′-ggT AAA gAC CCA TgT gAC CC-3), MeCP2 wild-type (5′-ggC TTg CCA CAT gAC AA-3′), and MeCP2-disrupted (5′-TCC ACC TAg CCT gCC TgT AC-3′) alleles (Integrated DNA Technologies). All animal studies were performed in accordance with Northwestern University and NIH guidelines.
Morphometry
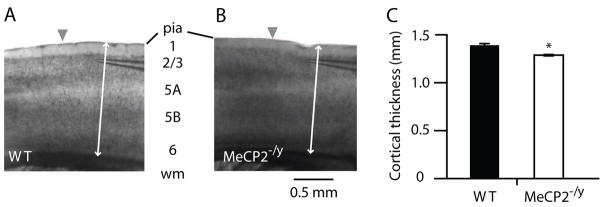
Cortical thickness was measured from video images of brain slices obtained at the time of electrophysiological recordings, as the distance from pia to the L6/white matter border. In the mouse, cortical thickness varies across different areas, from ~1.5 mm at the frontal pole to ~0.7 at the occipital pole. Therefore, this measurement was made at a standard horizontal location ~0.5 mm anterior to the M1-S1 border.
Electrophysiology and LSPS
We prepared brain slices and performed electrophysiological recordings and LSPS mapping as described previously (Weiler et al., 2008; Wood et al., 2009). Brains of three to four week old mice were blocked and mounted in chilled cutting solution (in mM: 110 choline chloride, 25 NaHCO3, 25 D-glucose, 11.6 sodium ascorbate, 7 MgSO4, 3.1 sodium pyruvate, 2.5 KCl, 1.25 NaH2PO4, and 0.5 CaCl2). Off-sagittal cortical slices, 0.3 mm in thickness, were cut by a tissue slicer (Microm), transferred to ACSF (in mM: 127 NaCl, 25 NaHCO3, 25 D-glucose, 2.5 KCl, 1 MgCl2, 2 CaCl2, and 1.25 NaH2PO4, aerated with 95% O2, 5% CO2), incubated for 30–45 minutes at 35 °C, and then stored at 22 °C before recording. Slices were transferred to the recording chamber of an LSPS-outfitted microscope and perfused with bath solution (standard ACSF with 4 mM Ca2+, 4 mM Mg2+, and 5 μM R-CPP to block NMDA-receptor currents; Tocris) containing MNI-caged glutamate (0.2 mM; Tocris) (Canepari et al., 2001). For excitatory recordings, patch pipettes contained potassium-based intracellular solution (in mM: 120 KMeSO3, 20 KCl, 4 NaCl, 10 HEPES, 1 EGTA, 4 Mg2ATP, and 0.3 Na2GTP, 14 Na-phosphocreatine, 3 ascorbate, 0.05 Alexa-594 hydrazide). Intrinsic properties were assessed as described previously (Wood et al., 2009). For inhibitory recordings, equimolar cesium was substituted for potassium, and 1 mM QX-314 was added.
For LSPS mapping, L2/3 pyramidal neurons were targeted for whole-cell recordings. Series resistance (Rs) was monitored throughout recordings. Only recordings with Rs <30 MΩ were included. On average, Rs did not differ by genotype (WT: 15 ± 1 MΩ; MeCP2−/y: 16 ± 2 MΩ). Photostimulus pulses were 1.0 msec in duration and 20 mW in power. Stimulus grids were dimensioned as 16-by-16 square arrays with 0.1 mm spacing. For each neuron the grid was centered horizontally over the soma, and aligned at the top edge with the pia. Excitatory (glutamatergic) responses were recorded at a command voltage of −70 mV. Inhibitory (GABAergic) responses were recorded at a command voltage of +10 mV, near the empirically determined reversal potential for excitatory currents. Ephus (freely available at http://openwiki.janelia.org), control software for electrophysiology and optical mapping, was used for all aspects of data acquisition.
Excitation profiles
To compare the resolution and intensity of stimulation of neurons in MeCP2−/y and WT animals, we acquired ‘excitation profiles,’ maps of the spike-generating sites of neurons. Recording and analysis of excitation profiles followed previously described methods (Shepherd et al., 2003; Shepherd and Svoboda, 2005; Weiler et al., 2008). Loose-seal recordings were made from L2/3 or L3/5A pyramidal neurons with the amplifier in voltage-follower mode, using ACSF-filled pipettes; recording conditions were otherwise identical to those used to record LSPS input maps. The stimulus parameters were the same as for LSPS mapping, except that we used 8-by-8 stimulus grids with 50 μm spacing and a 1.0 second inter-stimulus interval. Excitation profiles were analyzed to determine the mean weighted distance of spike-generating spikes from the soma, an estimator of the spatial resolution of photostimulation, and the total number of spikes generated per excitation profile (i.e,. per neuron), an estimator of the intensity of neuronal photostimulation. To facilitate comparison with other studies in which different grid spacing was used, the latter parameter was normalized by multiplying it with the spacing of grid rows and columns. For example, for a 10-spike excitation profile, the normalized value would be 10 spikes × 0.05 mm × 0.05 mm = 0.0025 spikes mm2.
Map analysis
Detailed methods have been published (Weiler et al., 2008; Wood et al., 2009; Yu et al., 2008). Briefly, we converted LSPS traces to pixel values representing the average post-synaptic current by averaging over a 50 msec post-stimulus time window. Perisomatic sites, where the recorded neuron’s dendrites were directly stimulated, were excluded from analysis based on a latency criterion (onset latency <7 msec) (Schubert et al., 2001).
Normalizing synaptic input for presynaptic photoexcitability
In some analyses (as noted), input data were normalized for presynaptic photoexcitability. Although the average ratio could be obtained simply by dividing mean input by mean photoexcitability, the variance in this ratio could not be determined directly because the two measurements were made separately. Instead, we used a resampling algorithm to estimate the error in the input/photoexcitability ratio.
First, we analyzed the synaptic input maps to determine the mean input in a region of interest (ROI). For analysis of ascending inputs from L3/5A, the ROI included map rows 6–8 and columns 6–11; for analysis of horizontal inputs, it included rows 3–5 and columns 4–13. This set of values was provided (as a vector, equal in length to the number of cells in the sample) as input to a bootstrap function (bootstrp, Statistics Toolbox, Matlab 7.9, Mathworks), along with the number of bootstrap data samples to be drawn (10,000) and the statistical operation to be performed (mean). This gave a vector of 10,000 resampled values for the mean synaptic input.
Second, the same type of resampling was performed on the excitation profile data. In this case, the total number of action potentials per excitation profile was determined, and this set of values was provided (as a vector, equal in length to the number of cells in the sample) as input to the bootstrap function, along with the resampling size (10,000) and statistical operation (mean). The result was a vector of 10,000 resampled values for the average total number of action potentials per excitation profile.
Next, the first vector (the resampled values for synaptic input) was divided by the second (the resampled values for the action potentials), giving a vector consisting of 10,000 values for the ratio of input to photoexcitability. Standard deviation (s.d.) and 95% confidence intervals (c.i.) were calculated directly from these resampled data sets. Lastly, the WT and mutant results were normalized to the WT values, and confidence intervals were used to assess inter-group differences.
Statistics
Lilliefors’ test was applied to assess normalcy of distributions, and parametric (Students’ unpaired t-test) or non-parametric (Wilcoxon rank sum test) tests were applied to compare groups. Unless stated otherwise, statistical comparisons were made on the basis of t-tests with significance defined as p < 0.05, and group statistics are presented as mean ± standard error of the mean (s.e.m.).
RESULTS
Reduced cortical thickness in MeCP2−/y mice
We prepared brain slices from 3–4 week old mice, using an off-sagittal angle to obtain slices with M1 and adjacent somatosensory (S1) cortex (Weiler et al., 2008) (Fig. 1A, B). M1 was identified as agranular cortex anterior to somatosensory ‘barrel’ cortex. Because cortical thickness has been shown to be reduced in older MeCP2-null mice (Fukuda et al., 2005; Kishi and Macklis, 2004), we examined M1 cortical thickness in these slices prepared from WT (Fig. 1A) and mutant (Fig. 1B) mice. Cortical thickness in motor-frontal cortex of MeCP2−/y mice was modestly but significantly reduced to 94% of WT (WT: 1.378 ± 0.021 mm, n = 11 animals; MeCP2−/y: 1.291 ± 0.022 mm, n = 6 animals) (Fig. 1C).
Figure 1. Cortical thickness in motor-frontal cortex is mildly reduced in MeCP2-null mice.
(A) Bright-field video micrograph of a mouse brain slice containing motor-frontal cortex, from WT mouse. Arrowhead marks approximate location of border between primary somatosensory (‘barrel’) cortex (to left of arrowhead) and primary motor cortex (to right). Arrow: L4 barrels in S1.
(B) Example from a MeCP2−/y mouse.
(C) Average cortical thickness for WT and MeCP2−/y mice.
Calibration of LSPS: presynaptic photoexcitability
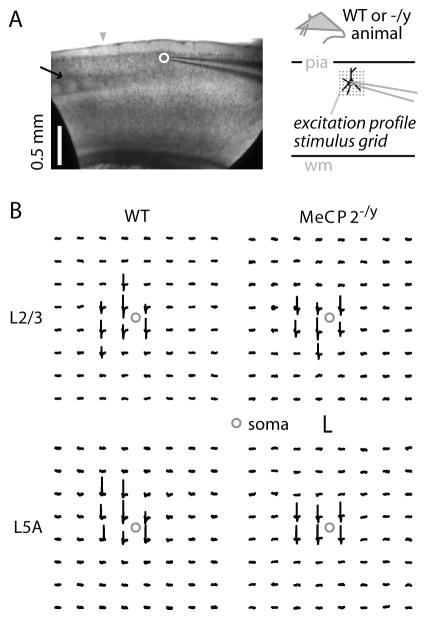
In this section we present the results of LSPS control and calibration experiments (‘excitation profiles’; see Methods). In the following section we draw on these data for the interpretation of LSPS input map experiments. Excitation profiles – maps revealing the number and spatial distribution of photoexcitable sites across individual neurons – provide a quantitative way to gauge neuronal photoexcitability, in presynaptic areas of interest, for the particular LSPS conditions (e.g. species, cortical area, animal age, ionic conditions, caged compound concentration, etc.) used (see Methods) (Fig. 2). Excitation data provide a way to assess whether changes in presynaptic photoexcitability contribute to differences observed in LSPS input maps.
Figure 2. Examples of excitation profiles, recorded in loose-seal mode from WT and mutant cortical slices.
(A) Bright-field image showing excitation profile recording arrangement (left), and schematic depiction of grid orientation for excitation profiles (right).
(B) Examples of excitation profiles for WT (left column) and mutant (right column) neurons, recorded in L2/3 (top row) or L3/5A (bottom row). Calibration: 100 msec and 1 mV (bottom left) or 2 mV (others).
We sampled excitation profiles in loose-seal recordings from pyramidal neurons in WT and MeCP2−/y animals (Figure 2; Table 1). We focused on neurons in the two main presynaptic regions of interest observed in synaptic input maps (see below): L2/3, the source of horizontal inputs to L2/3 neurons, and a laminar zone we refer to for convenience as “L3/5A” (Wood et al., 2009), the main source of ascending inputs to L2/3 neurons (Weiler et al., 2008). Further description of this L3/5A zone is provided in a later section.
Table 1.
Estimated resolution and intensity of photostimulation for WT and mutant neurons, based on analysis of excitation profiles.
| Neurons | Layer 2/3 | Layer 5A | ||
|---|---|---|---|---|
| Genotype | WT (28) | MeCP2−/y (24) | WT (16) | MeCP2−/y (24) |
| Resolution (μm) | 57.8 ± 2.9 | 56.6 ± 2.6 | 54.5 ± 4.0 | 54.1 ± 3.0 |
| I (spikes/map) | 8.07 ± 0.90 | 8.33 ± 1.34 | 8.52 ± 1.22 | 5.38 ± 0.74 * |
| In (spikes/neuron) | 0.020 ± 0.002 | 0.021 ± 0.003 | 0.021 ± 0.003 | 0.013 ± 0.002 * |
| Latency (msec) | 9.2 ± 0.4 | 9.4 ± 0.3 | 14.0 ± 1.2 | 14.7 ± 1.2 |
| Yfrac | 0.17 ± 0.01 | 0.19 ± 0.01 | 0.40 ± 0.01 | 0.40 ± 0.01 |
Numbers in parentheses: number of neurons per group. Values are presented as mean ± s.e.m. Resolution: mean distance from the soma of spike evoking sites, weighted by the number of spikes per site. Intensity (I): mean number of spikes per excitation profile. Normalized intensity (In): product of I and the x and y grid spacing (see Methods). Latency: post-stimulus latency-to-onset of action potentials. Yfrac: fractional soma distance between pia and white matter.
Asterisks indicate statistically significant differences (p < 0.05, t-test).
The excitation profile data sets were analyzed to determine (1) the total number of spikes per map per cell, an estimator of the intensity of photostimulation; and (2) the mean distance of spike-evoking sites from the soma, an estimator of the resolution of photostimulation. Excitation profiles of L2/3 neurons did not differ by genotype in either intensity or resolution. Excitation profiles of L3/5A neurons did not differ in resolution between genotype, but did differ in intensity: MeCP2−/y neuron stimulation in L3/5A showed a significant (~38%; p < 0.05, t-test) decrease over WT neurons (Table 1). We subsequently use these results to interpret synaptic input patterns.
A possible concern raised by the difference in excitability between WT and MeCP2−/y neurons in L3/5A is that it may not exclusively reflect a difference in the intrinsic photoexcitability of the neurons, but also a component of synaptic driving arising from co-stimulated and presynaptically connected pyramidal neurons, interneurons, or both. Although we cannot entirely exclude this possibility, the recording conditions used here have been designed to reduce synaptic driving to undetectable levels, as demonstrated and discussed previously (Weiler et al., 2008; see also Shubert et al., 2001; Shepherd et al., 2003; Shepherd and Svoboda, 2005). In particular, synaptic driving in the strongest excitatory pathway was not detected, even with higher stimulation intensities (Weiler et al., 2008). Thus, we consider it unlikely that synaptic driving contributed significantly to the excitation profiles recorded in the present study. To address this further, we analyzed the timing of spikes in our excitation profile data sets, reasoning that if excitatory synaptic inputs influence the photoexcitability of neurons this should hasten spike onset times; neurons should reach threshold sooner. Spike latencies did not show genotype-dependent differences within layers (p > 0.05, Kolmogorov-Smirnov test; Table 1). Although indirect, this analysis adds to the previous evidence (Weiler et al., 2008) indicating minimal or no synaptic driving in these slices for the recording conditions used here.
WT and MeCP2−/y neurons have similar electrophysiological properties
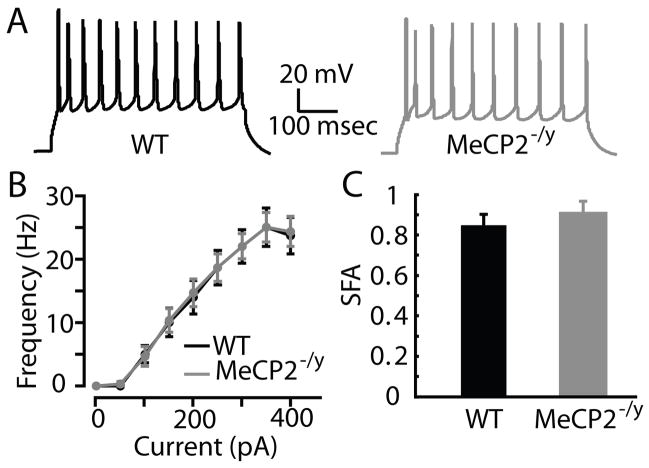
Differences in photoexcitability between groups of neurons can result from differences in intrinsic firing properties, glutamate sensitivity, or both. We therefore recorded intrinsic electrophysiological properties from WT (n = 6) and MeCP2−/y (n = 6) neurons in L3/5A, the layer in which photoexcitability differences were found. The slopes of voltage-current relationships did not differ by genotype (WT: 0.28 ± 0.05 mV/pA; MeCP2−/y: 0.24 ± 0.02 mV/pA). Active firing properties did not differ by genotype, including frequency-current relationships and spike-frequency adaptation (Fig. 3). We interpret these results to indicate that differences in photoexcitability in L3/5A most likely reflect reduced glutamate sensitivity in the MeCP2−/y neurons.
Figure 3. Intrinsic properties.
(A) Representative traces from WT and MeCP2−/y L3/5A pyramidal neurons.
(B) Firing frequency-current relationships for WT and MeCP2−/y L3/5A neurons.
(C) Spike-frequency adaptation in WT and MeCP2−/y L3/5A neurons.
Lateral excitatory synaptic input to L2/3 pyramidal neurons is reduced in MeCP2−/y mice
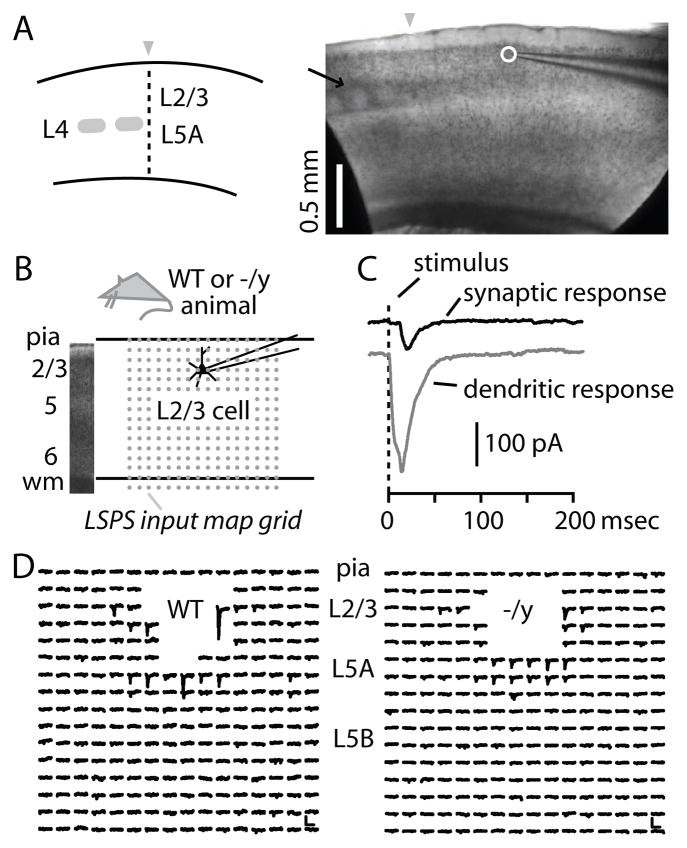
With LSPS we mapped the local input pathways of motor-frontal L2/3 pyramidal neurons in slices from WT and MeCP2−/y mice (Fig. 4A). In this technique, a neuron is targeted for patch clamp recording, and an array of locations in the slice around the neuron (Fig. 4B) is photostimulated by focal glutamate uncaging in a sequential site-by-site manner, thereby generating a map of local sources of synaptic input to the recorded neuron. Sites where responses are contaminated by direct stimulation of dendrites are readily distinguished from sites yielding synaptic inputs (Methods) (Fig. 4C). Typical arrays of traces from single map trials recorded from WT or MeCP2−/y neurons are shown in Fig. 4D. Because multiple neurons are stimulated at each location, pixels in LSPS maps do not represent the strengths of unitary connections, but instead represent the aggregate connectivity from presynaptic neurons at the stimulated location to the recorded postsynaptic neuron.
Figure 4. LSPS mapping methods.
(A) Schematic (left) and bright field image (right) of parasagittal slice with motor-frontal cortex. Anterior is to the right. Arrow: L4 barrels in S1. Arrowheads: S1-M1 border. Circle: soma of recorded neuron.
(B) Bright field image (left) showing cortical layers, and schematic (right) depicting recording arrangement and 16 × 16 site stimulation grid with 0.1 mm spacing (array of dots). Top and bottom lines represent pia and white matter, respectively.
(C) Examples of dendritic (gray) and synaptic responses (black) evoked by glutamate uncaging photostimulation.
(D) Representative synaptic responses, for neurons of both genotypes. Dendritic responses have been blanked. Scale bar: 100 msec, 50 pA.
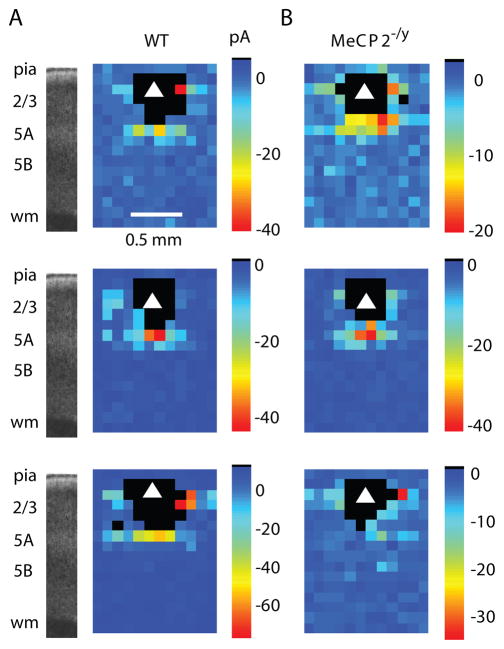
Neurons of both WT and MeCP2−/y mice received input from nearby locations including a zone directly below the neuron (Fig. 5A, B). This zone mostly corresponded to lower L2/3 and L5A, although there was some extension to upper L5B; as mentioned earlier, for convenience we refer to this zone as “L3/5A” (Wood et al., 2009). This L3/5A zone was at approximately the same radial distance from the pia as L4 in adjacent somatosensory cortex, and the ascending excitatory pathway in M1 resembles topographically the form of L4→2/3 projections in S1 (Bureau et al., 2008; Bureau et al., 2006; Weiler et al., 2008). Excitatory input maps appeared topographically similar for the two genotypes, but the strength of the ascending pathway from L3/5A appeared to be reduced in the MeCP2−/y mice (Fig. 5A, B).
Figure 5. Excitatory input maps show decreased input to L2/3 pyramidal neurons in MeCP2−/y mice.
(A) Representative examples of LSPS maps for L2/3 pyramidal neurons from WT mice Black pixels: dendritic sites.
(B) Representative examples of MeCP2−/y maps. Top maps in A and B correspond to traces shown in Fig. 3D.
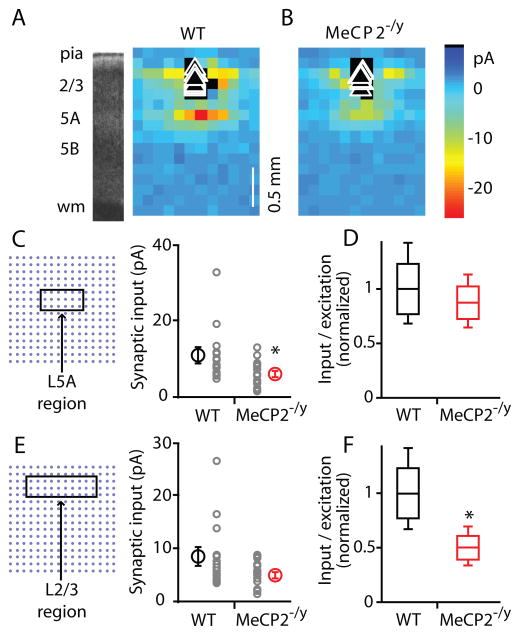
Pooling maps according to genotype and averaging (Fig. 6A, B) showed a reduction (by 44%; p < 0.05, Wilcoxon rank sum test) in the ascending excitatory input to the MeCP2−/y neurons (WT: 10.8 ± 1.8 pA, n = 15; MeCP2−/y: 6.0 ± 0.9 pA, n = 16) (Fig. 6C). The locus of reduced input occurred 0.6 to 0.8 mm below the pia, approximately at the L3/5A zone. A similar ROI type of analysis was done to assess the strength of horizontal input pathways, arising from lateral locations in L2/3 (Fig. 6E). In this case, the difference between these intralaminar, horizontal pathways (a 40% reduction in the mutant group; WT: 8.4 ± 1.6 pA; MeCP2−/y: 5.0 ± 0.6 pA) was not significant (p > 0.05, Wilcoxon rank sum test).
Figure 6. LSPS group data.
(A) Average maps recorded for L2/3 neurons in slices prepared from WT mice.
(B) Average maps for MeCP2−/y mice.
(C) Ascending synaptic input averaged across L3/5A ROI, not normalized for presynaptic photoexcitability (right). Schematic (left) shows the portion of the grid included in the ROI. Smaller circles: individual cells’ data points. Larger circles: mean values with s.e.m. bars. Asterisk indicates significant difference (p < 0.05, Wilcoxon rank sum test).
(D) Ascending synaptic input from L3/5A, normalized for presynaptic photoexcitability. Values shown represent mean synaptic input for the ROI indicated in C, divided by the mean number of action potentials per L3/5A excitation profile, and normalized to the mean WT value. Whisker plots: line within box represents the mean, and the upper and lower edges of the box represent ±1 s.d.; error bars show 95% c.i. (s.d. and c.i. were estimated by bootstrap methods; see Methods).
(E) Horizontal synaptic input averaged across L2/3 ROI, not normalized for presynaptic photoexcitability. Schematic (left) shows the portion of the grid included in the ROI. Smaller circles: individual cells’ data points. Larger circles: mean values with s.e.m. bars.
(F) Horizontal synaptic input from L2/3 normalized for presynaptic photoexcitability. See legend for panel D for definitions. Asterisk indicates significant difference (p < 0.05) based on comparison of means and 95% c.i. (see Methods).
These comparisons (Fig. 6C, E) do not take into account the photoexcitability of presynaptic neurons. It is important to do so, because photoexcitability differences could contribute to map differences. Therefore, we used a bootstrapping approach to normalize synaptic inputs by photostimulation intensity (see Methods, Map Analysis), as measured by excitation profiles (Table 1), as a way to factor out the contribution of presynaptic excitability to the apparent strength of inputs in the maps (Fig. 6D, F). From this bootstrap analysis we conclude that for the ascending L3/5A→2/3 pathway the reduction can be accounted for by reduced photoexcitability of presynaptic L3/5A neurons in mutant cortex (Fig. 6D). In contrast, for the horizontal input pathways (L2/3→2/3), input map differences were attributable to changes in connectivity rather than in presynaptic photoexcitability (Fig. 6F).
Local inhibitory synaptic input to L2/3 pyramidal neurons is preserved
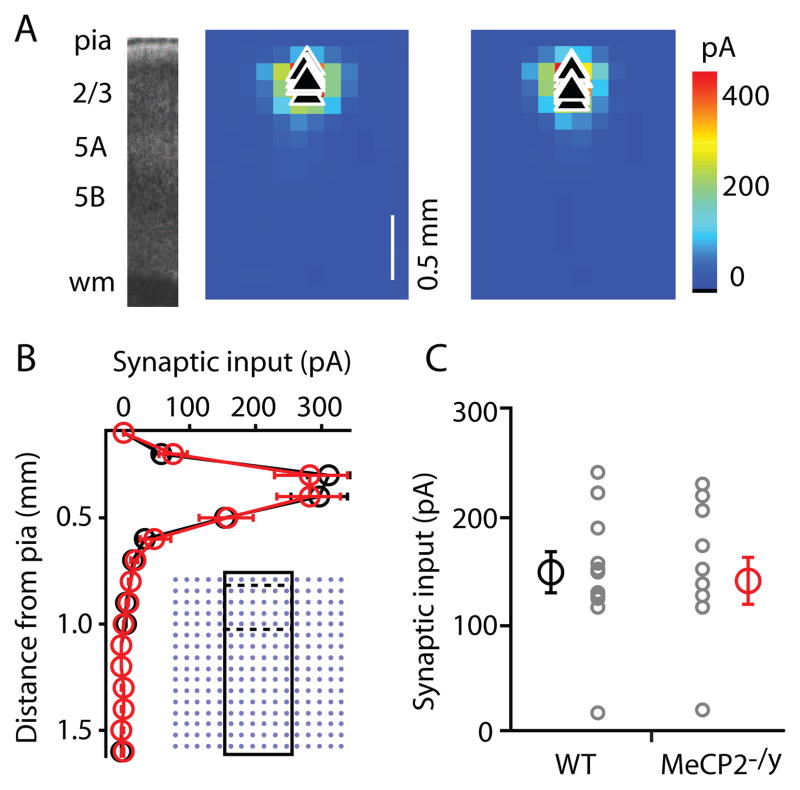
The preceding experiments measured excitatory responses, with the contribution of GABAergic responses minimized by recording at the GABAergic reversal potential. With LSPS it is also possible to map local sources of inhibitory input (Schubert et al., 2001; Shepherd et al., 2003; Lam and Sherman, 2005; Brill and Huguenard, 2009; Xu and Callaway, 2009). To measure inhibitory inputs we mapped at the reversal potential for glutamatergic responses, using Cs+-based intracellular solution with 1 mM QX-314 added to improve voltage control (Methods). In separate experiments, we determined that bath application of the selective GABAA antagonist SR95531 (10 μM, Tocris) completely blocked these outward currents (n = 3 WT and 3 MeCP2−/y neurons), demonstrating that these were indeed GABAergic events. On average, inhibitory maps were similar for WT and MeCP2−/y neurons (Fig. 7A). Vertical profiles of the inhibitory synaptic input, calculated by averaging along map rows, did not show genotype-dependent differences in inhibitory pathway strength (Fig. 7B), nor did an ROI analysis focusing on local L2/3 inputs (WT: 147.1 ± 17.7 pA, n = 11; MeCP2−/y: 140.1 ± 21.2 pA, n = 11) (Fig. 7C).
Figure 7. Inhibitory input maps of L2/3 pyramidal neurons are similar for WT and MeCP2−/y mice.
(A) (left) Bright field slice image. (right) Average inhibitory maps recorded for L2/3 neurons in slices prepared from WT and MeCP2−/y mice.
(B) Vertical profile of inhibitory synaptic input map averaged across rows as shown in black rectangle imposed on stimulus grid (inset). Dashed lines indicate region taken for ROI analysis in (C).
(C) Inhibitory synaptic input averaged across L2/3 ROI.
We did not measure excitation profiles of interneurons, due to the difficulties posed by interneuron heterogeneity both in identifying and in sampling adequately across interneuron classes. Excitability normalization methods (as used for excitatory input maps; see above) were therefore not applied to the inhibitory input map data. Thus, although we did not observe genotype-dependent differences in the inhibitory synaptic input maps, a caveat of this analysis is that it is in principle possible that our mapping methods failed to detect balanced changes in different subsets of interneurons, either in presynaptic excitability, postsynaptic sensitivity, or both.
DISCUSSION
In this study we examined neocortical synaptic circuits in presymptomatic hemizygous male MeCP2tm1.1Bird mice (“Bird” strain, in which exons 3 and 4 of the MeCP2 gene are deleted), a model of RTT (Guy et al., 2001). We used LSPS to map local sources of excitatory input to L2/3 pyramidal neurons in the motor-frontal area of WT and MeCP2−/y mice. We observed a reduction in excitatory synaptic input, extending previous observations of generally decreased excitation onto cortical neurons (Chao et al., 2007; Dani et al., 2005; Tropea et al., 2009), and consistent with the recent demonstration of reduced unitary connection strength between L5 neurons in somatosensory cortex (Dani and Nelson, 2009). Not all pathways were affected equally: the strongest phenotype was observed for lateral (horizontal, intralaminar) inputs, that is, L2/3→2/3 inputs, which showed a large reduction in MeCP2−/y animals. Neither the intrinsic properties of L2/3 pyramidal neurons nor maps of their inhibitory inputs showed genotype-dependent differences.
An important technical issue relates to the analysis of excitatory synaptic input maps. Its validity rests on the accuracy of the excitation-normalization procedure, which is based on excitation profiles. Excitation profiles, because they provide a direct measure of the intensity and resolution of photostimulation for the particular experimental conditions used (animal age, light intensity, glutamate concentration, solutions, and more), allow input maps to be normalized for presynaptic photoexcitability (Bureau et al., 2004; Matsuzaki et al., 2008). In contrast, dendritic responses (e.g. Schubert et al., 2001), reflect a combination of dendritic and glutamate receptor densities, but do not directly provide quantification of suprathreshold photoexcitability. A caveat with excitation profiles, however, is that they are recorded individually from user-selected neurons, and therefore provide a potentially noisy approximation of the aggregate photoexcitability of the populations of neurons activated by photostimuli during LSPS mapping. We expect such inaccuracies to be minor. We also note that these calibration issues do not pertain to an experimental paradigm we recently developed to analyze synaptic inputs to individually transfected cortical neurons in a knockdown model of MeCP2 deficiency (Wood et al., 2009), a strategy permitting within-slice comparisons of responses recorded from neighboring postsynaptic neurons.
These results can be compared to those obtained using essentially identical methods with a MeCP2 knockdown model (Wood et al., 2009). The key difference between the models is that in the knockdown paradigm a sparse subset of L2/3 pyramidal neurons was rendered MeCP2 deficient by RNAi methods, whereas in the MeCP2-null mice all cells lack MeCP2. In the knockdown model, changes in circuit properties could be ascribed specifically to postsynaptic MeCP2 deficiency in the recorded neurons, whereas in the mutant model the changes potentially represent a mix of specific defects and compensatory responses.
The circuit phenotypes observed with the two models show interesting similarities. In both models we observed a reduction in the strength of specific synaptic pathways providing excitatory input to L2/3 pyramidal neurons, with otherwise intact circuit topography. Furthermore, inhibitory inputs were not affected in either model. The similarities between these studies support the idea that MeCP2 is involved in the maturation and maintenance of excitatory synapses in cortex. That L2/3 neurons’ local circuits are affected in both the cell-specific and global MeCP2-deficiency models may have implications for how disease processes in RTT disrupt motor-cognitive aspects of behavior. Outputs from L2/3 neurons are primarily corticocortical, onto cortical neurons locally and in other ipsi- and contralateral cortical areas. An issue meriting further investigation is whether the synaptic output from L2/3 pyramidal neurons is also affected.
The circuit phenotypes observed with these two models also show an unexpected difference in the particular patterns of pathways that were affected. Indeed, the phenotypes were complementary: in the mutant model, horizontal input pathways were reduced and ascending pathways were relatively unaffected, while the converse was seen in the knockdown model. The mutant phenotype observed in the present study likely represents a manifestation of the combined effects of both primary (cell-specific) (Wood et al., 2009) and secondary (compensatory) effects of brain-wide MeCP2 deficiency on the local circuits of L2/3 neurons in motor-frontal cortex. As such, either pre- or postsynaptic effects, or both, may underlie the mutant phenotype.
A notable aspect of the mutant phenotype observed here is that, despite reductions in excitatory pathway strength, the MeCP2−/y circuit phenotype is relatively mild. One possible explanation is that synaptic-homeostatic and other compensatory circuit-level mechanisms (Turrigiano, 2007) are relatively spared in MeCP2-null animals. Recent evidence that long-term potentiation remains intact in MeCP2-null mice at 3–4 weeks (Dani and Nelson, 2009) supports the idea that, despite abnormally reduced connectivity, mechanisms for fine-tuning excitatory synapses are intact. In general, mouse models of RTT hold promise not only for identifying which cellular and synaptic mechanisms are pathologically affected in this neurological disorder, but also for identifying which remain intact; distinguishing between the two may be important for developing effective therapeutic approaches.
Acknowledgments
We thank M. Bevan, A. Contractor, M. Hooks, G. Maccaferri, and M. Tresch for valuable input. We are especially grateful to N. Weiler for experimental efforts in the early stages of this work and for comments on earlier drafts. We thank M. Hooks for statistical advice and comments on a draft. Support: Simons Foundation, Rett Syndrome Research Foundation (International Rett Syndrome Foundation), and National Institutes of Health (NS061534 to LW; NS061963 to GS).
Footnotes
Publisher's Disclaimer: This is a PDF file of an unedited manuscript that has been accepted for publication. As a service to our customers we are providing this early version of the manuscript. The manuscript will undergo copyediting, typesetting, and review of the resulting proof before it is published in its final citable form. Please note that during the production process errors may be discovered which could affect the content, and all legal disclaimers that apply to the journal pertain.
References
- Amir RE, et al. Rett syndrome is caused by mutations in X-linked MECP2, encoding methyl-CpG-binding protein 2. Nat Genet. 1999;23:185–8. doi: 10.1038/13810. [DOI] [PubMed] [Google Scholar]
- Brill J, Huguenard JR. Robust short-latency perisomatic inhibition onto neocortical pyramidal cells detected by laser-scanning photostimulation. J Neurosci. 2009;29:7413–23. doi: 10.1523/JNEUROSCI.6098-08.2009. [DOI] [PMC free article] [PubMed] [Google Scholar]
- Bureau I, et al. Precise development of functional and anatomical columns in the neocortex. Neuron. 2004;42:789–801. doi: 10.1016/j.neuron.2004.05.002. [DOI] [PubMed] [Google Scholar]
- Bureau I, et al. Circuit and plasticity defects in the developing somatosensory cortex of FMR1 knock-out mice. J Neurosci. 2008;28:5178–88. doi: 10.1523/JNEUROSCI.1076-08.2008. [DOI] [PMC free article] [PubMed] [Google Scholar]
- Bureau I, et al. Interdigitated paralemniscal and lemniscal pathways in the mouse barrel cortex. PLoS Biol. 2006;4:e382. doi: 10.1371/journal.pbio.0040382. [DOI] [PMC free article] [PubMed] [Google Scholar]
- Canepari M, et al. Photochemical and pharmacological evaluation of 7-nitroindolinyl-and 4-methoxy-7-nitroindolinyl-amino acids as novel, fast caged neurotransmitters. J Neurosci Methods. 2001;112:29–42. doi: 10.1016/s0165-0270(01)00451-4. [DOI] [PubMed] [Google Scholar]
- Chahrour M, Zoghbi HY. The story of Rett syndrome: from clinic to neurobiology. Neuron. 2007;56:422–37. doi: 10.1016/j.neuron.2007.10.001. [DOI] [PubMed] [Google Scholar]
- Chao HT, et al. MeCP2 controls excitatory synaptic strength by regulating glutamatergic synapse number. Neuron. 2007;56:58–65. doi: 10.1016/j.neuron.2007.08.018. [DOI] [PMC free article] [PubMed] [Google Scholar]
- Chen RZ, et al. Deficiency of methyl-CpG binding protein-2 in CNS neurons results in a Rett-like phenotype in mice. Nat Genet. 2001;27:327–31. doi: 10.1038/85906. [DOI] [PubMed] [Google Scholar]
- Cohen S, Greenberg ME. Communication between the synapse and the nucleus in neuronal development, plasticity, and disease. Annu Rev Cell Dev Biol. 2008;24:183–209. doi: 10.1146/annurev.cellbio.24.110707.175235. [DOI] [PMC free article] [PubMed] [Google Scholar]
- Collins AL, et al. Mild overexpression of MeCP2 causes a progressive neurological disorder in mice. Hum Mol Genet. 2004;13:2679–89. doi: 10.1093/hmg/ddh282. [DOI] [PubMed] [Google Scholar]
- Dani VS, et al. Reduced cortical activity due to a shift in the balance between excitation and inhibition in a mouse model of Rett Syndrome. Proc Natl Acad Sci U S A. 2005;102:12560–5. doi: 10.1073/pnas.0506071102. [DOI] [PMC free article] [PubMed] [Google Scholar]
- Dani VS, Nelson SB. Intact long-term potentiation but reduced connectivity between neocortical layer 5 pyramidal neurons in a mouse model of Rett Syndrome. J Neurosci. 2009;29:11263–70. doi: 10.1523/JNEUROSCI.1019-09.2009. [DOI] [PMC free article] [PubMed] [Google Scholar]
- Fukuda T, et al. Delayed maturation of neuronal architecture and synaptogenesis in cerebral cortex of Mecp2-deficient mice. J Neuropathol Exp Neurol. 2005;64:537–44. doi: 10.1093/jnen/64.6.537. [DOI] [PubMed] [Google Scholar]
- Guy J, et al. A mouse Mecp2-null mutation causes neurological symptoms that mimic Rett syndrome. Nat Genet. 2001;27:322–6. doi: 10.1038/85899. [DOI] [PubMed] [Google Scholar]
- Guy J, et al. Reversal of neurological defects in a mouse model of Rett syndrome. Science. 2007;315:1143–7. doi: 10.1126/science.1138389. [DOI] [PMC free article] [PubMed] [Google Scholar]
- Hagberg B, et al. A progressive syndrome of autism, dementia, ataxia, and loss of purposeful hand use in girls: Rett’s syndrome: report of 35 cases. Ann Neurol. 1983;14:471–9. doi: 10.1002/ana.410140412. [DOI] [PubMed] [Google Scholar]
- Kishi N, Macklis JD. MECP2 is progressively expressed in post-migratory neurons and is involved in neuronal maturation rather than cell fate decisions. Mol Cell Neurosci. 2004;27:306–21. doi: 10.1016/j.mcn.2004.07.006. [DOI] [PubMed] [Google Scholar]
- Lam W-Y, Sherman SM. Mapping by laser photostimulation of connections between the thalamic reticular and ventral posterior lateral nuclei in the rat. J Neurophysiol. 2005;94:2472–83. doi: 10.1152/jn.00206.2005. [DOI] [PubMed] [Google Scholar]
- Matsuzaki M, et al. Three-dimensional mapping of unitary synaptic connections by two-photon macro photolysis of caged glutamate. J Neurophysiol. 2008;99:1535–44. doi: 10.1152/jn.01127.2007. [DOI] [PubMed] [Google Scholar]
- Moretti P, Zoghbi HY. MeCP2 dysfunction in Rett syndrome and related disorders. Curr Opin Genet Dev. 2006;16:276–81. doi: 10.1016/j.gde.2006.04.009. [DOI] [PubMed] [Google Scholar]
- Percy AK. Rett syndrome. Current status and new vistas. Neurol Clin. 2002;20:1125–41. doi: 10.1016/s0733-8619(02)00022-1. [DOI] [PubMed] [Google Scholar]
- Ramocki MB, Zoghbi HY. Failure of neuronal homeostasis results in common neuropsychiatric phenotypes. Nature. 2008;455:912–8. doi: 10.1038/nature07457. [DOI] [PMC free article] [PubMed] [Google Scholar]
- Shahbazian M, et al. Mice with truncated MeCP2 recapitulate many Rett syndrome features and display hyperacetylation of histone H3. Neuron. 2002;35:243–54. doi: 10.1016/s0896-6273(02)00768-7. [DOI] [PubMed] [Google Scholar]
- Shepherd GMG. Intracortical cartography in an agranular area. Front Neurosci. 3:337–343. doi: 10.3389/neuro.01.030.2009. [DOI] [PMC free article] [PubMed] [Google Scholar]
- Shepherd GMG, et al. Circuit analysis of experience-dependent plasticity in the developing rat barrel cortex. Neuron. 2003;38:277–89. doi: 10.1016/s0896-6273(03)00152-1. [DOI] [PubMed] [Google Scholar]
- Shepherd GMG, Svoboda K. Laminar and columnar organization of ascending excitatory projections to layer 2/3 pyramidal neurons in rat barrel cortex. J Neurosci. 2005;25:5670–9. doi: 10.1523/JNEUROSCI.1173-05.2005. [DOI] [PMC free article] [PubMed] [Google Scholar]
- Schubert D, et al. Layer-specific intracolumnar and transcolumnar functional connectivity of layer V pyramidal cells in rat barrel cortex. J Neurosci. 2001;21:3580–92. doi: 10.1523/JNEUROSCI.21-10-03580.2001. [DOI] [PMC free article] [PubMed] [Google Scholar]
- Tropea D, et al. Partial reversal of Rett Syndrome-like symptoms in MeCP2 mutant mice. Proc Natl Acad Sci U S A. 2009;106:2029–2034. doi: 10.1073/pnas.0812394106. [DOI] [PMC free article] [PubMed] [Google Scholar]
- Turrigiano G. Homeostatic signaling: the positive side of negative feedback. Curr Opin Neurobiol. 2007;17:318–24. doi: 10.1016/j.conb.2007.04.004. [DOI] [PubMed] [Google Scholar]
- Weiler N, et al. Top-down laminar organization of the excitatory network in motor cortex. Nat Neuro. 2008;11:360–6. doi: 10.1038/nn2049. [DOI] [PMC free article] [PubMed] [Google Scholar]
- Wood L, et al. Synaptic circuit abnormalities of motor-frontal layer 2/3 pyramidal neurons in an RNA Interference model of methyl-CpG-binding protein 2 deficiency. J Neurosci. 2009 doi: 10.1523/JNEUROSCI.3321-09.2009. In Press. [DOI] [PMC free article] [PubMed] [Google Scholar]
- Xu X, Callaway EM. Laminar specificity of functional input to distinct types of inhibitory cortical neurons. J Neurosci. 2009;29:70–85. doi: 10.1523/JNEUROSCI.4104-08.2009. [DOI] [PMC free article] [PubMed] [Google Scholar]
- Yu J, et al. Local-Circuit Phenotypes of Layer 5 Neurons in Motor-Frontal Cortex of YFP-H Mice. Front Neural Circuits. 2008;2:6. doi: 10.3389/neuro.04.006.2008. [DOI] [PMC free article] [PubMed] [Google Scholar]
- Zoghbi HY. Postnatal neurodevelopmental disorders: meeting at the synapse? Science. 2003;302:826–30. doi: 10.1126/science.1089071. [DOI] [PubMed] [Google Scholar]


