Abstract
One of the sarcomeric mutations associated with a malignant phenotype of Familial Hypertrophic Cardiomyopathy (FHC) is the D166V point mutation in the ventricular myosin regulatory light chain (RLC) encoded by the MYL2 gene. In this report we show that the rates of myosin cross-bridge attachment and dissociation are significantly different in isometrically contracting cardiac myofibrils from right ventricles of transgenic (Tg)-D166V and Tg-WT mice. We have derived the myosin cross-bridge kinetic rates by tracking the orientation of a fluorescently labeled single actin molecule. Orientation (measured by polarized fluorescence) oscillated between two states, corresponding to the actin-bound and actin-free states of the myosin cross-bridge. The rate of cross-bridge attachment during isometric contraction decreased from 3 s−1 in myofibrils from Tg-WT to1.4 s−1 in myofibrils from Tg-D166V. The rate of detachment decreased from 1.3 s−1 (Tg-WT) to 1.2 s−1 (Tg-D166V). We also showed that the level of RLC phosphorylation was largely decreased in Tg-D166V myofibrils compared to Tg-WT. Our findings suggest that alterations in the myosin cross-bridge kinetics brought about by the D166V mutation in RLC might be responsible for the compromised function of the mutated hearts and lead to their inability to efficiently pump blood.
Keywords: Familial Hypertrophic Cardiomyopathy, Fluorescence Correlation Spectroscopy, Regulatory Light Chain of Myosin, Single Molecule Detection, Fluorescence lifetime, Sarcomere
1. Introduction
Familial hypertrophic cardiomyopathy (FHC) is an autosomal dominant disease characterized by ventricular hypertrophy, myofibrillar disarray and sudden cardiac death (SCD) [1]. FHC originates from mutations in genes that encode for the major contractile proteins of the heart, including the ventricular myosin regulatory light chain (RLC) [2–8]. Depending on the affected gene and the site of the mutation, FHC outcomes vary with regards to severity and extent of myocardial disarray, often leading to SCD at a young age [9, 10]. Clinical studies have revealed that the D166V mutation in the myosin RLC is associated with a malignant FHC disease phenotype [6]. Our previous studies on skinned cardiac muscle fibers from transgenic (Tg) mice expressing the D166V mutation of RLC revealed that compared to the wild type (WT) the D166V mutant fibers led to increased Ca2+ sensitivity of contractile force, decreased maximal ATPase and force [11]. However, gross isometric force is the time average of trillions of individual impulses that myosin heads deliver to thin filaments [12]. In this study we attempted to derive the information on the effect of the D166V RLC mutation at the level of a single molecule during the steady-state contraction of heart muscle. Previous studies showed that it is possible to recover kinetic information by subjecting muscle to rapid transients in load [13], length [14] or ATP concentration [15]. However, transient methods disrupt equilibrium and report on kinetics of a large ensemble.
A valuable method of obtaining steady-state kinetic information is to observe stochastic fluctuations in a signal [16–19]. The size of fluctuations varies inversely with the number of observed molecules [16]. Kinetic information can be extracted from fluctuations when a few molecules contribute to the signal and stochastic fluctuations become important (mesoscopic regime, [20]). The extreme case is when a single molecule is observed. This is the Single Molecule Detection limit (SMD) where the fluctuations are the largest. The significant advantage of this method is that the information about molecules is obtained during steady-state. The recent advances in fluorescence technology and in single molecule detection [21–24] made SMD possible in vitro. In application to muscle proteins, Warshaw and collaborators measured the orientation of a single molecule of smooth myosin II [25, 26] and Goldman & Selvin and collaborators measured the orientation of a single molecule of myosin V [27–29]. The disadvantage of the method is that it is technically challenging to observe one molecule among a large assembly. It is particularly difficult in muscle where the concentration of proteins is large [30] and consequently autofluorescence is significant. Nevertheless, SMD experiments in muscle tissue are crucially important, because they avoid problems associated with a high degree of organization of heart muscle. They also avoid problems associated with excluded volume effects caused by a fact that at high concentrations the access to proteins may be limited to only small solvents. As a result, proteins in certain regions of a muscle cell may become over hydrated and behave differently than isolated proteins that are normally hydrated [31, 32]. In this paper we report measurements of steady-state kinetics of WT and D166V mutated heart muscle.
It was anticipated that the most sensitive method of registering differences between the WT and D166V molecules would be the orientation of a single molecule of actin or myosin. A standard way to obtain this information is to measure anisotropy or polarization of fluorescence [33–37]. For SMD measurements it is preferable to observe actin rather than myosin. Observing actin after labeling with phalloidin has essential advantages in that: 1. Most importantly, it preserves the regular structure of a myofibril, unlike the less mild labeling of myosin that requires the fluorescence labeled light chains to be exchanged at 37°C. 2. It does not alter enzymatic properties of muscle [38, 39]. 3. Labeling is stoichiometric and allows strict control of the degree of labeling. Such control is impossible with myosin [40]. 4. Phalloidin attaches to actin noncovalently but strongly. Non-covalent binding is preferable in the case where orientation of a dipole moment of a probe is measured: the attachment is rigid (see Supplementary Material Fig. 1S) because it involves attachment over large surfaces through electrostatic and hydrogen bonds. To determine the rate of cross-bridge cycling in cardiac muscle, we have therefore measured anisotropy of a single molecule of actin during contraction in cardiac myofibrils.
We report that compared to WT, the D166V mutation decreased the rate of cross-bridge attachment and detachment during isometric contraction. The attachment rate decreased from 3 sec−1 measured in myofibrils from right ventricle of Tg-WT mice to1.4 sec−1 determined in Tg-D166V mice. The rate of detachment decreased from 1.3 sec−1 (Tg-WT) to 1.2 sec−1 (Tg-D166V). The D166V induced changes in cross-bridge kinetics could be due to dramatically decreased phosphorylation of RLC observed in Tg-D166V myofibrils compared to Tg-WT myofibrils. Our findings suggest that the slower myosin cross-bridge kinetics observed in Tg-D166V myofibrils is responsible for the altered function of the D166V mutated hearts compromising their ability to efficiently pump blood.
2. Materials and methods
Chemicals and solutions
Alexa488-phalloidin (AP) and rhodamine-phalloidin (RP) were from Molecular Probes (Eugene, OR). All other chemicals including 1-ethyl-3-(3'-dimethylaminopropyl) carbodiimide (EDC), phosphocreatine, creatine kinase, glucose oxidase, catalase and ATP were from Sigma (St Louis, MO). EDTA-rigor solution contained 50 mM KCl, 2 mM EDTA, 1 mM DTT, 10 mM Tris-HCl buffer pH 7.5. Ca2+-rigor solution contained 50 mM KCl, 4 mM MgCl2, 0.1 mM CaCl2, 1 mM DTT, 10 mM Tris-HCl buffer pH 7.5. Mg2+-rigor solution contained 50 mM KCl, 4 mM MgCl2, 1 mM DTT, 10 mM Tris-HCl buffer pH 7.5. Contracting solution was prepared by adding 5 mMATP to Ca2+-rigor solution.
Muscle
After euthanasia, the hearts from 6–7 month old Tg-D166V and Tg-WT mice were quickly removed and rinsed briefly (no more than 30 sec) with ice-cold 0.9% NaCl. Muscle strips from left and right ventricles and papillary muscles were dissected at 4°C in a cold room in ice-cold pCa 8 solution (10−8 M [Ca2+], 1mM [Mg2+], 7mM EGTA, 2.5 mM [MgATP2+], 20 mM MOPS, pH 7.0, 15 mM creatine phosphate, ionic strength = 150 mM adjusted with potassium propionate) containing 30 mM BDM and 15% glycerol [41, 42]. After dissection, muscle strips were transferred to pCa 8 solution mixed with 50% glycerol and incubated for 1 hr on ice. Then the muscle strips were transferred to fresh pCa 8 solution mixed with 50% glycerol and containing 1% Triton X-100 for 24 hr at 4°C. Muscle strips were finally transferred to a fresh batch of pCa 8 solution mixed 1:1 with glycerol and kept at −20°C until used for the preparation of myofibrils [41, 42].
Preparation of cardiac myofibrils
Myofibrils from Tg-WT and Tg-D166V mouse right ventricles were prepared from glycerinated fiber bundles stored at −20°C in glycerinating solution as described in Mettikolla et al. [41]. Myofibrils were always freshly prepared for each experiment. Labeled myofibrils (25 μl) were applied to a 25×60 mm #1 coverslip (Corning, Corning, NY). The coverslips were coated with Poly L-lysine to assure that myofibrils adhere well to the glass. Coverslips were first washed with 1M HCl 3–4 times. They were then thoroughly rinsed to remove any residual remains of the acid. The coverslips were incubated with Poly-L-lysine solution (Sigma 0.1%) for 2 h or overnight, and rinsed thoroughly with water. They were left to air dry before use. The sample was placed on the coverslip for 3 min to allow the myofibrils to adhere to the glass. The 25×60 mm cover slip was covered with a small (25×25 mm) coverslip and myofibrils were labeled as described below.
Determination of RLC phosphorylation in cardiac myofibrils
Myofibrils from right ventricles of transgenic WT and D166V mouse hearts were examined for the level of RLC phosphorylation using Western blotting. About 10 μg of myofibrils from each group were loaded onto 15% SDS-PAGE allowing the separation of myofilament proteins. The level of myosin RLC phosphorylation was determined with a human +P- RLC antibody (a generous gift from Dr. Neal Epstein, NIH) used in 1:2000 dilution, followed by a secondary antibody conjugated with the fluorescence dye, Cy 5.5 [11]. To verify loading conditions, the myosin essential light chain (ELC) was detected using an ELC-specific monoclonal antibody (MAB150 1:4000; Accurate Chemical and Scientific Corp., Westbury, NY, USA). Scanning densitometry of the immunoblots was performed with an Odyssey Infrared Imaging System (LI-COR Inc) and the band intensity was determined using the Odyssey v1.2 software. The degree of RLC phosphorylation in Tg-D166V myofibrils was calculated as % of +P-RLC determined in Tg-WT myofibrils. Both bands of +P-D166V and +P-WT were corrected for loading using the optical density of the band immunostained with the anti-ELC monoclonal antibody.
Preventing shortening of contracting muscle
Our task was to compare the fluorescence anisotropy of actin in Tg-WT and Tg-D166V myofibrils during rigor and contraction. There is no difficulty in measuring lifetime of rigor myofibrils. However, it is impossible to do so during contraction, because myofibrils shorten. Myofibrils often shorten in relaxing solution as well, due to the damage to troponin or tropomyosin, which become ineffective in preventing contraction even in the absence of Ca2+. To measure anisotropy of contracting muscle, it was therefore necessary to prevent myofibrils from shortening. This was done by cross-linking with water-soluble cross-linker EDC [43]. Myofibrils (1 mg/ml) were incubated with 20 mM EDC for 20 min at room temperature. The reaction was stopped by adding 20 mM DTT. The lack of shortening was checked under differential contrast [44]. It has been shown that cross-linked myofibrils are a good in vitro model for muscle fiber ATPase and the kinetics of Ca2+-activated activity [43]. The large Pi bursts and kcat values were also the same in cross-linked myofibrils and muscle fibers [43]. Those results were confirmed by Lionne et al. [45]. ATPase was measured by Malachite Green kit (AnaSpec, San Jose, CA).
Labeling
1 mg/ml myofibrils were mixed rapidly (in a Vortexer) with 0.1 nM rhodamine-phalloidin (RP) + 10 μM unlabeled-phalloidin (UP) in Ca2+-rigor solution. Large excess of unlabeled phalloidin was necessary to assure that only 1 in 100,000 actin monomers were labeled and that labeling was uniform, i.e. that myofibrils closest to the pipette tip were not labeled more than distant myofibrils. After application to a coated coverslip, myofibrils were washed with 5 volumes of the Ca2+-rigor solution by applying the solution to the one end of the experimental chamber and absorbing with #1 filter paper at the other end [41].
Rotation of rhodamine-phalloidin on F-actin
For the quantitative measurement of orientation, it is important to know whether the probe is immobilized by the protein so that the transition dipole of the fluorophore reflects the orientation of the protein. Fig. 1S of Supplementary Material shows that this is the case for RP-labeled thin filaments.
Anisotropy measurements
The experiments were done using ISS-Alba-FCS (ISS Co, Urbana, IL) confocal systems coupled to Olympus IX 71 microscope. The excitation was by a 532 nm CW laser. Confocal pinhole was 50 μm. Orthogonally linearly polarized analyzers were placed before Avalanche PhotoDiodes (APD's). The direction of the linear polarization of the laser was vertical on the microscope stage. The myofibrils were always placed with the axis pointing horizontally on the microscope stage. Channel 1 and 2 measured the polarized intensities oriented parallel and perpendicular to the myofibrillar axis, respectively.
Data analysis
Fluorescence was collected every 10 μs. The signal was averaged by binning 1000 data points together, i.e. the final frequency response was 100 Hz. The smoothened signal was fitted to an exponential that was subsequently subtracted from the averaged signal. From this the autocorrelation function was calculated. The autocorrelation function was fitted to a train of triangular waves by a least squares fit, i.e. it was assumed that the “hidden signal” to look for was a rectangular wave. The programming and calculations were done in Matlab. The autocorrelation functions were determined by calculating Fast Fourier Transform of the signal padded with an equal number of zeros in order to exclude the last points from the signal to correlate with the first, squaring the absolute magnitude of the resulting frequency domain signal and calculating reverse Fast Fourier Transform. Thus, Fourier Transform was calculated twice, a much faster routine than computing autocorrelation function directly from the signal by calculating the sum of the products of a signal with itself shifted by a delay time.
Lifetime measurements
Images were obtained using a MicroTime 200 instrument (PicoQuant, GmbH, Berlin, Germany) coupled to an Olympus IX71 microscope. Fluorescence lifetimes were measured with the same instrument by the time-domain technique. Excitation was achieved using a 470-nm pulsed laser diode, and the observation was made through a 590-nm long wave pass filter. FWHM of pulse response function was 68 psec (measured by PicoQuant, Inc.) while the time resolution was better than 10 psec. The intensity decays were analyzed in terms of a multi-exponential model using SymPhoTime v. 4.3 software (PicoQuant, Inc.). The intensity average lifetime was calculated as where and αi is the fractional contribution of the i-th lifetime, τi. The amplitude average lifetime was calculated as . The lifetimes of free and bound RP in water and glycerol were measured with/in a FluoTime 200 fluorometer (PicoQuant Inc) equipped with a microchannel plate (MCP) and 470 nm pulsed laser diode (76 psec half-width). This instrument provides an exceptional resolution in the sub-nanosecond range [46].
3. Results
Imaging
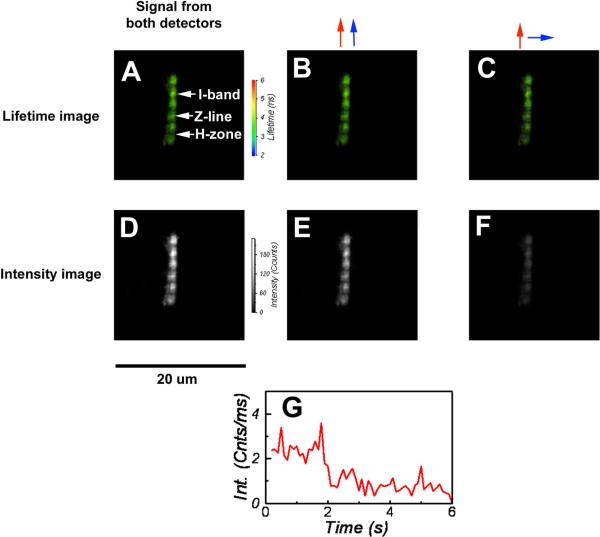
Fig. 1A–C shows a typical lifetime image of a rigor Tg-WT myofibril from the right ventricle of the mouse heart labeled with Alexa488-phalloidin. The images clearly show that in cardiac muscle the entire I-bands are labeled. In contrast, phalloidin labels only the overlap zone of the sarcomere in skeletal muscle [47]. This is because the binding of phalloidin in skeletal muscle is regulated by nebulin [48], and no nebulin is present in cardiac muscle. The Z-lines are heavily stained because they contain a high concentration of actin, and there is no fluorescence from the H-bands because they contain no actin. The orthogonal polarization images show that the fluorescence is highly anisotropic (Fig. 1E,F) [49] as it is expected from the aligned array of polar actin filaments. Fig. 1G shows the time trace of the polarized fluorescence intensity in the parallel channel. The intensity suddenly dropped at ~2 sec from the rate of ~3 to ~1 counts/msec -- the level of the background in rigor muscle. This behavior is characteristic of single molecule bleaching. Since we work in a saturated regime, where increasing laser power does not lead to an increase in the number of photons emitted by fluorophores and the quantum yield and absorption coefficient at 470 nm of Alexa488 are comparable to rhodamine-phalloidin at 532 nm, we conclude that a single chromophore in our instrument gives rise to a fluorescent rate of ~2,000–4,000 photons/s per channel. We therefore believe that the signal originates from a single molecule of actin.
Fig. 1.
Lifetime (A, B, C) and polarization (D, E, F) images of rigor Tg-WT myofibril from the mouse heart (right ventricle). The color bar at right of A represents the intensity scale, with red corresponding to 6 nsec and blue to 2 nsec. The black and white bar at right of D, is the intensity scale with white corresponding to 255 and black to zero. Red and blue arrows indicate direction of polarization of excitation and fluorescent light, respectively. G: Sudden drop in total intensity to the level of the background in rigor muscle – behavior characteristic of single molecule bleaching. The intensity suddenly dropped at ~2sec. The rate of arrival of fluorescent photons before bleaching was 2.4 photons/ms (see text). Data acquired with the PicoQuant Micro Time 200 confocal lifetime microscope. Excitation with a 470 nm pulse of light, emission through LP500 filter. Myofibrils labeled with 0.1 μM Alexa488-phalloidin.
WT Myofibrils
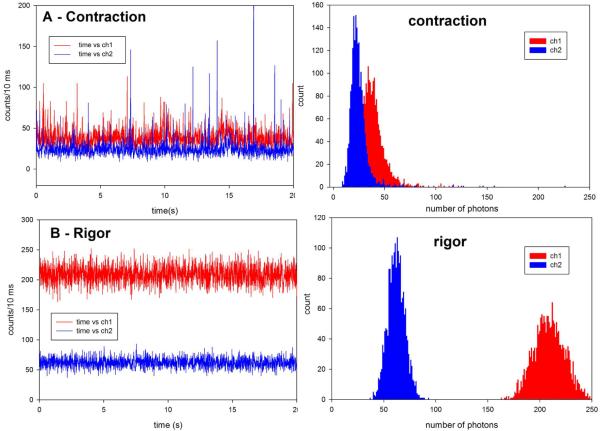
The fluorescence intensity was measured by positioning the laser beam at the center of the I-band. The laser beam was not scanned. After opening the laser shutter the fluorescence intensity was initially high (~50 counts/msec). It decayed after several seconds to a steady state value of ~2–4K photons/sec. Fig. 2 (left panels) show a typical intensity of polarized fluorescence data collected from the WT right ventricular myofibrils during 20 seconds of contraction (A) and in rigor (B). Intensity of polarized fluorescence (either parallel or perpendicular) was taken as a signal for analysis (anisotropy, being a ratio of two noisy signals, was too difficult to process). Rigor data was taken as a negative control to prove that the cycling cross-bridges are the source of signal fluctuations. Myofibrils were cross-linked to avoid shortening. The fluorescence was due to a single fluorophore in the detection volume (because the rate of fluorescence from a single rhodamine molecule in myofibrils was ~2–4K photons/s, Fig. 1G). Right panels of Fig. 2 show distribution of photon counts for each orthogonal intensity.
Fig. 2.
Comparison of the raw polarized fluorescence intensity signals of contracting (A) and rigor (B) myofibril from Tg-WT heart. The original data was collected every 10 μsec but 1000 points are binned together to give 10 msec time resolution, i.e. the vertical scale is the number of counts during 10 ms. Note that the scale in both panels is the same. Myofibrillar axis is horizontal on the microscope stage. Laser polarization is vertical on the microscope stage. Ch1 (red) and ch2 (blue) are the fluorescence intensities polarized perpendicular and parallel to the myofibrillar axis, respectively. Right panels: Histogram of the intensity of vertical polarized intensity component of contracting (top) and rigor (bottom) myofibril from the same experiment on Tg-WT heart.
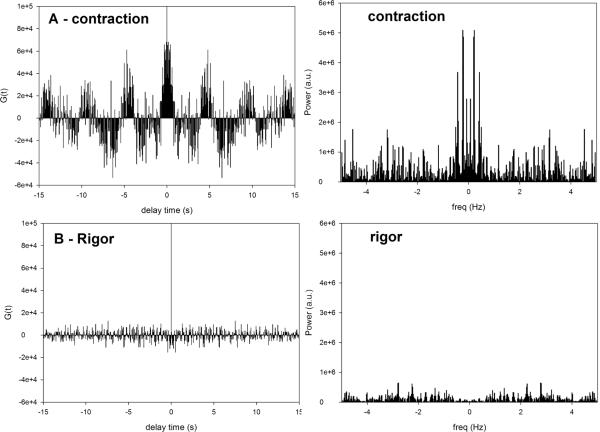
In principle, when a single molecule is observed, it should be possible to distinguish the individual impulses by inspection of the intensity traces such as shown in Fig. 2A. However, while differences between contracting and rigor myofibril traces are readily visible, it is impossible to distinguish individual impulses and extract kinetic information from the data of contracting myofibrils. The signal is simply too noisy. Nevertheless, even if our estimation is wrong and the signal originates from more than one molecule, kinetic information can still be extracted from stochastic fluctuations by computing a correlation function of the fluctuations. This greatly decreases noise in the signal. The relationship between the correlation function and the signal is illustrated schematically in Fig. 2S. The correlation function at a given delay time τ is a sum of the products of a signal multiplied by a signal shifted by a delay time τ. If the signal is periodic, the autocorrelation function will also be periodic with the same periodicity as the original signal. At the same time the autocorrelation of noise is zero, because there is no correlation between value at a given time and its value any time later. The autocorrelation function of the intensity of parallel polarized signal from Tg-WT heart ventricle during contraction (ch1 of Fig. 2A) is shown in Fig. 3A. The autocorrelation function corresponding to the signal from Tg-WT heart ventricle in rigor (ch2 of Fig. 2B) is shown in Fig. 3B. An equivalent way to display kinetic properties is as a histogram of power contained in the signal at each sampled frequency (Power Spectrum). A Power Spectrum is a Fourier Transform of the correlation function (Fig. 2S). The right panels of Fig. 3 show the Power Spectra of the contracting (top) and rigor (bottom) myofibril of Fig. 2A. The spectra show that the signal contains high frequency components. This reflects the fact that each peak of a correlation function is composed of several harmonic “sub-peaks” (see below).
Fig. 3.
Correlation function (left panels) and Power spectra (right panels) of the data from Fig. 2. A: The correlation function of ch1 data from Fig. 2A ; B: ch2 data from Fig. 2B. Right panels: the corresponding Power density spectra of contracting (top) and rigor (bottom) Tg-WT myofibril.
D166V-Mutated Myofibrils
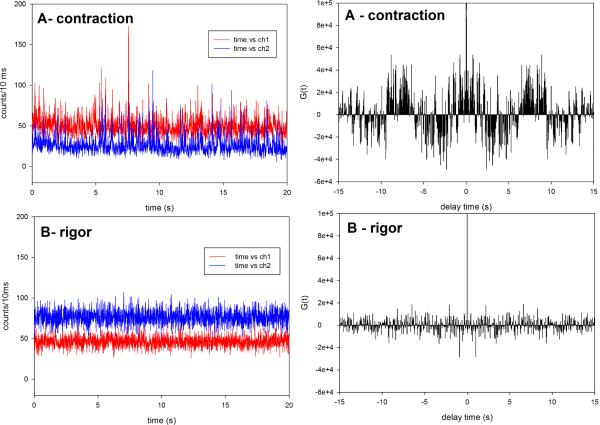
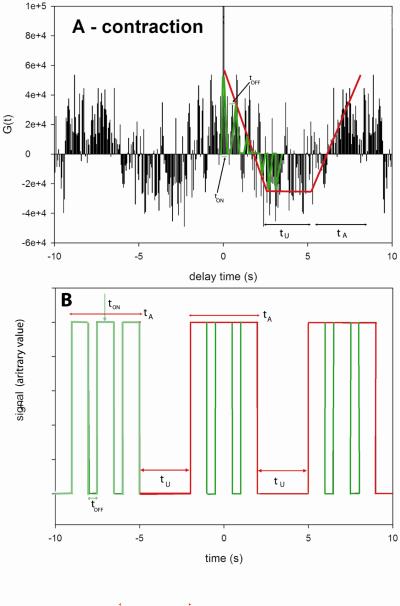
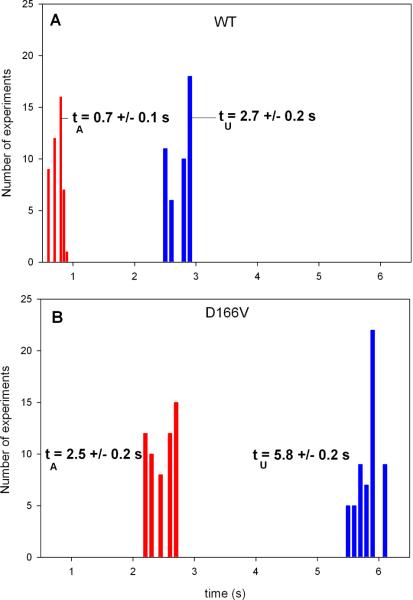
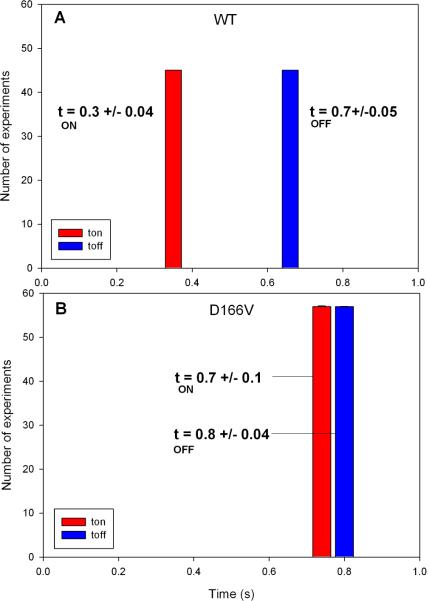
Fig. 4 shows a typical intensity trace during 20 seconds of data collection from a single molecule of the D166V mutated heart ventricular myofibrils. Fig. 3S of Supplementary Material is the plot of distribution of photon counts of each orthogonal intensity. Like the data acquired for Tg-WT muscle, the kinetics of Tg-D166V cannot be distinguished from these plots and require the computation of the autocorrelation function. The autocorrelation functions of the signal from contracting Tg-D166V heart myofibrils and rigor Tg-D166V myofibrils are shown at right. Fig. 5 illustrates how the kinetic constants tA−1 & tU−1 and tON−1 & tOFF−1 were extracted from this data. The data was fit to the “big” and “small” triangles (indicated by the red and green lines, respectively). Big (red) triangles reflect overall periodicity of the signal. The first (negative) slope of the red triangles (the time for the correlation function to decay from the value at time 0 to the first negative inflection) defines the time tA when cross-bridges are able to reach an actin monomer under observation. This is because signal which corresponds to this part of the red autocorrelation function has a high value (Fig. 5B). Horizontal parts of the red correlation function plus the time to climb from the end of horizontal part of the autocorrelation function to the second peak defines the time tU, when cross-bridges are unable to reach an actin monomer under observation. This is because signal which corresponds to this part of the red autocorrelation has a low value. During tU, the cross-bridges may be unable to reach actin because they have a restricted access or because their axial position does not allow the power stroke to take place. It is interesting to note that the myosin heads gain access to the actin monomers in bursts. Small (green) triangles reflect local periodicity of the signal. The first (negative) slope of the green triangles (the time for the correlation function to decay from the value at time 0 to the first negative inflection) defines the time tON when a cross-bridge is attached to an actin monomer under observation. This is because signal which corresponds to this part of the green autocorrelation function has a high value (Fig. 5B). Horizontal parts of the green correlation function plus the time to climb from the end of horizontal part of the autocorrelation function to the second peak defines the time tOFF when the cross-bridges are detached from actin monomers under observation. This is because the signal corresponding to this part of the green autocorrelation function has a low value. Time tON + tOFF probably reflects the cycling of myosin cross-bridges associated with ATP turnover. The frequency of this process was 1 Hz and 1.5 Hz for WT and D166V myofibrils, respectively. The values of tA & tU and tON & tOFF, obtained for 45 WT myofibrils and 57 D166V myofibrils, are compared in Fig. 6 and 7 and summarized in Table 1. The differences between the times were highly statistically significant (e.g. t=45.2, P<<0.005 for tA) and t=91.1, P<<0.005 for tU). The results show that for Tg-WT mice the OFF time was approximately twice as long as the ON time, suggesting that the duty ratio, defined as the fraction of a total cycle time that a cross-bridge remains attached to actin Ψ = tON /(tON+tOFF) in isometrically working WT heart was ~30%. For Tg-D166V mice the OFF and ON times were approximately the same, suggesting the duty ratio in isometrically working D166V mutated heart was ~50%.
Fig. 4.
The time course of polarized intensity of contracting (A) and rigor (B) Tg-D166V myofibril from right ventricle. Right panels show the corresponding autocorrelation functions. Myofibrillar axis is horizontal on the microscope stage. Laser polarization is vertical on the microscope stage. Ch1 (red) and ch2 (blue) are the fluorescence intensities polarized perpendicular and parallel to the myofibrillar axis, respectively.
Fig. 5.
Relationship between tA-tU and tON-tOFF in the correlation function (A) and in the signal (B). The tA and tU indicate times that the cross-bridges are able and unable to reach actin, respectively, and tON and tOFF the times when cross-bridge is attached or free from actin.
Fig. 6.
Comparison of tA and tU from 45 contracting Tg-WT (A) and 57 Tg-D166V (B) heart myofibrils.
Fig. 7.
Comparison of tON and tOFF from 45 contracting Tg-WT (A) and 57 Tg-D166V (B) heart myofibrils.
Table 1.
Accessible and Unaccessible times (tA and tU) and ON and OFF times of Tg-WT and Tg-D166V heart right ventricle.
| Time\muscle | WT (45 experiments) | D166V (57 experiments) |
|---|---|---|
| tA (s) | 0.7±0.1 | 2.5±0.2 |
| tU (s) | 2.7±0.2 | 5.8±0.2 |
| tON (s) | 0.3±0.04 | 0.7±0.1 |
| tOFF (s) | 0.7±0.05 | 0.8±0.04 |
Phosphorylation of RLC in WT and D166V-mutated myofibrils
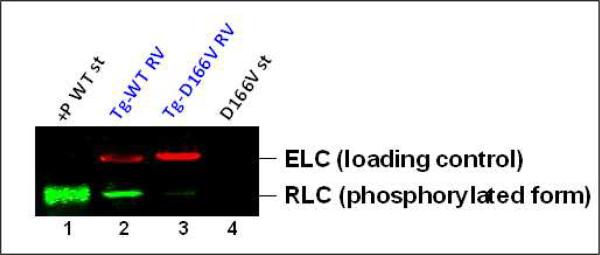
The level of RLC phosphorylation in all myofibrils from right ventricles of transgenic D166V and WT animals was assessed with a human phospho-RLC antibody generously provided by Dr. Neal Epstein, NIH. Fig. 8 demonstrates the effect of the D166V mutation on the phosphorylation status of the RLC in myofibrils blotted with +P-human RLC antibodies, specific for the phosphorylated form of the human ventricular RLC [50]. Since both Tg-WT and Tg-D166V mice express similar amounts of the human RLC protein [11], the RLC phosphorylation level in Tg-WT and Tg-D166V myofibrils could be directly compared. In agreement with our recent study [11], the D166V mutation showed dramatically reduced phosphorylation of RLC in D166V myofibrils, yielding ~ 1.3±0.4 % (n=2) of phosphorylation observed in WT myofibrils (Fig. 8). The intensity of phosphorylated RLC bands in Tg-D166V and Tg-WT myofibrils were corrected for loading using an ELC (myosin essential light chain)-specific monoclonal antibody (MAB150) recognizing the total ELC protein in both types of myofibrils (Fig. 8).
Fig. 8.
The effect of the D166V mutation on RLC phosphorylation in transgenic mouse ventricular myofibrils blotted with +P-human RLC antibody recognizing phosphorylated human RLC (transgenic). Lane 1, +P WT st, phosphorylated recombinant standard WT protein; lane 2, Tg-WT RV, transgenic wild type myofibrils isolated from right ventricles of Tg-WT mice; lane 3, Tg-D166V RV, transgenic D166V mutant myofibrils isolated from right ventricles of Tg-D166V mice; D166V st, non-phosphorylated recombinant human D166V standard protein. Myosin essential light chain (ELC) served as a loading control and was detected with monoclonal MAB150 antibody.
4. Discussion
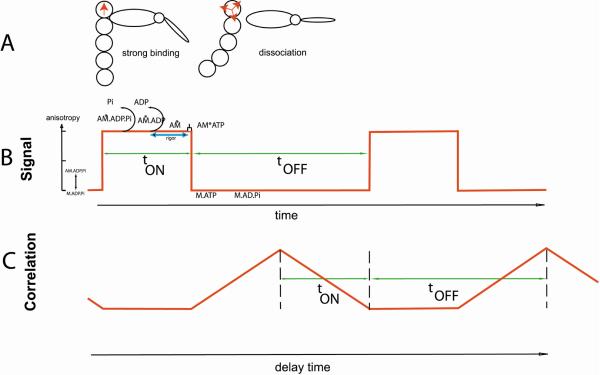
The main result of this study is that the kinetics of myosin cross-bridges in the D166V mutated cardiac myofibrils are significantly different than that measured in WT myofibrils. The observed differences do not depend on whether one monitors tA-tU or tON-tOFF. Similarly, the duty ratio of cross-bridges in WT is different from that in D166V myofibrils and the average value of the duty cycle in the isometrically contracting myofibrils from Tg-WT and Tg-D166V mice was 30% and 50%, respectively. The difference is statistically significant (P<0.05). We reached these conclusions by using fluorescence anisotropy to compare the kinetics of binding of myosin cross-bridges to actin. Kinetics was measured by following the intensity of polarized fluorescence of a single molecule of actin in myofibrils prepared from Tg-WT and Tg-D166V hearts. Not surprisingly, the signals were quite noisy because they originated from a single molecule among 200,000 present in HS. To reduce the noise, we have analyzed the correlation function of the signal. Kinetic parameters were extracted from the correlation function by fitting it to a piecewise linear train of triangles. Such a train of triangles is the correlation function of a train of the rectangular waves. Train of rectangular waves is the simplest time course of anisotropy change that occurs during muscle contraction. While this scheme is an oversimplification of the actual events [51], there is no doubt that it correctly represents the main events during a contractile cycle, i.e. the binding and dissociation events of a myosin cross-bridge. Intensity of either polarized fluorescence component is high when it is immobilized by binding to myosin and low when it is free (detached) from myosin [52]. Myosin cross-bridges carrying the products of hydrolysis of ATP bind strongly to actin leading to their immobilization and high anisotropy. Cross-bridge binding probably prevents undulation of the whole filament [53, 54] rather than preventing rotation of the actin monomer (Fig. 9A). Dissociation of Pi leads to force generation followed by the dissociation of ADP and the rigor conformation. The attached state ends when the myosin cross-bridge binds a new molecule of ATP. The strongly attached state lasts tON seconds. The cross-bridge detachment results in a rapid flutter of F-actin segment to which the cross-bridge was bound and leads to a low anisotropy. This state lasts tOFF seconds. This simplified scheme and associated autocorrelation function are shown in Fig. 9B and 9C. The average cycle times determined in the present work for Tg-WT and Tg-D166V myofibrils, tC=tON + tOFF, were longer than the rates of cross-bridge dissociation (g) determined from the maximal ATPase activity/concentration of cross-bridges attached at all levels of force activation in skinned papillary muscle fibers from Tg-WT and Tg-D166V mice [11]. This is most likely caused by the fact that the fiber ATPase is not equivalent to changes in the orientation of rhodamine-phalloidin (RP)-actin protomer. The former reflects a gross phenomenon, while the SMD polarization measurements report on a local orientation change. It is possible that not every hydrolysis event leads to a change in RP-actin orientation as the hydrolysis by a distant cross-bridge may not be sensed by the actin molecule under observation (because only 1 in 100,000 actin monomers are labeled). The fact that the nearest cross-bridge on the same actin filament is 38.5 nm away suggests that the signal may not be transmitted over such a distance, consistent with the view that signal propagates only over a few actin monomers [55]. Alternatively, the EDC-crosslinked myofibrils may represent an extreme case of isometric conditions in which no filament or inter-filament compliance is possible at all, analogous to “infinite” load. Such conditions might not be possible to be reproduced in fiber experiments where even very strict length clamping might still allow some compliance at microscopic level, which may accelerate cross-bridge kinetics.
Fig. 9.
The simplest scheme for generating anisotropy fluctuations in contracting myofibrils. A. Actin becomes immobilized when a cross-bridge binds to it resulting in a well defined direction of transition dipole (red arrow, left panel) and high anisotropy. Dipoles become disorganized when a cross-bridge dissociates, leading to low anisotropy (multiple arrows, right panel). B. A simple rectangular signal reflecting binding-dissociation of a cross-bridge. C. Autocorrelation function of a rectangular signal showing duration (tON seconds) of strongly attached state and detached (or weakly attached) state, lasting tOFF seconds.
An interesting feature is that the signal is comprised of two periodic processes. The first, a slow process, probably reflects the overall ability of a cross-bridge to bind to actin. The characteristic time of this process was 3.4 seconds in WT myofibrils and 8.3 seconds in D166V. A surprising fact was that cross-bridges seem to bind to actin in bursts. There are periods during which no binding occurs: During tU the cross-bridges may not be able to reach actin because of the restricted access or because their axial position does not allow power stroke to take place. The second, a fast process, most likely reflects a normal cross-bridge cycling and occurs during tA a normal cross-bridge - actin interaction).
Implications for heart studies
There are certain advantages in studying the FHC-linked disease in the human heart by observing a response from a single molecule. In the transgenic mouse myocardium the D166V mutated human ventricular RLC replaces the endogenous mouse ventricular RLC in ~ 95% of cases. The probability of finding a “healthy” cross-bridge in Tg-D166V sample was therefore quite small (in fact only 5 experiments out of 62 performed on Tg-D166V preparations gave equivocal results). On the other hand, human patients are normally heterozygous for FHC disease and 50% of their myosin-containing thick filaments are composed of the non-mutant myosin heads interspersed with the FHC mutant heads. We could therefore anticipate that the probability of D166V-mediated cross-bridge kinetics vs. WT in experiments performed on the heart biopsies from the patients carrying the D166V mutation would be 50:50. If the distribution of the healthy and diseased molecules is random, any collection containing more than one molecule carries high probability of containing a mixture of the healthy and diseased species. Therefore, averaging would prevent one from knowing whether a particular heart is affected by the disease. How do we know that the SMD condition is met in our experiments? First, it can be seen that the intensity of the observed signal is similar to the intensity of a signal from a single chromophore such as shown in Fig. 2G. Second, based on the known ratio of phalloidin to actin, it is possible to calculate theoretically the number of detected chromophores: the length, width and height of a typical HS are 1, 1, and 0.5 μm, respectively and its volume is 0.5 μm3 = 5 × 10⁻¹⁶ L. Since the concentration of actin in muscle is 0.6 mM [30], this volume contains ~200,000 actin monomers. The myofibril is labeled with 0.1 nM RP + 10 μM unlabeled phalloidin, i.e. only one in 100,000 actin monomers carries fluorescent phalloidin. Therefore there are ~ 2 fluorophores per HS. Since we detect only ~50% of the fluorescence signal from a HS (the detection area is ~0.5 μm2 -- π times the square of the lateral resolution), it is concluded that we detect fluorescence from approximately one chromophore.
On the other hand diagnosis in humans would be made easier by the fact that MYL2 gene expression occurs both in the heart and in the slow skeletal muscle. The biopsies for diagnosis could be therefore obtained from the soleus muscle of the D166V patients and tested in our single molecule experiments. This could be advantageous not only because biopsied samples are easy to obtain, but more importantly because of the regular sarcomere organization of the skeletal vs. cardiac muscle myofibrils make the SMD experiments in skeletal muscle myofibrils easier to perform.
Relation to fiber studies
Our results show significant increases in tON (≈1/g) and tOFF (≈1/f) in cardiac myofibrils carrying the D166V mutation in RLC compared with WT myofibrils. The slower cross-bridge kinetics of D166V myofibrils determined in this study are in agreement with our cellular findings obtained in skinned and intact papillary muscle fibers from Tg-D166V compared with Tg-WT mice [11]. Kerrick et al. [11] showed that the D166V mutation dramatically decreased g, the rate of cross-bridge dissociation that resulted in a slower muscle relaxation manifested by delayed force transients in electrically stimulated Tg-D166V intact papillary muscles compared to Tg-WT muscles. Changes in muscle relaxation as observed in the previous and current studies are indicative of diastolic dysfunction and most likely underlie the malignant phenotype observed in patients carrying the D166V mutation in RLC [6]. In addition, as we predicted in Kerrick et al. [11] and measured in the current work, the rate of cross-bridge formation (f) was also decreased by the D166V mutation. Changes in f are anticipated to result in potential systolic dysfunction of the D166V hearts. Interestingly, the D166V substitution resulted in a decreased level of RLC phosphorylation measured in rapidly frozen ventricular samples from Tg-D166V mice in our previous study [11], and also in D166V myofibrils prepared from right ventricles of transgenic hearts used in this single molecule investigation (Fig. 8). Therefore, the slower kinetics of D166V myosin cross-bridges could be the result of a mutation-mediated decrease in myosin RLC phosphorylation. There is a large body of evidence demonstrating that in striated muscles myosin RLC phosphorylation increases force and accelerates contraction (reviewed in [56] Not surprisingly, our results in skinned Tg-D166V fibers show a D166V induced decrease in maximal force [11] and both the previous and current experiments with D166V heart preparations show a mutation dependent decrease in myosin cross-bridge kinetics. In the heart, myosin RLC phosphorylation has been shown to be important for the stretch activation response [50]. Modulation of stretch activation through RLC phosphorylation could have important consequences to normal cardiac physiology. As was suggested by a recent study from Stull's group, myosin RLC phosphorylation may prevent a pathophysiological response of the heart (e.g. to FHC mutation) by contributing to enhanced contractile performance and efficiency [57. Taken together, our studies suggest that the D166V mutation may lead to diastolic and systolic dysfunction through slower cross-bridge kinetics that in part could be caused by a decreased phosphorylation of the D166V hearts that in the long term might ultimately result in a compensatory hypertrophy and sudden cardiac death as observed in the individuals harboring the D166V mutation in RLC [6].
Supplementary Material
Acknowledgements
The authors thank Jingsheng Liang (Univ. of Miami, Miller School of Medicine) for the preparation of glycerinated skinned ventricular muscle fibers from Tg-WT and Tg-D166V mice. This work was supported by the NIH grants: R01AR048622 (to J.B.), R01HL071778 (to D.S-C.), R01HL090786 (to J.B. and D.S-C.) and by Texas ETF grant (CCFT). R.L. is the recipient of the Research Mobility program from the Polish Ministry of Science and Higher Education.
Glossary
- FHC
Familial Hypertrophic Cardiomyopathy
- RLC
Regulatory Light Chain of Myosin
- SCD
Sudden Cardiac Death
- SMD
Single Molecule Detection
- Ψ
Duty Cycle
- Tg-WT
Transgenic Wild Type
- Tg-D166V
Transgenic D166V RLC Mutant
- τ
Average fluorescence lifetime of actin
- HS
Half-Sarcomere
- RP
Rhodamine-phalloidin
Appendix
Footnotes
Publisher's Disclaimer: This is a PDF file of an unedited manuscript that has been accepted for publication. As a service to our customers we are providing this early version of the manuscript. The manuscript will undergo copyediting, typesetting, and review of the resulting proof before it is published in its final citable form. Please note that during the production process errors may be discovered which could affect the content, and all legal disclaimers that apply to the journal pertain.
Disclosure Statement No conflict of interest
References
- 1.Tin LL, Beevers DG, Lip GY. Hypertension, left ventricular hypertrophy, and sudden death. Curr Cardiol Rep. 2002;4(6):449–57. doi: 10.1007/s11886-002-0105-6. [DOI] [PubMed] [Google Scholar]
- 2.Poetter K, et al. Mutations in either the essential or regulatory light chains of myosin are associated with a rare myopathy in human heart and skeletal muscle. Nat Genet. 1996;13(1):63–9. doi: 10.1038/ng0596-63. [DOI] [PubMed] [Google Scholar]
- 3.Flavigny J, et al. Identification of two novel mutations in the ventricular regulatory myosin light chain gene (MYL2) associated with familial and classical forms of hypertrophic cardiomyopathy. J Mol Med. 1998;76(3–4):208–14. doi: 10.1007/s001090050210. [DOI] [PubMed] [Google Scholar]
- 4.Andersen PS, et al. Myosin light chain mutations in familial hypertrophic cardiomyopathy: phenotypic presentation and frequency in Danish and South African populations. J Med Genet. 2001;38(12):E43. doi: 10.1136/jmg.38.12.e43. [DOI] [PMC free article] [PubMed] [Google Scholar]
- 5.Kabaeva ZT, et al. Systematic analysis of the regulatory and essential myosin light chain genes: genetic variants and mutations in hypertrophic cardiomyopathy. Eur J Hum Genet. 2002;10(11):741–8. doi: 10.1038/sj.ejhg.5200872. [DOI] [PubMed] [Google Scholar]
- 6.Richard P, et al. Hypertrophic Cardiomyopathy: Distribution of Disease Genes, Spectrum of Mutations, and Implications for a Molecular Diagnosis Strategy. Circulation. 2003;107:2227–2232. doi: 10.1161/01.CIR.0000066323.15244.54. [DOI] [PubMed] [Google Scholar]
- 7.Morner S, et al. Identification of the genotypes causing hypertrophic cardiomyopathy in northern Sweden. J Mol Cell Cardiol. 2003;35(7):841–9. doi: 10.1016/s0022-2828(03)00146-9. [DOI] [PubMed] [Google Scholar]
- 8.Hougs L, et al. One third of Danish hypertrophic cardiomyopathy patients have mutations in MYH7 rod region. Eur J Hum Genet. 2005;13:161–165. doi: 10.1038/sj.ejhg.5201310. [DOI] [PubMed] [Google Scholar]
- 9.Maron BJ. The young competitive athlete with cardiovascular abnormalities: causes of sudden death, detection by preparticipation screening, and standards for disqualification. Card Electrophysiol Rev. 2002;6:100–3. doi: 10.1023/a:1017903709361. [DOI] [PubMed] [Google Scholar]
- 10.Maron BJ, et al. Epidemiology of hypertrophic cardiomyopathy-related death: revisited in a large non-referral-based patient population. Circulation. 2000;102:858–64. doi: 10.1161/01.cir.102.8.858. [DOI] [PubMed] [Google Scholar]
- 11.Kerrick WG, et al. Malignant familial hypertrophic cardiomyopathy D166V mutation in the ventricular myosin regulatory light chain causes profound effects in skinned and intact papillary muscle fibers from transgenic mice. Faseb J. 2009;23(3):855–65. doi: 10.1096/fj.08-118182. [DOI] [PMC free article] [PubMed] [Google Scholar]
- 12.Oplatka A. On the mechanochemistry of muscular contraction. J Theor Biol. 1972;34(2):379–403. doi: 10.1016/0022-5193(72)90169-5. [DOI] [PubMed] [Google Scholar]
- 13.Podolsky RJ, Gulati J, Nolan AC. Contraction transients of skinned muscle fibers. Proc Natl Acad Sci U S A. 1974;71(4):1516–9. doi: 10.1073/pnas.71.4.1516. [DOI] [PMC free article] [PubMed] [Google Scholar]
- 14.Huxley AF, Simmons RM. Proposed mechanism of force generation in striated muscle. Nature. 1971;233:533–538. doi: 10.1038/233533a0. [DOI] [PubMed] [Google Scholar]
- 15.Dantzig JA, Higuchi H, Goldman YE. Studies of molecular motors using caged compounds. Methods Enzymol. 1998;291:307–48. doi: 10.1016/s0076-6879(98)91021-7. [DOI] [PubMed] [Google Scholar]
- 16.Magde D, Elson EL, Webb WW. Fluorescence correlation spectroscopy. II. An experimental realization. Biopolymers. 1974;13(1):29–61. doi: 10.1002/bip.1974.360130103. [DOI] [PubMed] [Google Scholar]
- 17.Elson EL, Magde D. Fluorescence Correlation Spectroscopy: Coceptual Basis and Theory. Biopolymers. 1974;13:1–28. doi: 10.1002/bip.1974.360130103. [DOI] [PubMed] [Google Scholar]
- 18.Elson EL. Fluorescence correlataion spectroscopy and photobleaching recovery. Annu. Rev. Phys. Chem. 1985;3:379–406. [Google Scholar]
- 19.Elson EL. Quick tour of fluorescence correlation spectroscopy from its inception. J Biomed Opt. 2004;9(5):857–64. doi: 10.1117/1.1779234. [DOI] [PubMed] [Google Scholar]
- 20.Qian H, Saffarian S, Elson EL. Concentration fluctuations in a mesoscopic oscillating chemical reaction system. Proc Natl Acad Sci U S A. 2002;99(16):10376–81. doi: 10.1073/pnas.152007599. [DOI] [PMC free article] [PubMed] [Google Scholar]
- 21.Enderlein J, Ambrose WP. Optical collection efficiency function in single-molecule detection experiments. Appl Opt. 1997;36(22):5298–302. doi: 10.1364/ao.36.005298. [DOI] [PubMed] [Google Scholar]
- 22.Willets KA, et al. Novel fluorophores for single-molecule imaging. J Am Chem Soc. 2003;125(5):1174–5. doi: 10.1021/ja029100q. [DOI] [PubMed] [Google Scholar]
- 23.Wang Y, et al. Single-molecule structural dynamics of EF-G--ribosome interaction during translocation. Biochemistry. 2007;46(38):10767–75. doi: 10.1021/bi700657d. Epub 2007 Aug 30. [DOI] [PubMed] [Google Scholar]
- 24.Taniguchi Y, et al. Single molecule thermodynamics in biological motors. Biosystems. 2007;88(3):283–92. doi: 10.1016/j.biosystems.2006.08.016. Epub 2006 Nov 10. [DOI] [PubMed] [Google Scholar]
- 25.Warshaw DM, et al. Myosin conformational states determined by single fluorophore polarization. Proc Natl Acad Sci U S A. 1998;95(14):8034–8039. doi: 10.1073/pnas.95.14.8034. [DOI] [PMC free article] [PubMed] [Google Scholar]
- 26.Quinlan ME, Forkey JN, Goldman YE. Orientation of the myosin light chain region by single molecule total internal reflection fluorescence polarization microscopy. Biophys J. 2005;89(2):1132–42. doi: 10.1529/biophysj.104.053496. [DOI] [PMC free article] [PubMed] [Google Scholar]
- 27.Forkey JN, et al. Three-dimensional structural dynamics of myosin V by single-molecule fluorescence polarization. Nature. 2003;422(6930):399–404. doi: 10.1038/nature01529. [DOI] [PubMed] [Google Scholar]
- 28.Yildiz A, et al. Myosin V walks hand-over-hand: single fluorophore imaging with 1.5-nm localization. Science. 2003;300(5628):2061–5. doi: 10.1126/science.1084398. [DOI] [PubMed] [Google Scholar]
- 29.Toprak E, et al. Defocused orientation and position imaging (DOPI) of myosin V. Proc Natl Acad Sci U S A. 2006;103(17):6495–9. doi: 10.1073/pnas.0507134103. [DOI] [PMC free article] [PubMed] [Google Scholar]
- 30.Bagshaw CR. Muscle Contraction. Chapman & Hall; London: 1982. [Google Scholar]
- 31.Minton AP, Wilf J. Effect of macromolecular crowding upon the structure and function of an enzyme: glyceraldehyde-3-phosphate dehydrogenase. Biochemistry. 1981;20(17):4821–4826. doi: 10.1021/bi00520a003. [DOI] [PubMed] [Google Scholar]
- 32.Minton AP. Excluded volume as a determinant of macromolecular structure and reactivity. Biopolymers. 1981;20:2093–2120. [Google Scholar]
- 33.Dos Remedios CG, Millikan RG, Morales MF. Polarization of tryptophan fluorescence from single striated muscle fibers. A molecular probe of contractile state. J. Gen. Physiol. 1972;59:103–120. doi: 10.1085/jgp.59.1.103. [DOI] [PMC free article] [PubMed] [Google Scholar]
- 34.Dos Remedios CG, Yount RG, Morales MF. Individual states in the cycle of muscle contraction. Proc Natl Acad Sci U S A. 1972;69:2542–2546. doi: 10.1073/pnas.69.9.2542. [DOI] [PMC free article] [PubMed] [Google Scholar]
- 35.Nihei T, Mendelson RA, Botts J. Use of fluorescence polarization to observe changes in attitude of S1 moieties in muscle fibers. Biophys. J. 1974;14:236–242. doi: 10.1016/S0006-3495(74)85911-4. [DOI] [PMC free article] [PubMed] [Google Scholar]
- 36.Tregear RT, Mendelson RA. Polarization from a helix of fluorophores and its relation to that obtained from muscle. Biophys. J. 1975;15:455–467. doi: 10.1016/S0006-3495(75)85830-9. [DOI] [PMC free article] [PubMed] [Google Scholar]
- 37.Morales MF. Calculation of the polarized fluorescence from a labeled muscle fiber. Proc Nat Acad Sci USA. 1984;81:145–9. doi: 10.1073/pnas.81.1.145. [DOI] [PMC free article] [PubMed] [Google Scholar]
- 38.Bukatina AE, Fuchs F, Watkins SC. A study on the mechanism of phalloidininduced tension changes in skinned rabbit psoas muscle fibres. J Muscle Res Cell Motil. 1996;17(3):365–71. doi: 10.1007/BF00240934. [DOI] [PubMed] [Google Scholar]
- 39.Prochniewicz-Nakayama E, Yanagida T, Oosawa F. Studies on conformation of F-actin in muscle fibers in the relaxed state, rigor, and during contraction using fluorescent phalloidin. J. Cell Biol. 1983;97:1663–1667. doi: 10.1083/jcb.97.6.1663. [DOI] [PMC free article] [PubMed] [Google Scholar]
- 40.Shepard A, Borejdo J. Correlation between mechanical and enzymatic events in contracting skeletal muscle fiber. Biochemistry. 2004;43:2804–2811. doi: 10.1021/bi030233d. [DOI] [PubMed] [Google Scholar]
- 41.Mettikolla P, et al. Fluorescence Lifetime of Actin in the FHC Transgenic Heart. Biochemistry. 2009 doi: 10.1021/bi801629d. in press. [DOI] [PMC free article] [PubMed] [Google Scholar]
- 42.Szczesna-Cordary D, et al. The E22K mutation in myosin RLC that causes familial hypertrophic cardiomyopathy increases calcium sensitivity of force and ATPase in transgenic mice. J. Cell Science. 2005;118 doi: 10.1242/jcs.02492. [DOI] [PubMed] [Google Scholar]
- 43.Herrmann C, et al. Correlation of ActoS1, myofibrillar, and muscle fiber ATPases. Biochemistry. 1994;33(14):4148–54. doi: 10.1021/bi00180a007. [DOI] [PubMed] [Google Scholar]
- 44.Borejdo J, et al. Rotation of Actin Monomers during Isometric Contraction of Skeletal Muscle. J. Biomed. Optics. 2007;12 doi: 10.1117/1.2697286. in press. [DOI] [PubMed] [Google Scholar]
- 45.Lionne C, et al. Why choose myofibrils to study muscle myosin ATPase? J Muscle Res Cell Motil. 2003;24(2–3):139–48. doi: 10.1023/a:1026045328949. [DOI] [PubMed] [Google Scholar]
- 46.Muthu P, et al. Decreasing Photobleaching by Silver Nanoparticles on Metal Surfaces: Application to Muscle Myofibrils. J. Biomed. Optics. 2008 doi: 10.1117/1.2854120. in press. [DOI] [PubMed] [Google Scholar]
- 47.Szczesna D, Lehrer SS. The binding of fluorescent phallotoxins to actin in myofibrils. J Muscle Res Cell Motil. 1993;14(6):594–7. doi: 10.1007/BF00141556. [DOI] [PubMed] [Google Scholar]
- 48.Ao X, Lehrer SS. Phalloidin unzips nebulin from thin filaments in skeletal myofibrils. J Cell Sci. 1995;108(Pt 11):3397–403. doi: 10.1242/jcs.108.11.3397. [DOI] [PubMed] [Google Scholar]
- 49.Borovikov YS, Chernogriadskaia NA. Studies on conformational changes in F-actin of glycerinated muscle fibers during relaxation by means of polarized ultraviolet fluorescence microscopy. Microsc Acta. 1979;81(5):383–92. [PubMed] [Google Scholar]
- 50.Davis JS, et al. The overall pattern of cardiac contraction depends on a spatial gradient of myosin regulatory light chain phosphorylation. Cell. 2001;107(5):631–41. doi: 10.1016/s0092-8674(01)00586-4. [DOI] [PubMed] [Google Scholar]
- 51.Houdusse A, Sweeney HL. Myosin motors: missing structures and hidden springs. Curr Opin Struct Biol. 2001;11(2):182–94. doi: 10.1016/s0959-440x(00)00188-3. [DOI] [PubMed] [Google Scholar]
- 52.Pesce AJ, Rosen C-G, Pasby TL. Fluorescence Spectroscopy. Marcel Dekker; New York: 1971. [Google Scholar]
- 53.Yanagida T, Oosawa F. Polarized fluorescence from epsilon-ADP incorporated into F-actin in a myosin-free single fiber: conformation of F-actin and changes induced in it by heavy meromyosin. J Mol Biol. 1978;126(3):507–24. doi: 10.1016/0022-2836(78)90056-6. [DOI] [PubMed] [Google Scholar]
- 54.Yanagida T, Oosawa F. Conformational changes of F-actin-epsilon-ADP in thin filaments in myosin-free muscle fibers induced by Ca2+ J Mol Biol. 1980;140(2):313–20. doi: 10.1016/0022-2836(80)90108-4. [DOI] [PubMed] [Google Scholar]
- 55.Ando T. Propagation of Acto-S-1 ATPase reaction-coupled conformational change in actin along the filament. J Biochem (Tokyo) 1989;105(5):818–22. doi: 10.1093/oxfordjournals.jbchem.a122751. [DOI] [PubMed] [Google Scholar]
- 56.Sweeney HL, Bowman BF, Stull JT. Myosin light chain phosphorylation in vertebrate striated muscle: regulation and function. Am J Physiol. 1993;264(5 Pt 1):1085–95. doi: 10.1152/ajpcell.1993.264.5.C1085. [DOI] [PubMed] [Google Scholar]
- 57.Huang J, et al. Myosin regulatory light chain phosphorylation attenuates cardiac hypertrophy. J Biol Chem. 2008;283(28):19748–56. doi: 10.1074/jbc.M802605200. [DOI] [PMC free article] [PubMed] [Google Scholar]
Associated Data
This section collects any data citations, data availability statements, or supplementary materials included in this article.


