Abstract
Endoplasmic reticulum (ER) stress-mediated cell death plays an important role in the pathogenesis of chronic diseases including diabetes and neurodegeneration. Although pro-apoptotic programs activated by ER stress have been extensively studied, identification and characterization of anti-apoptotic programs that counteract ER stress is currently incomplete. Through the gene expression profiling of β-cells lacking WFS1, a causative gene for Wolfram syndrome, we have discovered a novel anti-apoptotic gene of the unfolded protein response (UPR), apoptosis antagonizing transcription factor (AATF). Here we study the regulation of AATF, identify its target genes, and determine the basis for its anti-apoptotic activities in response to ER stress. We show that AATF is induced by ER stress through the PERK-eIF2α pathway and transcriptionally activates the Akt1 gene through Stat3, which sustains Akt1 activation and promotes cell survival. Ectopic expression of AATF or a constitutively active form of AKT1 confers on cells resistance to ER stress-mediated cell death, whereas RNAi-mediated knockdown of AATF or AKT1 renders cells sensitive to ER stress. We also discovered positive crosstalk between the AATF and WFS1 signaling pathways. Thus, WFS1-deficiency or AATF-deficiency mediates a self-perpetuating cycle of cell death. Our results reveal a novel anti-apoptotic program relevant to treatment for diseases caused by ER stress-mediated cell death.
Introduction
The endoplasmic reticulum (ER) is an organelle responsible for several important cellular functions including protein and lipid biosynthesis, Ca2+ storage, and signaling. Protein folding and processing enzymes, as well as the chemical environment within the ER are required for proteins to properly fold into their functional conformation. Myriad pathological and physiological factors can perturb this unique protein-folding environment and disrupt ER homeostasis, causing accumulation of unfolded proteins and ER stress (1). In order to attenuate ER stress and restore ER homeostasis, the unfolded protein response (UPR) is activated. There are three distinct responses of the UPR: upregulation of molecular chaperones to increase the ER folding activity, translational attenuation to reduce ER workload, and induction of ER-associated protein degradation (ERAD) to promote clearance of unfolded and misfolded proteins (1, 2). However, if the UPR fails to attenuate ER stress, the UPR directly activates pro-apoptotic programs (3, 4). Some of the proposed mechanisms of ER stress-mediated cell death include the induction of the pro-apoptotic transcription factor CHOP, the activation of the c-Jun N-terminal kinase (JNK) pathway by IRE1, and the activation of BH-3 only proteins such as Puma or Bim (5–7). However, the identification and characterization of anti-apoptotic programs in the UPR is currently incomplete (4).
It has been suggested that ER stress-mediated cell death plays an important role in the progression of diabetes, especially genetic forms of diabetes such as Wolfram syndrome (8–11). Postmortem studies reveal a non-autoimmune-linked selective loss of pancreatic β-cells in patients with Wolfram syndrome (12). The causative gene for this syndrome was identified by two separate groups in 1998 and named WFS1 (13, 14). We have previously shown that WFS1 is a component of the UPR. WFS1 expression is induced transcriptionally in response to ER stress, and when suppressed, causes high levels of ER stress in β-cells (15), suggesting that β-cell death in Wolfram syndrome can be attributed to chronic, unresolvable ER stress due to the lack of functional WFS1 protein in β-cells. Here we report the identification of anti-apoptotic programs of the UPR regulated by apoptosis antagonizing transcription factor (AATF) through the gene expression profiling of β-cells lacking WFS1 and demonstrate how AATF confers resistance to ER stress-mediated cell death.
Results
Gene expression profiling of β-cells lacking WFS1 identifies a novel anti-apoptotic factor of the UPR
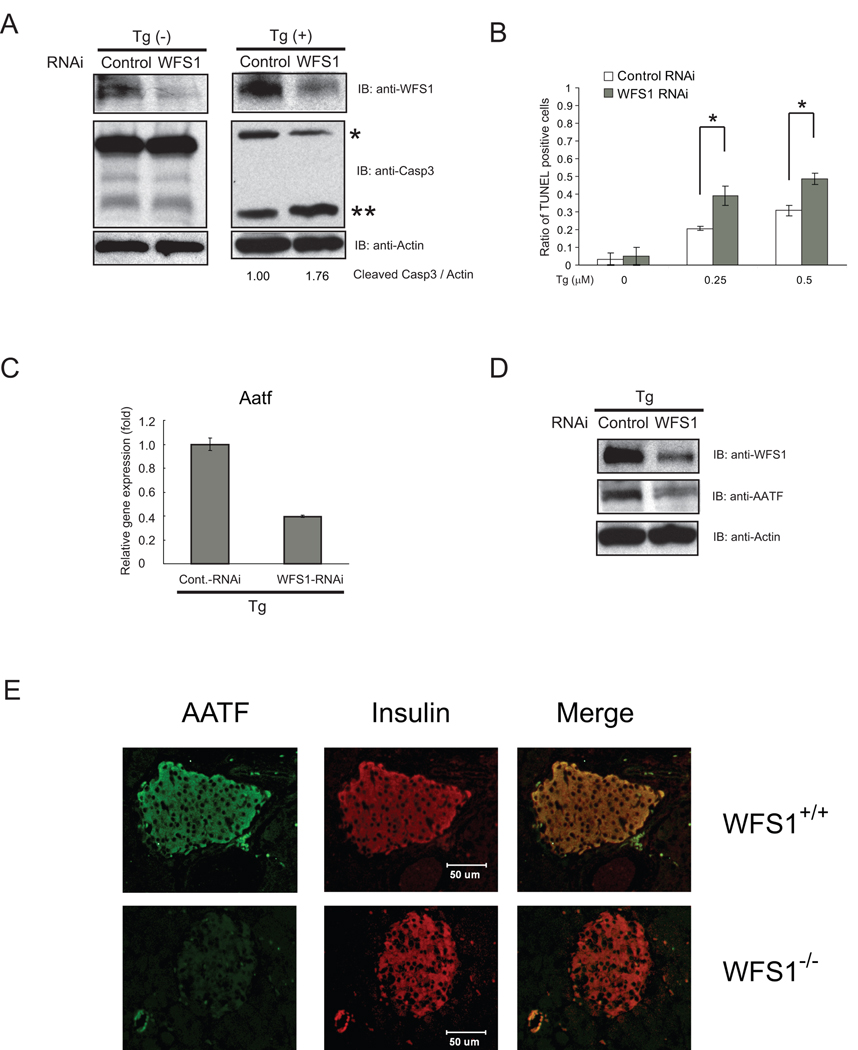
Several considerations raised the possibility that anti-apoptotic genes of the UPR might be transcriptionally downregulated in β-cells lacking WFS1. Previous studies have shown that WFS1-deficient β-cells are under chronic ER stress conditions and sensitive to ER stress-mediated cell death (10, 11). We have found that WFS1 knockdown β-cells are under chronic ER stress conditions (15). To confirm that knockdown of WFS1 in β-cells leads to ER stress-mediated cell death, INS-1 832/13 cells were transfected with siRNA directed against WFS1 and then challenged with an ER stress inducer thapsigargin. Apoptosis was measured by Caspase-3 cleavage and TUNEL staining. Consistent with previous findings, WFS1-knockdown β-cells were sensitive to ER stress-mediated cell death (Figure 1A and 1B).
Figure 1. AATF is downregulated in WFS1-deficient β-cells which are susceptible to ER stress-mediated apoptosis.
(A) INS1 832/13 cells were transfected with control scramble siRNA or siRNA directed against WFS1, then treated with or without thapsigargin (Tg, 0.5 µM) for 16 hr. Expression levels of caspase-3 (Casp3), WFS1, and actin were measured by immunoblot. Single and double asterisks indicate uncleaved and cleaved caspase-3, respectively. The ratio between cleaved caspase-3 and actin was measured using ImageJ software. (B) INS1 832/13 cell were transfected with control scramble siRNA or siRNA directed against WFS1, then treated with three different concentrations (0, 0.25, and 0.5 µM) of thapsigargin (Tg) for 24 hr. Apoptotic cells were detected by TUNEL staining (n = 3; values are mean ± SD). Statistics were done by two-way ANOVA. *(p < 0.01) denotes significant differences between cells transfected with control scramble siRNA and siRNA directed against WFS1. (C) INS1 832/13 cells were transfected with control scramble siRNA or siRNA directed against WFS1, then treated with thapsigargin (Tg, 1 µM) for 8 hr. Expression levels of Aatf were measured by real-time PCR (n = 3; values are mean ± SD). (D) Expression levels of AATF, WFS1, and actin proteins were measured by immunoblot on the same samples as in (C). (E) WFS1 −/− and wild type littermate mouse pancreata were analyzed by immunohistochemistry using anti-AATF and anti-insulin antibodies. Merged image shows the co-localization of AATF and insulin.
To examine the possible role of WFS1 in the activation of anti-apoptotic pathways, we first systematically identified genes that were differentially expressed in WFS1-knockdown INS-1 832/13 cells. Among 298 genes differentially expressed (p<0.01), transcriptionally downregulated genes were chosen as candidates for conferring resistance to ER stress-mediated cell death. These candidate genes were prioritized, first, on the magnitude of transcriptional downregulation and, second, on the basis of a known role in apoptosis. 12 genes were decreased by more than two-fold (Supplementary Table 1). Among these, we focused on AATF, which was significantly suppressed by WFS1-knockdown (Log 2 Ratio=−1.23) and had been reported to play a role in apoptosis (16–18).
We verified that AATF expression was downstream of WFS1. AATF mRNA and protein expression was downregulated in WFS1-knockdown INS-1 832/13 cells as compared to control cells both under ER stress conditions (Figure 1C and 1D) and normal conditions (data not shown). Furthermore, we found that AATF is highly expressed in mouse islets (Supplementary Figure 1A), whereas in WFS1 knockout mouse islets, AATF protein expression was markedly decreased as compared to control littermates (Figure 1E).
AATF is a component of the UPR
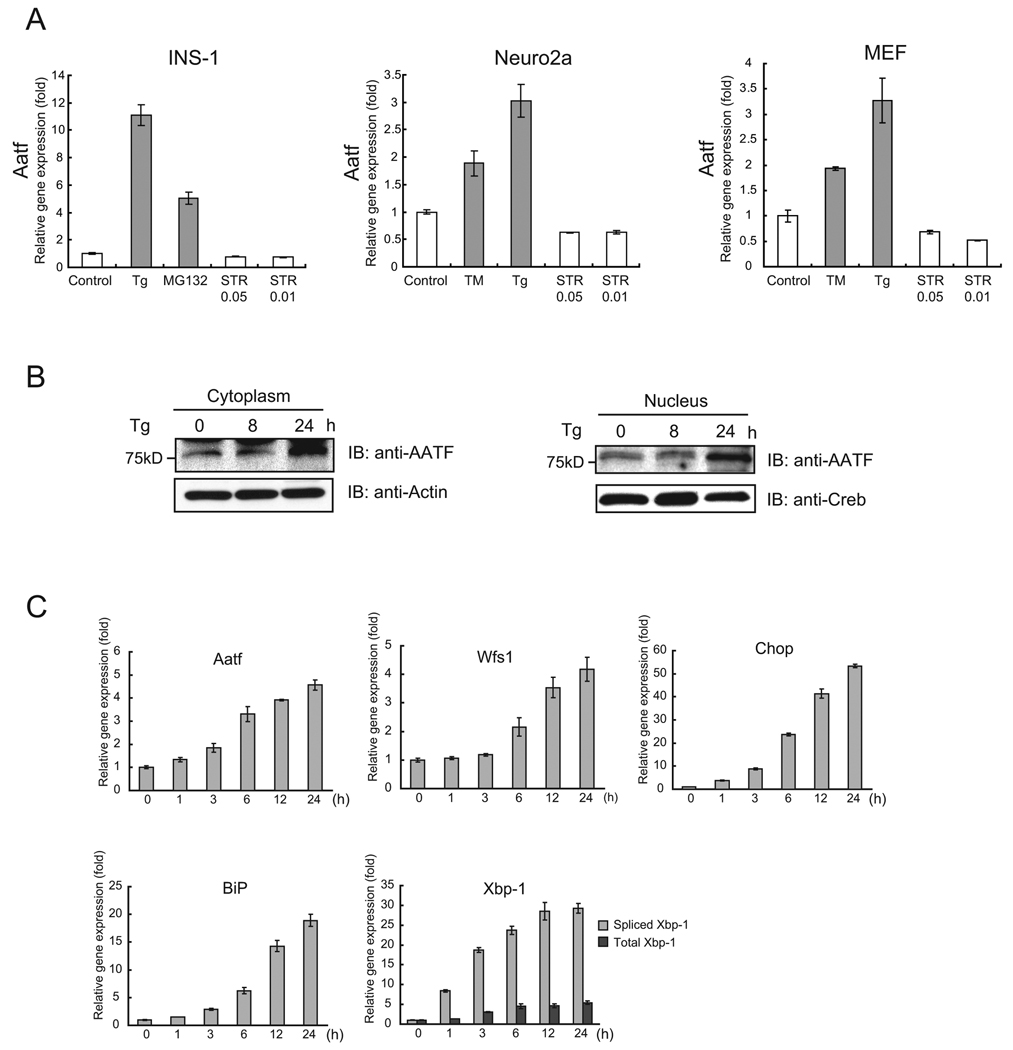
We next asked whether AATF could be a component of the UPR. We measured the expression levels of AATF mRNA in INS-1 832/13 cells, neuro2A cells, and mouse embryonic fibroblasts treated with various ER stress inducers. We found that AATF mRNA was upregulated by ER stress inducers, including tunicamycin, thapsigargin, and MG132, but not by a general apoptosis inducer, staurosporin, indicating that AATF expression is specifically increased by ER stress (Figure 2A). We confirmed the upregulation of AATF by ER stress using both cytoplasmic and nuclear protein extracts from INS-1 832/13 cells (Figure 2B). After treating these cells with thapsigargin, we compared the upregulation of AATF mRNA by ER stress to other ER stress markers, including BiP, Chop, XBP-1, and WFS1. We found that AATF mRNA expression continued to increase up to 24 hr after the initiation of ER stress (Figure 2C).
Figure 2. AATF is induced by ER stress.
(A) INS-1 832/13 cells, neuro2a cells, and mouse embryonic fibroblasts were treated with thapsigargin (Tg, 1 µM), MG132 (2 µM), tunicamycin (TM, 5 µg/ml), or staurosporin (STR, 0.05 µM and 0.01 µM) for 16 hr or untreated. Expression levels of Aatf were measured by real-time PCR (n = 3; values are mean ± SD). (B) INS-1 832/13 cells were treated with thapsigargin (Tg, 1 µM) for the indicated times (lower panel). Expression levels of Aatf and Creb were measured by immunoblot using cytoplasmic and nuclear extracts. (C) INS1 832/13 cells were treated with thapsigargin (Tg, 0.5 µM) for the indicated times. Expression levels of Aatf, Wfs1, Chop, BiP, and total and spliced Xbp-1 mRNA were measured by real-time PCR (n = 3; values are mean ± SD).
AATF expression is regulated by PERK-mediated eIF2α phosphorylation
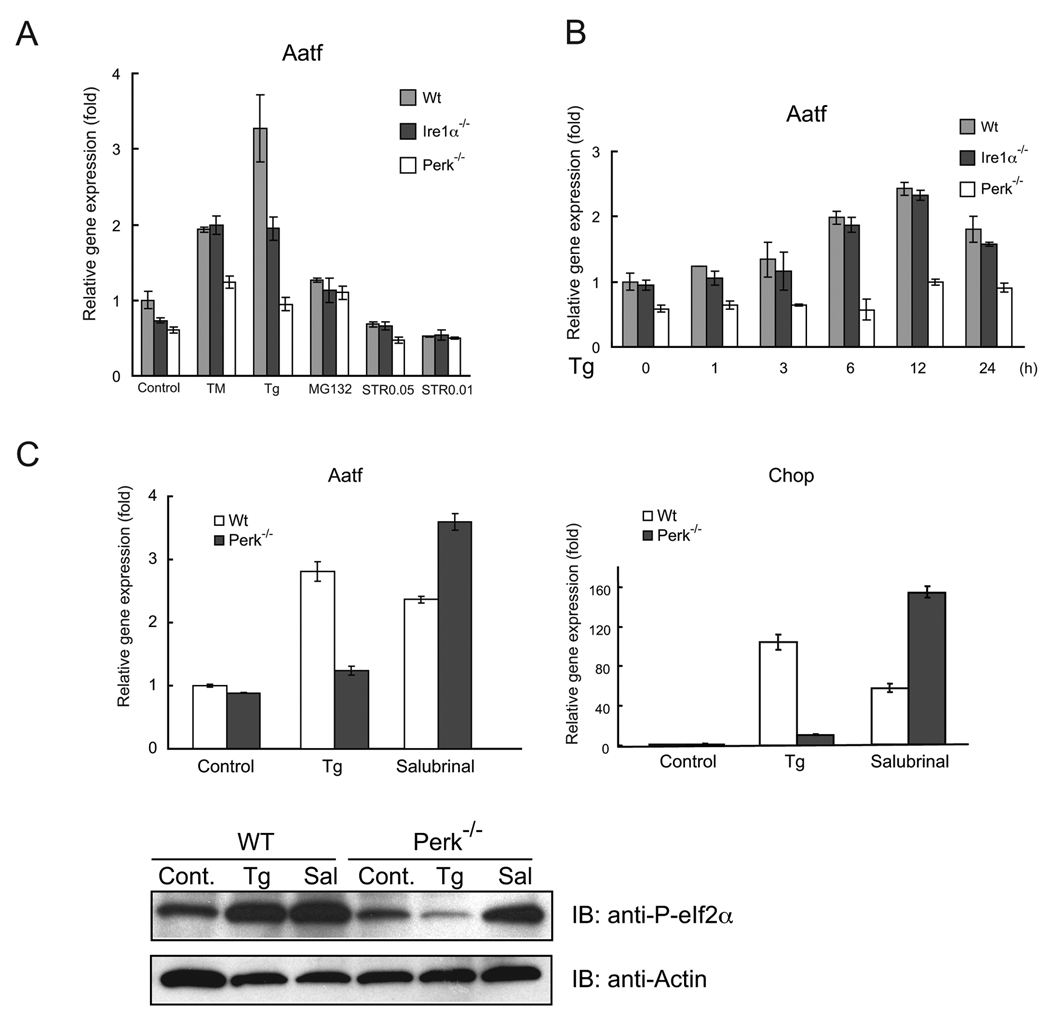
We next investigated the pathway by which AATF expression could be regulated. We measured the expression levels of AATF by real-time PCR in Ire1α−/− and Perk−/− mouse embryonic fibroblasts under ER stress conditions. IRE1α and PERK are ER-resident protein kinases and master regulators of the UPR. In wild-type fibroblasts, expression levels of AATF mRNA were increased 2–3 fold by tunicamycin and thapsigargin, whereas the induction of AATF was attenuated in Perk−/− mouse embryonic fibroblasts, but not in Ire1α−/− cells (Figure 3A and 3B). We also tested the involvement of ATF6, another upstream component of the UPR, in AATF expression using an siRNA approach. AATF induction was attenuated in Perk knockdown cells (Supplementary Figure 2A), but not in ATF6 knockdown cells (Supplementary Figure 2B). To confirm the role of PERK in AATF expression, we transfected Perk−/− mouse embryonic fibroblasts with a PERK expression plasmid, then measured AATF gene expression. We also measured Chop expression as a control. PERK expression could restore both AATF and Chop expression (Supplementary Figure 2C). These results indicate that PERK signaling regulates AATF expression.
Figure 3. AATF expression is regulated by PERK-mediated eIF2α phosphorylation.
(A) Wild-type (Wt), Ire1α−/−, and Perk−/− mouse embryonic fibroblasts were treated with tunicamycin (TM, 5 µg/ml), thapsigargin (Tg, 1 µM), or staurosporin (STR, 0.05 µM and 0.01 µM) for 16 hr or untreated. Expression levels of Aatf were measured by real-time PCR (n = 3; values are mean ± SD). (B) Wild type (Wt), Ire1α−/−, and Perk−/− mouse embryonic fibroblasts were treated with thapsigargin (Tg, 1 µM) at different times. Expression levels of Aatf were measured by real-time PCR (n = 3; values are mean ± SD). (C) Wild-type (Wt) and Perk−/− mouse embryonic fibroblasts were treated with thapsigargin (Tg, 1 µM) or Salubrinal (Sal, 75 nM) for 16 hr. Expression levels of Aatf (left panel) and Chop (right panel) were measured by real-time PCR (n = 3; values are mean ± SD). Expression levels of phosphorylated eIf2α and actin were measured by immunoblot.
It is well established that PERK-mediated eIF2α phosphorylation is important in the upregulation of its target genes (19, 20). We were therefore interested in determining whether eIF2α phosphorylation could increase AATF expression. We treated wild-type and Perk−/− mouse fibroblasts with salubrinal, a compound that increases eIF2α phosphorylation (21), then measured AATF expression. We also measured Chop expression as a control. As expected, AATF expression, as well as Chop expression, was increased by salubrinal treatment in both wild-type and Perk−/− mouse embryonic fibroblasts (Figure 3C).
AATF protects cells from ER stress-mediated apoptosis
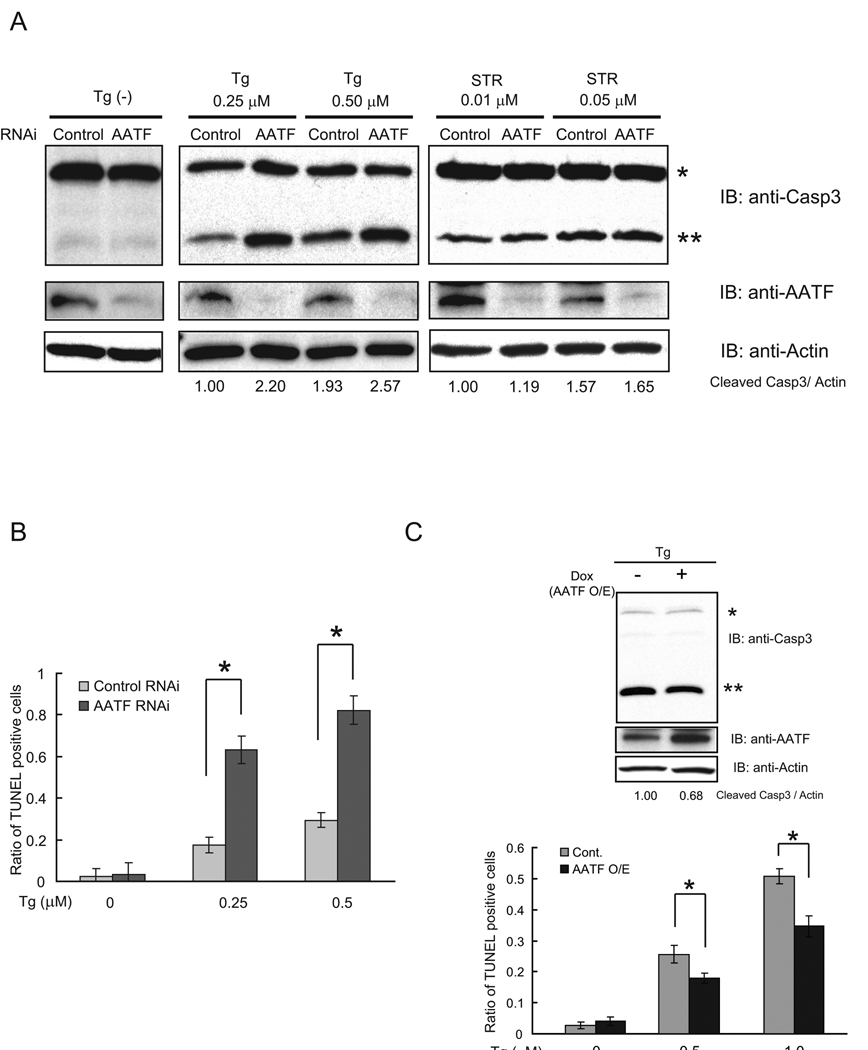
We next examined the ability of AATF to protect cells from ER stress-mediated apoptosis. We transfected INS-1 832/13 cells with siRNA directed against AATF, then challenged the cells with thapsigargin or staurosporin and measured the cleavage of caspase-3. As compared to control cells, cells transfected with siRNA directed against AATF showed increased cleavage of caspase-3 by thapsigargin (Figure 4A, center panel), but not staurosporin (Figure 4A, right panel), demonstrating that inactivation of AATF rendered cells specifically sensitive to ER stress-mediated apoptosis. To confirm this, we measured apoptosis in AATF-knockdown cells using TUNEL staining. Figure 4B shows that AATF suppression increased the number of TUNEL-positive cells in the presence of ER stress. We next asked whether AATF overexpression would render INS-1 832/13 cells resistant to ER stress-mediated apoptosis. As expected, AATF induction using a doxycycline-induced expression system decreased caspase-3 cleavage by thapsigargin (Figure 4C, upper panel). To confirm this, we measured apoptosis in these cells using TUNEL staining. Figure 4C (lower panel) shows that AATF induction decreased the number of TUNEL-positive cells.
Figure 4. AATF is an anti-apoptotic component of ER stress signaling.
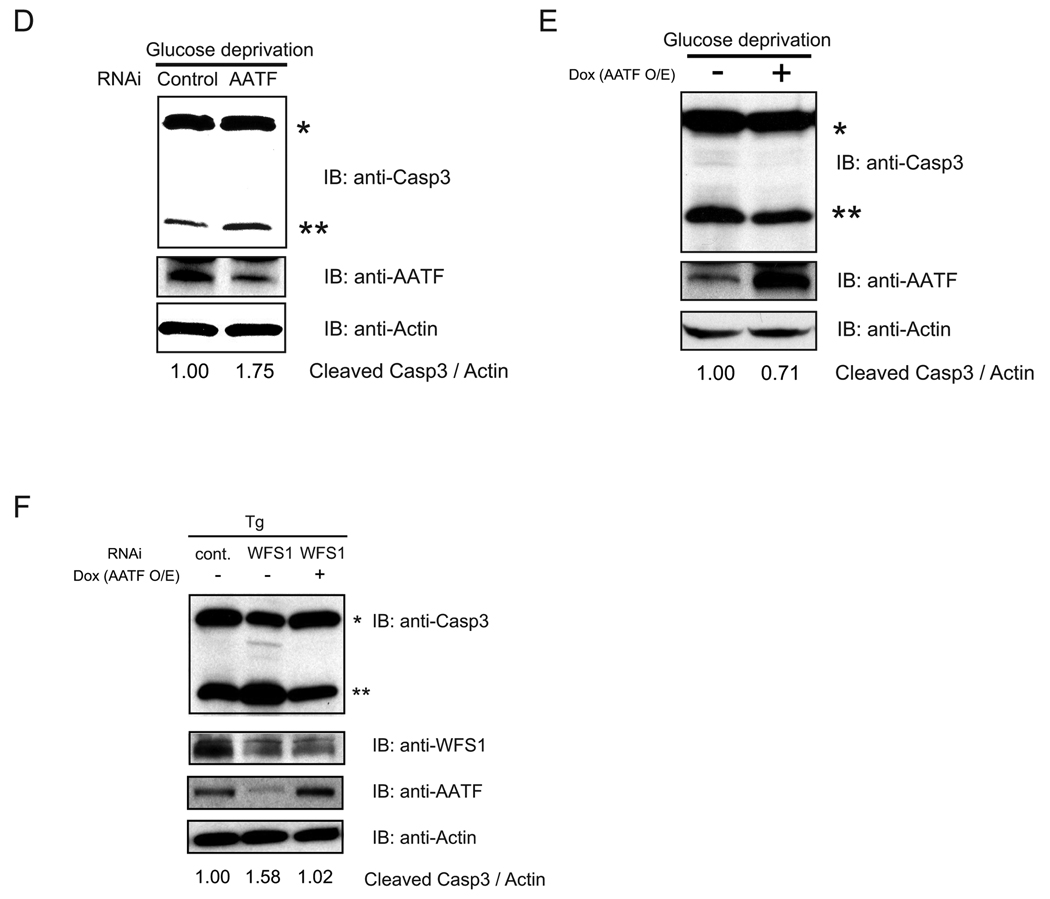
(A) INS1 832/13 cells were transfected with control scramble siRNA or siRNA directed against AATF, then treated with or without thapsigargin (Tg, 0.25 µM and 0.5 µM) or staurosporin (STR) for 16 hr. Expression levels of caspase-3 (Casp3), AATF, and actin were measured by immunoblot. Single and double asterisks indicate uncleaved and cleaved caspase-3, respectively. The ratio between cleaved caspase-3 and actin was measured using ImageJ software. (B) INS1 832/13 cell were transfected with control scramble siRNA or siRNA directed against AATF, then treated with three different concentrations (0, 0.25, and 0.5 µM) of thapsigargin (Tg) for 24 hr. Apoptotic cells were detected by TUNEL staining (n = 3; values are mean ± SD). Statistics were done by two-way ANOVA. *(p < 0.01) denotes significant differences between cells transfected with control scramble siRNA and siRNA directed against AATF. (C) INS-1 832/13 cells were stably transduced with LV-TO/AATF, an inducible lentivirus expressing AATF. Cells were cultured with doxycycline (2 µg/ml) to induce AATF or without doxycycline for 48 hr, then challenged with thapsigargin (Tg, 0.5 µM) for 16hr. Expression levels of caspase-3 (Casp3), AATF, and actin were measured by immunoblot. Single and double asterisks indicate uncleaved and cleaved caspase-3, respectively. The ratio between cleaved caspase-3 and actin was measured using ImageJ software (upper panel). Cells were cultured with doxycycline (2 µg/ml) to induce AATF (AATF O/E) or without doxycycline (Cont) for 48 hr, then challenged with three different concentrations of thapsigargin (0, 0.5, and 1.0 µM) for 24 hr. Apoptotic cell death was assessed by the TUNEL assay (n = 3; values are mean ± SD) Statistics were done by two-way ANOVA. *(p < 0.01) denotes significant differences between cells with and without doxycycline (lower panel). (D) INS-1 832/13 cells were transfected with control scramble siRNA (Control) or siRNA directed against AATF, then cultured in glucose-free media for 48 hr. Expression levels of caspase-3 (Casp3), AATF, and actin were measured by immunoblot. Single and double asterisks indicate uncleaved and cleaved caspase-3, respectively. The ratio between cleaved caspase-3 and actin was measured using ImageJ software. (E) INS1 832/13 cells were stably transduced with LV-TO/AATF, an inducible lentivirus expressing AATF. Cells were cultured with doxycycline (2 µg/ml) to induce AATF or without doxycycline (2 µg/ml) for 48 hr, then cultured in glucose-free media for 48 hr. Expression levels of caspase-3 (Casp3), AATF, and actin were measured by immunoblot. Single and double asterisks indicate uncleaved and cleaved caspase-3, respectively. The ratio between cleaved caspase-3 and actin was measured using ImageJ software. (F) INS-1 832/13 cells were stably transduced with LV-TO/AATF, an inducible lentivirus expressing mouse AATF. Cells were cultured with doxycycline (2 µg/ml) to induce AATF or without doxycyclin for 48 hr, then challenged with thapsigargin (Tg, 0.5 µM) for 16 hr. Cells were also transfected with control, scramble siRNA (Cont) or siRNA against WFS1. Expression levels of caspase-3 (Casp3), AATF, WFS1, and actin were measured by immunoblot. Single and double asterisks indicate uncleaved and cleaved caspase-3, respectively. The ratio between cleaved caspase-3 and actin was measured using ImageJ software.
We next sought to verify that AATF had a function in protecting cells from ER stress-mediated apoptosis using a more physiological ER stress inducer, glucose deprivation (22). We predicted that glucose deprivation could cause ER stress and AATF upregulation. To confirm this idea, we cultured INS-1 832/13 cells in glucose-free media, then measured expression levels of Chop and AATF, as well as capase-3 cleavage. We found that glucose deprivation increased Chop and AATF expression, as well as caspase-3 cleavage, indicating that glucose deprivation induces ER stress-mediated apoptosis (Supplementary Figure 3). We then challenged AATF-knockdown INS-1 832/13 cells with glucose deprivation. AATF-knockdown sensitized INS-1 832/13 cells to glucose deprivation-mediated apoptosis (Figure 4D). On the other hand, ectopic expression of AATF using doxycycline-mediated induction decreased caspase-3 cleavage by glucose deprivation (Figure 4E).
To determine whether AATF overexpression could rescue cells from apoptosis caused by the suppression of WFS1, we transfected AATF-inducible INS-1 832/13 cells with control scramble siRNA or siRNA directed against WFS1. We then challenged these cells by thapsigargin treatment with or without the induction of AATF, and measured caspase-3 cleavage. Figure 4F shows that AATF induction could rescue ER stress-mediated apoptosis caused by the suppression of WFS1. Collectively, these results indicate that AATF functions in protecting cells from ER stress-mediated apoptosis.
Akt1 is a downstream target of AATF
AATF has an L-zip domain in the N-terminal, followed by two nuclear localization signals in the C-terminal and has been proposed to function in transcriptional regulation (16, 18). Indeed, AATF was mainly localized to the nucleus and the nucleolus in the cell (Supplemental Figure 4). To identify transcriptional targets of AATF, we compared gene expression profiles of AATF-knockdown INS-1 832/13 cells and INS-1 832/13 cells transfected with scramble siRNA following treatment with thapsigargin for 8 hr. Genes that were significantly downregulated (p < 0.01) more than two-fold by AATF siRNA were defined as potential AATF targets under ER stress conditions. Seven target genes were identified (Supplementary Table 2). One of the target genes identified was the serine/threonine kinase, Akt1, which is well known for its role in promoting cell survival under various conditions (23, 24).
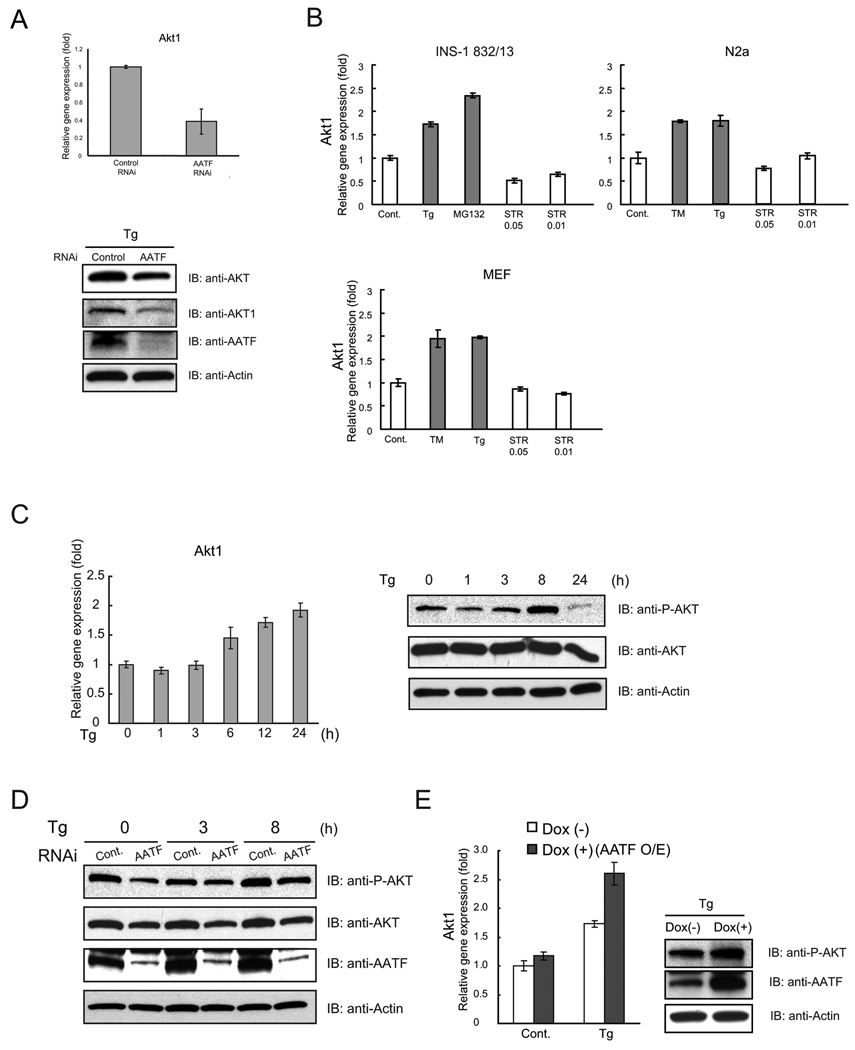
We confirmed that AATF-knockdown by siRNA suppressed Akt1 mRNA and protein expression (Figure 5A). We also confirmed that AATF-knockdown decreased mRNA expression levels of the other six target genes (Supplementary Figure 5A). We next asked whether Akt1 expression was increased by ER stress. We measured the expression levels of Akt1 mRNA in the presence of ER stress in INS-1 832/13, neuro2A, and mouse embryonic fibroblasts. Figure 5B shows that Akt1 mRNA expression was increased 1.5–2 fold by various ER stress inducers, including tunicamycin, thapsigargin, and MG132, but not staurosporin. Measuring Akt1 mRNA expression at different times under ER stress conditions, we found that Akt1 expression was increased during ER stress, with a peak at 24 hr (Figure 5C, left panel). Collectively, these results indicate that Akt1 is a target for AATF in the presence of ER stress.
Figure 5. Akt1 is a downstream target of AATF.
(A) INS1 832/13 cells were transfected with scramble siRNA (control) or siRNA directed against AATF, and then challenged with thapsigargin (Tg, 1 µM) for 8 hr. Expression levels of Akt1 mRNA were measured by real-time PCR (n = 3; values are mean ± SD) (upper panel). Expression levels of total AKT (AKT), AKT1, AATF, and actin were measured by immunoblot (lower panel). (B) INS1 832/13 cells, neuro2a (N2a) cells, and mouse embryonic fibroblasts (MEF) were treated with thapsigargin (Tg, 1 µM), MG132 (2 µM), tunicamycin (TM, 5 µg/ml), or staurosporin (STR, 0.05 µM and 0.01 µM) for 16 hr or untreated. Expression levels of Akt1 were measured by real-time PCR (n = 3; values are mean ± SD) (C) INS1 832/13 cells were treated with thapsigargin (Tg, 1 µM) for the indicated times. Expression levels of Akt1 mRNA were measured by real-time PCR (n = 3; values are mean ± SD) (left panel). Expression levels of phosphorylated AKT (P-AKT), total AKT (AKT), and actin were also measured by immunoblot (right panel). (D) INS1 832/13 cells were transfected with scramble siRNA (control) or siRNA directed against AATF, then treated with thapsigargin (Tg) (0.5 µM) for the indicated times. Expression levels of phosphorylated AKT (P-AKT), total AKT (AKT), AATF, and actin were measured by immunoblot. (E) INS1 832/13 cells were stably transduced with LV-TO/AATF, an inducible lentivirus expressing AATF. Cells were cultured with or without doxycycline (Dox, 2 µg/ml) to induce AATF for 48 hr, then challenged with thapsigargin (Tg, 0.5 µM) for 16 hr. Expression levels of Akt1 mRNA were measured by real-time PCR (n = 3; values are mean ± SD) (left panel). Expression levels of phosphorylated AKT (P-AKT), AATF, and actin were also measured by immunoblot (right panel).
It has been proposed that phosphorylation of Akt is important in protecting β-cells from apoptosis (25). We were therefore interested in measuring the phosphorylation levels of Akt at different times after thapsigargin treatment. We found that the phosphorylation level of Akt was increased up to 8 hr after treatment, but decreased at 24 hr (Figure 5C, right panel) as seen in previous reports (25, 26). To study the relationship between AATF suppression and Akt phosphorylation, we suppressed AATF expression using siRNA directed against AATF in INS-1 832/13 cells, treated the cells with thapsigargin for 0, 3, and 8 hr, then measured Akt expression and Akt phosphorylation levels by immunoblot. Both Akt expression and Akt phosphorylation levels were decreased by AATF siRNA (Figure 5D). To further confirm the relationship between AATF and Akt1 expression, we generated an inducible lentivirus system expressing the AATF gene. We infected INS-1 832/13 cells with the virus and measured Akt1 expression levels, finding that AATF overexpression enhanced Akt1 mRNA expression under ER stress conditions, leading to an increase in Akt phosphorylation (Figure 5E).
Regulation of Akt1 expression through the AATF-Stat3 complex
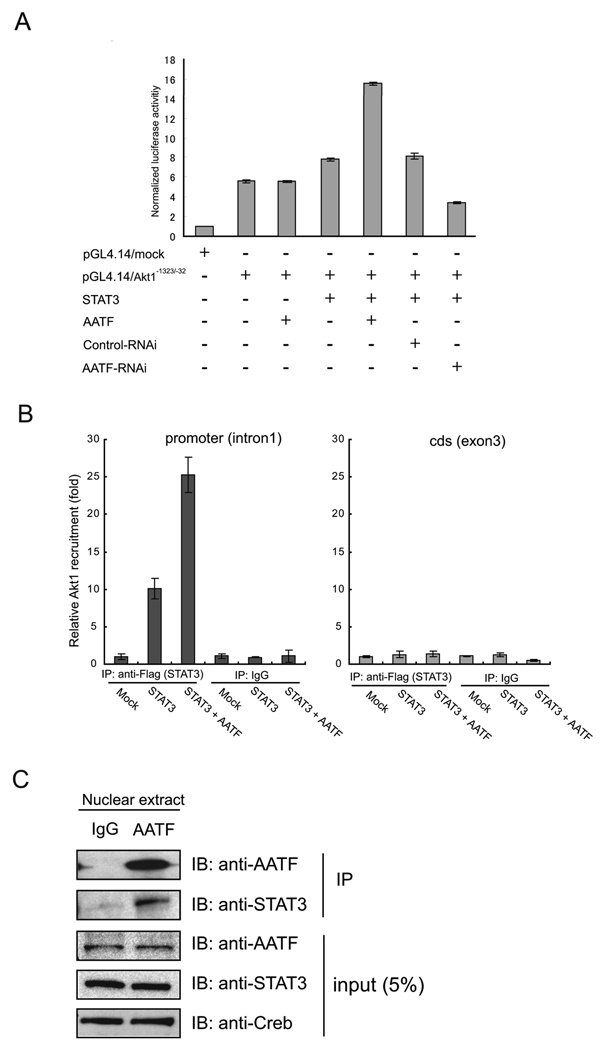
Stat3 has been proposed to play an important role in Akt1 expression (27, 28), raising the possibility that Stat3 is involved in AATF-mediated induction of Akt1. A plasmid expressing constitutively active Stat3 with or without AATF was co-transfected into neuro2A cells along with a reporter plasmid containing 1.3 kilo bases of the Akt1 promoter driving the luciferase gene, which showed the highest induction of Akt1 promoter activity by Stat3 among the promoter fragments with different length (Supplementary Figure 6). Stat3 expression caused 1.4-fold induction of luciferase activity (Figure 6A, lane 4), and siRNA-mediated knockdown of AATF abrogated this induction (Figure 6A, lane 7). The addition of AATF to Stat3 led to a 2.8-fold induction of luciferase activity (Figure 6A, lane 5). Chromatin immunoprecipitation (ChIP) analysis verified that Stat3 binding to the Akt1 promoter was enhanced in response to AATF expression (Figure 6B). The data of Figure 6A and Figure 6B predict that Stat3 and AATF should interact in the nucleus. Consistent with this prediction, Figure 6C shows that Stat3 and AATF interact in the nucleus.
Figure 6. Regulation of Akt1 expression through the AATF-Stat3 complex.
(A) Luciferase activity in neuro2a cells transfected with AKT1 (pGL4.14/Akt1−1323/−1) or control promoter constructs, plus vectors expressing the indicated proteins or siRNA directed against AATF (n = 3; values are mean ± SD). (B) Quantified ChIP analysis using real-time PCR was performed. Relative recruitment was defined as the ratio of amplification of the PCR product relative to 1% of input genomic DNA. Value obtained from mock was defined as 1 (n = 3; values are mean ± SD). (C) Nuclear fraction of HEK293T cells were extracted and applied for immunoprecipitation using an anti-AATF antibody. Immunoprecipitated samples and 5% inputs were blotted with indicated antibodies.
The AATF-AKT1 pathway protects cells from ER stress-mediated apoptosis
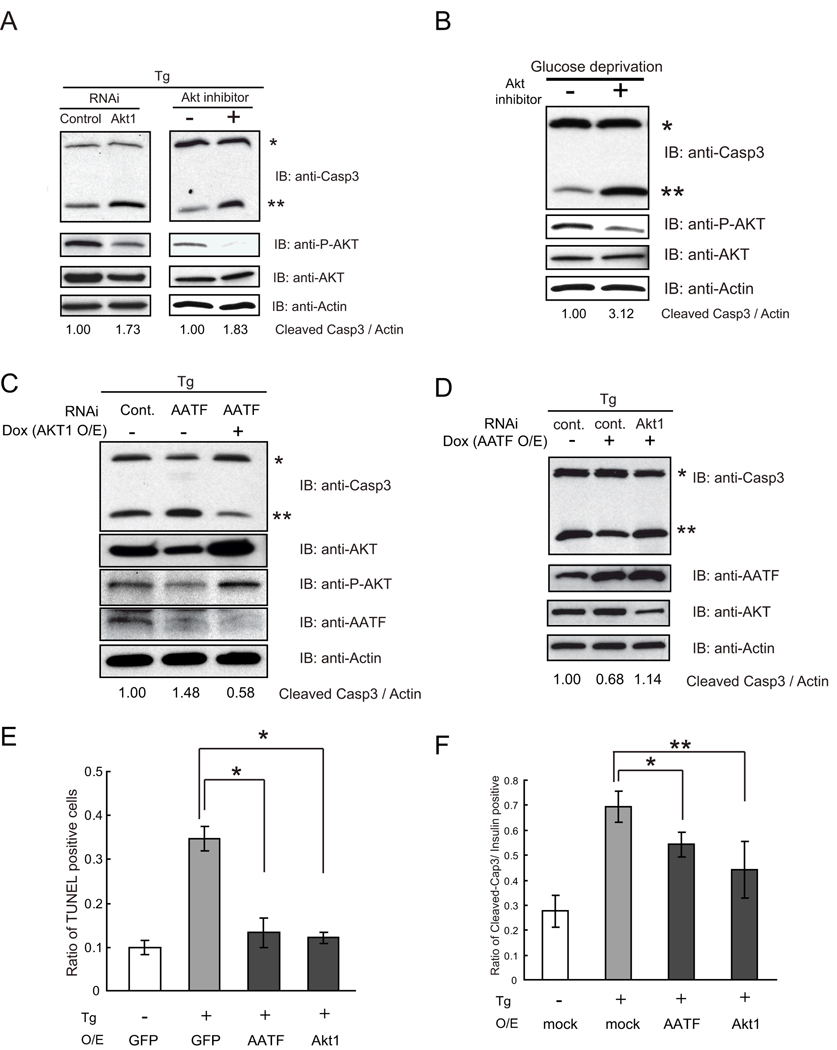
To study the involvement of the AATF-AKT1 pathway in protecting cells from ER stress-mediated apoptosis, we suppressed the AKT1 pathway in INS1 832/13 cells using siRNA directed against Akt1 (Figure 7A, left panel) or an Akt inhibitor, SH-5, (Figure 7A, right panel). We then challenged these cells with thapsigargin and measured the cleavage of caspase-3. Both Akt1 siRNA and the Akt inhibitor increased cleavage of caspase-3, indicating that Akt1 gene expression and its phosphorylation have a role in protecting cells from ER stress-mediated apoptosis (Figure 7A). We also suppressed expression of the other six target genes in INS1 832/13 cells using siRNAs directed against them (Supplementary Figure 7A), then challenged these cells with thapsigargin and measured the cleavage of caspase-3 (Supplementary Figure 7B). Only the suppression of Akt1 had a significant effect on apoptosis in the cells challenged with thapsigargin. To study the involvement of the Akt1 pathway in protecting cells from apoptosis mediated by glucose deprivation, we blocked the Akt1 pathway in INS1 832/13 cells using an Akt inhibitor, SH-5, then challenged the cells with glucose deprivation and measured the cleavage of caspase-3. Akt1 inhibitor treatment increased the cleavage of caspase-3 (Figure 7B). To determine whether Akt1 overexpression can rescue cells from apoptosis caused by the suppression of AATF, we transfected INS-1 832/13 cells with control siRNA or siRNA against AATF. We then challenged these cells with or without the induction of Akt1, using the lentivirus-based doxycycline-mediated Akt1 induction system, and measured caspase-3 cleavage. Figure 7C shows that Akt1 induction could rescue ER stress-mediated apoptosis caused by the suppression of AATF. To further confirm the role of Akt1 in protecting cells from ER stress-mediated apoptosis, we suppressed Akt1 gene expression by RNAi in INS-1 832/13 cells ectopically expressing AATF and measured caspase-3 cleavage. As we expected, RNAi-mediated knockdown of Akt1 cancelled out the anti-apoptotic effect of AATF and made the cells sensitive to ER stress-mediated apoptosis (Figure 7D).
Figure 7. The AATF-AKT1 pathway protects cells from ER stress-mediated apoptosis.
(A) INS1 832/13 cells were transfected with control scramble siRNA or siRNA against Akt1, then treated with 0.5 µM of thapsigargin (Tg) for 16 hr (left panel). INS1 832/13 cells were pretreated with 10 nM of Akt inhibitor (SH-5) or equivalent amount of DMSO (control) for overnight, then treated with 0.25 µM of thapsigargin (Tg) for 16 hr (right panel). Expression levels of caspase-3 (Casp3), phosphorylated AKT (P-AKT), total AKT (AKT), and actin were measured by immunoblot. Single and double asterisks indicate uncleaved and cleaved caspase-3, respectively. The ratio between cleaved caspase-3 and actin was measured using ImageJ software. (B) INS-1 832/13 cells were pretreated with 10 nM of Akt inhibitor (SH-5) or equivalent amount of DMSO overnight, then cultured in glucose-free media for 48 hr. Expression levels of caspase-3 (Casp3), phosphorylated AKT (P-AKT), total AKT (AKT), and actin were measured by immunoblot. Single and double asterisks indicate uncleaved and cleaved caspase-3, respectively. The ratio between cleaved caspase-3 and actin was measured using ImageJ software. (C) INS-1 832/13 cells were stably transduced with LV-TO/Akt1, an inducible lentivirus expressing the active form of Akt1. Cells were cultured with or without doxycycline (4 ng/ml) to induce Akt1 for 48 hr, then challenged with thapsigargin (Tg, 0.5 µM) for 16hr. Cells were also transfected with control scramble siRNA (Cont) or siRNA against AATF. Expression levels of caspase-3 (Casp3), total AKT (AKT), phosphorylated AKT (P-AKT), AATF, and actin were measured by immunoblot. Single and double asterisks indicate uncleaved and cleaved caspase-3, respectively. The ratio between cleaved caspase-3 and actin was measured using ImageJ software. (D) INS-1 832/13 cells were stably transduced with LV-TO/AATF, an inducible lentivirus expressing AATF. Cells were cultured with or without doxycycline (2 µg/ml) to induce AATF for 48 hr, then challenged with thapsigargin (Tg, 0.5 µM) for 16hr. Cells were also transfected with control scramble siRNA (Cont) or siRNA against Akt1. Expression levels of caspase-3 (Casp3), AATF, total AKT (AKT), and actin were measured by immunoblot. Single and double asterisks indicate uncleaved and cleaved caspase-3, respectively. The ratio between cleaved caspase-3 and actin was measured using ImageJ software. (E) Mouse primary islets were infected with LV-TO/AATF (AATF), LV-TO/Akt1 (Akt1), and LV-TO/GFP (GFP), lentiviruses expressing AATF, active form of Akt1, and GFP, respectively. GFP signals were positive in all the viable islets at 2 days after infection (Supplementary Figure 7A). Islets were then treated with thapsigargin (Tg, 0.5 µM) for 6 hr. Apoptotic cells were detected by TUNEL staining (n = 4; values are mean ± SD). Statistics were done by one-way ANOVA. *(p < 0.01) denotes significant differences between cells infected with GFP and AATF or Akt1. (F) Mouse primary islets were infected with LV-TO/AATF (AATF), LV-TO/Akt1 (Akt1), and empty LV-TO (mock) virus. Islets were then treated with thapsigargin (Tg, 0.5 µM) for 6hr. After dispersion, cells were fixed and stained with anti-cleaved caspase-3 and anti-insulin antibodies as shown in Supplementary Figure 7C. The ratio of cells with cleaved-caspase-3 signals to those with insulin signals was calculated (n = 4; values are mean ± SD). Statistics were done by one-way ANOVA. *(p < 0.05) and **(p < 0.01) denote significant differences between cells infected with mock, AATF, or Akt1, respectively.
To confirm and extend these observations, we tested whether ectopic expression of AATF and Akt1 could protect primary mouse islets from ER stress-mediated apoptosis. We derived lentivirus expressing AATF, a constitutively active form of Akt1, and GFP as a control, transduced primary islets with the virus and then challenged them with thapsigargin. We confirmed efficient transduction of primary islets by monitoring GFP expression and measuring AATF and Akt1 mRNA expression levels (Supplementary Figure 8A and 8B). Apoptosis was analyzed by TUNEL staining. Ectopic expression of AATF and Akt1 protected primary islets from ER stress-mediated cell death (Figure 7E). This result was confirmed by analyzing caspase-3 cleavage (Figure 7F and Supplementary Figure 8C).
Crosstalk between the WFS1 and AATF signaling pathways mediates a self-perpetuating cycle of cell death in WFS1-deficient cells
We compared gene expression profiles of WFS1-knockdown and AATF knockdown cells followed by treatment with thapsigargin. Of particular interest are genes whose expression profiles are the same in both WFS1-knockdown and AATF-knockdown cells. Expression of 5 probes (4 known genes and 1 unknown locus) decreased in both WFS1-knockdown and AATF-knockdown cells (Supplementary Table 3). Expression of 46 probes decreased in AATF-knockdown cells and expression of 276 probes decreased in WFS1-knockdown cells as compared to control cells transfected with scramble siRNA. Thus, the probability to have 5 common probes decreased in both WFS1-knockdown and AATF-knockdown cells is 3.22e-06 using hypergeometric test. Expression of two known genes increased in both WFS1-knockdown and AATF-knockdown cells (Supplementary Table 3). Expression of 33 genes increased in AATF-knockdown cells and expression of 22 genes increased in WFS1-knocdown cells as compared to control cells transfected with scramble siRNA. Thus, the probability to have 2 common probes increased in both WFS1-knockdown and AATF-knockdown cells is 6.91e-08. These results raised the possibility that there exists substantial crosstalk between the WFS1 and AATF signaling pathways.
To confirm this possibility, we measured Akt1 gene expression in WFS1-knockdown cells and control cells treated with thapsigargin. As we predicted, Akt1 gene expression was decreased in WFS1-knockdown cells as compared to control cells (Supplementary Figure 9A). We could restore Akt1 gene expression by introducing AATF in WFS1-knockdown cells (Supplementary Figure 9B).
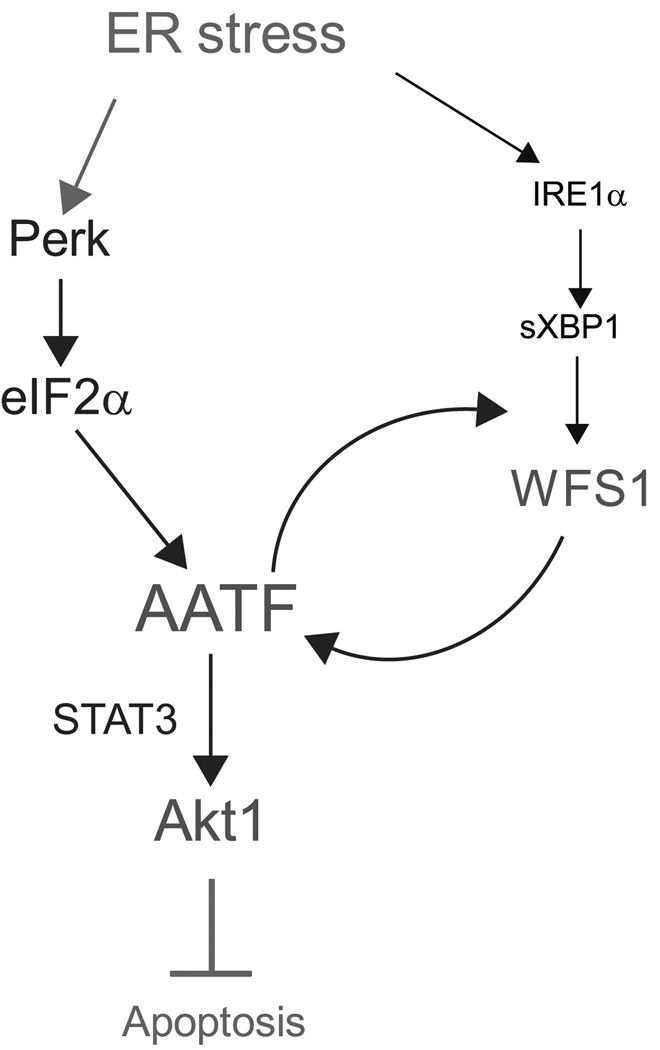
Gene expression profiling revealed that expression of WFS1 was decreased in AATF-knockdown cells (Supplementary Table 3). Quantitative real-time PCR and immunoblot confirmed this result (Supplementary Figure 9C). It has been shown that XBP-1 is important in activating the WFS1 promoter (29, 30). We therefore considered the possibility that the addition of AATF expression to XBP-1 expression can enhance WFS1 promoter activity. To test this idea, we cotransfected WFS1-promoter reporter plasmid and the active form of XBP-1 expression plasmid with or without AATF expression plasmid into neuro2a cells. As we predicted, the addition of AATF expression plasmid enhanced the induction of luciferase activity (Supplementary Figure 9D). Collectively, these results indicate that there exists substantial positive crosstalk between the WFS1 and AATF signaling pathways and lack of WFS1 mediates a self-perpetuating cycle of cell death (Figure 8).
Figure 8. The AATF-Akt1 pathway protects cells from ER stress-mediated apoptosis.
Proposed pathway that protects cells from ER stress-mediated cell death.
Discussion
Through the gene expression profiling of β-cells lacking WFS1, we have discovered a novel anti-apoptotic gene of the UPR, AATF. On the basis of the results in this study, we propose the following model for the anti-apoptotic activities elicited by AATF in response to ER stress (Figure 8). We have found that AATF is induced by PERK signaling and transcriptionally activates the Akt1 gene with Stat3, which confers on cells resistance to ER stress. We also found that there exists positive crosstalk between the AATF and WFS1 signaling pathways, WFS1-deficiency or AATF-deficiency mediates a self-perpetuating cycle of cell death.
Previous studies have shown that the UPR activates death pathways under ER stress conditions (4–7). However, the characterization of anti-apoptotic activities in the UPR is currently incomplete (4). Our discovery of anti-apoptotic programs regulated by AATF provides evidence that the UPR directly activates both survival and death pathways. During physiological ER stress induction, survival pathway activation outweigh death pathway activation, whereas during chronic unresolvable ER stress conditions, death pathway activation dominates that of survival pathways. The mechanisms of this switch from physiology to pathology may be regulated by AATF expression.
AATF has been shown to have a function in the DNA damage response, in which AATF promotes cell proliferation by regulating transcription of prosurvival factors such as p53 and XIAP (31, 32). We have identified Akt1 as an AATF targeted gene that protects cells from ER stress-mediated cell death. We found that AATF induces Akt1 together with Stat3 under ER stress conditions. Based on our findings and previous studies (31, 32), we propose that AATF functions as a transcription co-factor regulating pro-survival genes upon certain cellular stress conditions.
Puma and Bim, members of BH-3 proteins, have been implicated in contributing to apoptotic signaling downstream of ER stress (33, 34). Akt has been shown to be involved in regulating both Puma and Bim in certain cell types (35, 36), raising the possibility that Puma and Bim expression would be regulated by AATF or WFS1. However, Puma or Bim expression was not affected in INS-1 832/13 cells transfected with siRNA directed against WFS1 or AATF (Supplementary Figure 10), indicating that AATF-Akt1 signaling is not involved in the regulation of Puma and Bim.
Akt activation and the following signaling cascade have been shown to be involved in ER stress-mediated apoptosis in various cells including pancreatic β-cells (25, 26). Most of reports emphasized that the state of AKT phosphorylation regulates its survival function. It is possible that increasing AKT1 by itself may not increase survival. Nevertheless, increased AKT1 could contribute to survival signaling mediated by another agent induced by ER stress that increases AKT1 phosphorylation. We clearly showed that AATF depletion diminished not only Akt1 gene expression but also AKT phosphorylation in β-cells, indicating that transcriptional regulation of Akt1 gene is also important for sustaining its functional activity. Further studies will be required to completely understand the mechanisms by which Akt1 protects cells from ER stress-mediated apoptosis.
We have found that there is crosstalk between the WFS1 and AATF signaling pathways. Because WFS1-deficiency attenuates AATF-Akt1 signaling and causes cell death, a self-perpetuating cycle of cell death might be involved in the progression of β-cell death in Wolfram syndrome.
Increasing evidence indicates that chronic ER stress plays a role in the pathogenesis of various diseases including diabetes mellitus (37–39). Chronic unresolvable ER stress leads to cellular dysfunction and the activation of cell-death pathways. Therefore, a more precise understanding of the anti-apoptotic programs in the UPR may lead to the development of new treatments for diseases caused by chronic ER stress. Thus, the cell signaling pathway regulated by the AATF-Akt1 pathway may be a useful target for the treatment of diseases caused by ER stress-mediated cell death.
Materials and methods
Cell culture and transfection of small interfering RNA
Rat insulinoma cells, INS-1 832/13, were a gift from Dr. Christopher Newgard (Duke University Medical Center). These cells were cultured in RPMI 1640 supplemented with 10% FBS. Mouse embryonic fibroblasts and neuro2a cells were maintained in DMEM with 10% fetal bovine serum. Ire1α−/− and Perk−/− fibroblasts were a gift from Dr. David Ron (New York University School of Medicine).
The Nucleofector Device (Amaxa Biosystems, Gaithersburg, MD) was used to transfect small interfering RNA (siRNA) directed against WFS1, AATF, and Akt1 into INS1 832/13 cells. At QIAGEN (Valencia, CA), siRNAs directed against rat WFS1, AATF, and Akt1 were designed and synthesized: rat WFS1, AAGGCATGAAGGTCTACAATT; for rat AATF, AAGCGCTCTGCCTACCGAGTT and for rat Akt1, AACGCCTGAGGAGCGGGAAGA. Cells were incubated in media overnight after siRNA transfection and then additional treatments were performed, including ER stress induction. For plasmid transfection into neuro2a cells, we used Lipofectamine 2000 (Invitrogen, Carlsbad, CA), and for plasmid transfection into mouse embryonic fibroblasts, we used the Nucleofector Device (Amaxa Biosystems).
GeneChip Array Analysis
INS-1 832/13 cells were transfected with siRNA against WFS1 or AATF as well as control scrambled siRNA. Cells were incubated overnight, and then treated with 1.0 µM of thapsigargin for 8hr. Total RNA was isolated for each sample and processed for GeneChip analysis by the Whitehead Institute Center for microarray technology (Cambridge, MA). The final product was hybridized to the GeneChip® Rat Genome 230 2.0 Arrays (Affymetrix, Santa Clara, CA) and scanned with a GeneChip Scanner 3000.
RMA method (40, 41) in Affy package from Bioconductor was used in R to summarize the probe level data and normalize the dataset to remove across array variation. Log transformed data was used in the subsequent analysis. Samples treated with siRNA against WFS1 or AATF (n = 3 for each RNAi treatment) were compared to control samples (n = 3) treatment. Limma package from Bioconductor (42) with randomized block design was used to determine whether a gene’s expression level differs between treatments. Genes with adjusted P-value < 0.01 (43) was considered significant.
Lentivirus system
Mouse AATF and mouse Akt1 cDNAs were purchased from Open Biosystems, and their cds portions were subcloned into lentiviral expression vectors (pLenti-CMV/TO, kind gifts from Dr. Eric Campeau at University of Massachusetts Medical School). Lentiviral particles were produced in HEK293T cells by transfection using Lipofectamine 2000 (Invitrogen). Lentiviral-containing supernatant was collected 48 hours after transfection, and stored at −80 °C. Details of this lentivirus system was described previously (44).
Immunoblotting and immunoprecipitation
Cells were lysed in M-PER buffer (PIERCE, Rockford, IL) containing protease inhibitors for 15 min on ice. The lysates were then cleared by centrifuging the cells at 13,000 g for 15 min at 4°C. Lysates were normalized for total protein (30 µg per lane), separated using a 4%–20% linear gradient SDS-PAGE (BioRad, Hercules, CA) and electroblotted. Blots were probed with the following antibodies: anti-human AATF (Bethyl, Montgomery, TX); anti-mouse and rat AATF antibody was also generated using a peptide, RPREADPEADPEEATR; anti-actin (Sigma, St. Louis, MO); anti-eIF2α (Santa Cruz Biotechnology, Santa Cruz, CA); anti-phospho-eIF2α, anti-Akt, anti-Akt1, anti-phospho-Akt, anti-Creb, anti-tubulin, anti-caspase-3 (Cell Signaling, Danvers, MA). When immunoprecipitated, cells were lysed in the nuclear lysis buffer (50 mM Tris-HCl, pH 7.5, 5 mM MgCl2, 200 mM KCl, 0.5 mM EDTA, 1 mM dithiothreitol, 50 mM NaF, 1 mM β-glycerophosphate, 0.5% NP-40). Nuclear lysates were incubated with 200 µg/ml DNase I and 10 µg/ml RNase A for 30 min at 26°C. After centrifugation at 10,000 g for 10 min at 4°C, supernatants were precleared with protein G-Sepharose (GE Healthcare Bio-Sciences, Uppsala Sweden), and anti-AATF antibody (Bethyl) was then added, and then incubated at 4°C with rotation. Immune complexes were then incubated with protein G-Sepharose for overnight, collected by centrifugation, and washed four times with the lysis buffer.
Real-time polymerase chain reaction
Total RNA was isolated from cells using RNeasy Mini Kit (Qiagen) and reverse transcribed using 1 µg of total RNA from cells with Oligo-dT primer. For the thermal cycle reaction, the iQ5 system (BioRad, Hercules, CA) was used at 95°C for 10 min, then 40 cycles at 95°C for 10 sec and 55°C for 30 sec.
The relative amount for each transcript was calculated by a standard curve of cycle thresholds for serial dilutions of cDNA samples and normalized to the amount of β-actin. The polymerase chain reaction (PCR) was performed in triplicate for each sample, after which all experiments were repeated twice. The following sets of primers and Power SYBR Green PCR Master Mix (Applied Biosystems, Foster City, CA) were used for real-time PCR: for mouse AATF, TTCTTGGCAAACCGGAGC and AGCGTCTCTGGTTCTCCTGG; for mouse actin, GCAAGTGCTTCTAGGCGGAC and AAGAAAGGGTGTAAAACGCAGC; for mouse Akt1, ATGGACTCAAGAGGCAGGAA and TCTTCAGCCCCTGAGTTGTC; for rat AATF, CCGAGTTCTTGGCAAACCTG and TCTCCGGTTCTCCTGGCA; for rat actin, GCAAATGCTTCTAGGCGGAC and AAGAAAGGGTGTAAAACGCAGC; for rat BiP, TGGGTACATTTGATCTGACTGGA and CTCAAAGGTGACTTCAATCTGGG; for rat Akt1, ACCACCGCCATTCAGACTG and TTGTCACTGGGTGAACCTGA; for rat Chop, AGAGTGGTCAGTGCGCAGC and CTCATTCTCCTGCTCCTTCTCC; for rat total XBP-1, TGGCCGGGTCTGCTGAGTCCG and ATCCATGGGAAGATGTTCTGG; for rat-spliced XBP-1, CTGAGTCCGAATCAGGTGCAG (the original CAG sequence was mutated to AAT to reduce the background signal from unspliced XBP-1) and ATCCATGGGAAGATGTTCTGG; for rat WFS1, ATCGACAACAGCGCCGA and GCATCCAGTCACCCAGGAAG.
TUNEL assay
Apoptotic cell death was assessed by the TUNEL assay. We counted apoptotic cells using the DeadEnd™ Colorimetric TUNEL System (Promega, Madison, WI). Counting was done by an investigator who was blind to the experimental condition.
Promoter assay
The intron1 promoter region of mouse Akt1 gene was amplified by PCR and cloned into the KpnI/XhoI site of the pGL4.14 vector (Promega). pFlag-STAT3-C vector expressing constitutive form of STAT3 was obtained from addgene (Addgene Inc., Cambridge, MA) (45). Neuro2a cells were transfected with pGL4.14/Akt1−1323/−32, pFlag/STAT3-C (STAT3), pCS2+/AATF (AATF), siRNA directed against AATF, and pcDNA3/β-galactosidase. pGL4.14 and control scrambled siRNA were used as negative controls. 24 hrs post-transfection, lysates were prepared using a Luciferase Assay System kit (Promega, Madison, WI). The light produced from the samples was read by a standard plate reading luminometer. β-galactosidase activity was measured by β-Gal Reporter Gene Assay, chemiluminescent (Roche Diagnostics, Mannheim, Germany). The assay was performed independently three times.
Chromatin immunoprecipitation (ChIP)
HEK293T cells were transfected with pFlag-STAT3-C with or without pCS2+/AATF. Cells were fixed after 24-hr of incubation. ChIPs were performed as previously described (46). Purified DNA from crosslinked cells was dissolved in 50 µl TE; 3 µl was used for PCR. Inputs consisted of 1% of chromatin before immunoprecipitation. Quantitative PCRs were performed as described in the Real-time polymerase chain reaction section using the following primer sets: for mouse Akt1 promoter (intron1), TCCCTCTGGAAGAGAAGCAA and TAGCTAGCCTGTGCAAAGCA; for mouse Akt1 cds (exon3), ATGGACTCAAGAGGCAGGAA and TCTTCAGCCCCTGAGTTGTC.
Primary islet culture
Mouse primary islets were taken from C57BL/6 mice. Mice were anesthetized, and their pancreatic islets were then isolated by pancreatic duct injection of 5ml (0.85 mg/ml) of collagenase solution followed by digestion at 37 °C for 25 min with mild shaking. Digestion was stopped by adding ice-cold RPMI with 1% horse serum. Islets were washed several times with RPMI, separated from acinar cells on a Histopaque gradient, and handpicked using a dissecting microscope. Islets were infected with 1.0×10⁶ TU/ml of lentiviruses expressing mouse AATF, mouse Akt1, and GFP. After 4-hr of infection, the media was changed, and then incubated for 24 hr. Islets were then challenged with 0.5 µM thapsigargin for 6 hr. Islets were collected by centrifugation and treated with trypsin and DNAse at 37 °C for 15 min to be dispersed into single cells, followed by TUNEL staining or immunohistochemistry. For immunohistochemistry we used anti-cleaved-caspase3 antibody (Cell Signaling) and anti-insulin antibody (Dako, Carpinteria, CA).
Statistical analysis
Cell death (y) was measured as a proportion of dead cells among all cells treated. Frequently arcsine (sqrt(y)) transformation is applied to the raw data to homogenize the variance before further data analysis (47). Therefore, all the analysis involving cell death data was performed on transformed data.
Two-way ANOVA was done to determine the main effect of WFS1 RNAi, the main effect of thapsigargin, and the interaction between WFS1 RNAi and thapsigargin (Figure. 1B). In addition, a set of predetermined contrasts was performed. Two-way ANOVA was also done in the same way in Figure 4B and 4C.
Supplementary Material
Acknowledgements
We thank E. Campeau for providing lentiviral expression systems; M.R. Green, K.L. Lipson, C. Kakiuchi, R. Ghosh, and Y. Okawa for helpful discussions; K. Sargent and L. Leehy for technical assistance. Research in the laboratory of F. Urano is supported by an NIH R01DK067493 grant, a grant from the Diabetes and Endocrinology Research Center at the University of Massachusetts Medical School (DK032520), a Juvenile Diabetes Research Foundation Regular Grant, and an Iacocca Foundation/Juvenile Diabetes Research Foundation joint grant.
References
- 1.Ron D, Walter P. Signal integration in the endoplasmic reticulum unfolded protein response. Nat Rev Mol Cell Biol. 2007 Jul;8(7):519–529. doi: 10.1038/nrm2199. [DOI] [PubMed] [Google Scholar]
- 2.Rutkowski DT, Kaufman RJ. That which does not kill me makes me stronger: adapting to chronic ER stress. Trends Biochem Sci. 2007 Oct 4; doi: 10.1016/j.tibs.2007.09.003. [DOI] [PubMed] [Google Scholar]
- 3.Szegezdi E, Logue SE, Gorman AM, Samali A. Mediators of endoplasmic reticulum stress-induced apoptosis. EMBO Rep. 2006 Sep;7(9):880–885. doi: 10.1038/sj.embor.7400779. [DOI] [PMC free article] [PubMed] [Google Scholar]
- 4.Kim I, Xu W, Reed JC. Cell death and endoplasmic reticulum stress: disease relevance and therapeutic opportunities. Nature reviews. 2008 Dec;7(12):1013–1030. doi: 10.1038/nrd2755. [DOI] [PubMed] [Google Scholar]
- 5.Zinszner H, Kuroda M, Wang X, Batchvarova N, Lightfoot RT, Remotti H, et al. CHOP is implicated in programmed cell death in response to impaired function of the endoplasmic reticulum. Genes & Development. 1998;12(7):982–995. doi: 10.1101/gad.12.7.982. [DOI] [PMC free article] [PubMed] [Google Scholar]
- 6.Urano F, Wang X, Bertolotti A, Zhang Y, Chung P, Harding HP, et al. Coupling of stress in the ER to activation of JNK protein kinases by transmembrane protein kinase IRE1. Science. 2000;287(5453):664–666. doi: 10.1126/science.287.5453.664. [DOI] [PubMed] [Google Scholar]
- 7.Nishitoh H, Matsuzawa A, Tobiume K, Saegusa K, Takeda K, Inoue K, et al. ASK1 is essential for endoplasmic reticulum stress-induced neuronal cell death triggered by expanded polyglutamine repeats. Genes & Development. 2002;16(11):1345–1355. doi: 10.1101/gad.992302. [DOI] [PMC free article] [PubMed] [Google Scholar]
- 8.Eizirik DL, Cardozo AK, Cnop M. The role for endoplasmic reticulum stress in diabetes mellitus. Endocrine reviews. 2008 Feb;29(1):42–61. doi: 10.1210/er.2007-0015. [DOI] [PubMed] [Google Scholar]
- 9.Fonseca SG, Lipson KL, Urano F. Endoplasmic reticulum stress signaling in pancreatic beta-cells. Antioxid Redox Signal. 2007 Dec;9(12):2335–2344. doi: 10.1089/ars.2007.1790. [DOI] [PubMed] [Google Scholar]
- 10.Riggs AC, Bernal-Mizrachi E, Ohsugi M, Wasson J, Fatrai S, Welling C, et al. Mice conditionally lacking the Wolfram gene in pancreatic islet beta cells exhibit diabetes as a result of enhanced endoplasmic reticulum stress and apoptosis. Diabetologia. 2005 Oct 8; doi: 10.1007/s00125-005-1947-4. [DOI] [PubMed] [Google Scholar]
- 11.Yamada T, Ishihara H, Tamura A, Takahashi R, Yamaguchi S, Takei D, et al. WFS1-deficiency increases endoplasmic reticulum stress, impairs cell cycle progression and triggers the apoptotic pathway specifically in pancreatic beta-cells. Hum Mol Genet. 2006 May 15;15(10):1600–1609. doi: 10.1093/hmg/ddl081. [DOI] [PubMed] [Google Scholar]
- 12.Karasik A, O’Hara C, Srikanta S, Swift M, Soeldner JS, Kahn CR, et al. Genetically programmed selective islet beta-cell loss in diabetic subjects with Wolfram’s syndrome. Diabetes Care. 1989 Feb;12(2):135–138. doi: 10.2337/diacare.12.2.135. [DOI] [PubMed] [Google Scholar]
- 13.Inoue H, Tanizawa Y, Wasson J, Behn P, Kalidas K, Bernal-Mizrachi E, et al. A gene encoding a transmembrane protein is mutated in patients with diabetes mellitus and optic atrophy (Wolfram syndrome) Nature Genetics. 1998;20(2):143–148. doi: 10.1038/2441. [DOI] [PubMed] [Google Scholar]
- 14.Strom TM, Hortnagel K, Hofmann S, Gekeler F, Scharfe C, Rabl W, et al. Diabetes insipidus, diabetes mellitus, optic atrophy and deafness (DIDMOAD) caused by mutations in a novel gene (wolframin) coding for a predicted transmembrane protein. Hum Mol Genet. 1998 Dec;7(13):2021–2028. doi: 10.1093/hmg/7.13.2021. [DOI] [PubMed] [Google Scholar]
- 15.Fonseca SG, Fukuma M, Lipson KL, Nguyen LX, Allen JR, Oka Y, et al. WFS1 Is a Novel Component of the Unfolded Protein Response and Maintains Homeostasis of the Endoplasmic Reticulum in Pancreatic {beta}-Cells. J Biol Chem. 2005 Nov 25;280(47):39609–39615. doi: 10.1074/jbc.M507426200. [DOI] [PubMed] [Google Scholar]
- 16.Page G, Lodige I, Kogel D, Scheidtmann KH. AATF, a novel transcription factor that interacts with Dlk/ZIP kinase and interferes with apoptosis. FEBS Lett. 1999 Nov 26;462(1–2):187–191. doi: 10.1016/s0014-5793(99)01529-x. [DOI] [PubMed] [Google Scholar]
- 17.Bruno T, De Angelis R, De Nicola F, Barbato C, Di Padova M, Corbi N, et al. Che-1 affects cell growth by interfering with the recruitment of HDAC1 by Rb. Cancer Cell. 2002 Nov;2(5):387–399. doi: 10.1016/s1535-6108(02)00182-4. [DOI] [PubMed] [Google Scholar]
- 18.Fanciulli M, Bruno T, Di Padova M, De Angelis R, Iezzi S, Iacobini C, et al. Identification of a novel partner of RNA polymerase II subunit 11, Che-1, which interacts with and affects the growth suppression function of Rb. Faseb J. 2000 May;14(7):904–912. doi: 10.1096/fasebj.14.7.904. [DOI] [PubMed] [Google Scholar]
- 19.Harding HP, Novoa I, Zhang Y, Zeng H, Wek R, Schapira M, et al. Regulated translation initiation controls stress-induced gene expression in mammalian cells. Mol Cell. 2000 Nov;6(5):1099–1108. doi: 10.1016/s1097-2765(00)00108-8. [DOI] [PubMed] [Google Scholar]
- 20.Harding HP, Zhang Y, Ron D. Protein translation and folding are coupled by an endoplasmic-reticulum-resident kinase. Nature. 1999 Jan 21;397(6716):271–274. doi: 10.1038/16729. [DOI] [PubMed] [Google Scholar]
- 21.Boyce M, Bryant KF, Jousse C, Long K, Harding HP, Scheuner D, et al. A selective inhibitor of eIF2alpha dephosphorylation protects cells from ER stress. Science. 2005 Feb 11;307(5711):935–939. doi: 10.1126/science.1101902. [DOI] [PubMed] [Google Scholar]
- 22.Kozutsumi Y, Segal M, Normington K, Gething MJ, Sambrook J. The presence of malfolded proteins in the endoplasmic reticulum signals the induction of glucose-regulated proteins. Nature. 1988 Mar 31;332(6163):462–464. doi: 10.1038/332462a0. [DOI] [PubMed] [Google Scholar]
- 23.Franke TF. PI3K/Akt: getting it right matters. Oncogene. 2008 Oct 27;27(50):6473–6488. doi: 10.1038/onc.2008.313. [DOI] [PubMed] [Google Scholar]
- 24.Amaravadi R, Thompson CB. The survival kinases Akt and Pim as potential pharmacological targets. J Clin Invest. 2005 Oct;115(10):2618–2624. doi: 10.1172/JCI26273. [DOI] [PMC free article] [PubMed] [Google Scholar]
- 25.Srinivasan S, Ohsugi M, Liu Z, Fatrai S, Bernal-Mizrachi E, Permutt MA. Endoplasmic reticulum stress-induced apoptosis is partly mediated by reduced insulin signaling through phosphatidylinositol 3-kinase/Akt and increased glycogen synthase kinase-3beta in mouse insulinoma cells. Diabetes. 2005 Apr;54(4):968–975. doi: 10.2337/diabetes.54.4.968. [DOI] [PubMed] [Google Scholar]
- 26.Hu P, Han Z, Couvillon AD, Exton JH. Critical role of endogenous Akt/IAPs and MEK1/ERK pathways in counteracting endoplasmic reticulum stress-induced cell death. J Biol Chem. 2004 Nov 19;279(47):49420–49429. doi: 10.1074/jbc.M407700200. [DOI] [PubMed] [Google Scholar]
- 27.Park S, Kim D, Kaneko S, Szewczyk KM, Nicosia SV, Yu H, et al. Molecular cloning and characterization of the human AKT1 promoter uncovers its up-regulation by the Src/Stat3 pathway. J Biol Chem. 2005 Nov 25;280(47):38932–38941. doi: 10.1074/jbc.M504011200. [DOI] [PubMed] [Google Scholar]
- 28.Xu Q, Briggs J, Park S, Niu G, Kortylewski M, Zhang S, et al. Targeting Stat3 blocks both HIF-1 and VEGF expression induced by multiple oncogenic growth signaling pathways. Oncogene. 2005 Aug 25;24(36):5552–5560. doi: 10.1038/sj.onc.1208719. [DOI] [PubMed] [Google Scholar]
- 29.Kakiuchi C, Ishigaki S, Oslowski CM, Fonseca SG, Kato T, Urano F. Valproate, a mood stabilizer, induces WFS1 expression and modulates its interaction with ER stress protein GRP94. PLoS ONE. 2009;4(1):e4134. doi: 10.1371/journal.pone.0004134. [DOI] [PMC free article] [PubMed] [Google Scholar]
- 30.Kakiuchi C, Ishiwata M, Hayashi A, Kato T. XBP1 induces WFS1 through an endoplasmic reticulum stress response element-like motif in SH-SY5Y cells. J Neurochem. 2006 Apr;97(2):545–555. doi: 10.1111/j.1471-4159.2006.03772.x. [DOI] [PubMed] [Google Scholar]
- 31.Bruno T, De Nicola F, Iezzi S, Lecis D, D'Angelo C, Di Padova M, et al. Che-1 phosphorylation by ATM/ATR and Chk2 kinases activates p53 transcription and the G2/M checkpoint. Cancer Cell. 2006 Dec;10(6):473–486. doi: 10.1016/j.ccr.2006.10.012. [DOI] [PubMed] [Google Scholar]
- 32.Bruno T, Iezzi S, De Nicola F, Di Padova M, Desantis A, Scarsella M, et al. Che-1 activates XIAP expression in response to DNA damage. Cell Death Differ. 2008 Mar;15(3):515–520. doi: 10.1038/sj.cdd.4402284. [DOI] [PubMed] [Google Scholar]
- 33.Puthalakath H, O'Reilly LA, Gunn P, Lee L, Kelly PN, Huntington ND, et al. ER stress triggers apoptosis by activating BH3-only protein Bim. Cell. 2007 Jun 29;129(7):1337–1349. doi: 10.1016/j.cell.2007.04.027. [DOI] [PubMed] [Google Scholar]
- 34.Reimertz C, Kogel D, Rami A, Chittenden T, Prehn JH. Gene expression during ER stress-induced apoptosis in neurons: induction of the BH3-only protein Bbc3/PUMA and activation of the mitochondrial apoptosis pathway. J Cell Biol. 2003 Aug 18;162(4):587–597. doi: 10.1083/jcb.200305149. [DOI] [PMC free article] [PubMed] [Google Scholar]
- 35.Sugatani T, Hruska KA. Akt1/Akt2 and mammalian target of rapamycin/Bim play critical roles in osteoclast differentiation and survival, respectively, whereas Akt is dispensable for cell survival in isolated osteoclast precursors. J Biol Chem. 2005 Feb 4;280(5):3583–3589. doi: 10.1074/jbc.M410480200. [DOI] [PubMed] [Google Scholar]
- 36.Karst AM, Dai DL, Cheng JQ, Li G. Role of p53 up-regulated modulator of apoptosis and phosphorylated Akt in melanoma cell growth, apoptosis, and patient survival. Cancer research. 2006 Sep 15;66(18):9221–9226. doi: 10.1158/0008-5472.CAN-05-3633. [DOI] [PubMed] [Google Scholar]
- 37.Marciniak SJ, Ron D. Endoplasmic reticulum stress signaling in disease. Physiol Rev. 2006 Oct;86(4):1133–1149. doi: 10.1152/physrev.00015.2006. [DOI] [PubMed] [Google Scholar]
- 38.Yamamoto K, Sato T, Matsui T, Sato M, Okada T, Yoshida H, et al. Transcriptional induction of mammalian ER quality control proteins is mediated by single or combined action of ATF6alpha and XBP1. Dev Cell. 2007 Sep;13(3):365–376. doi: 10.1016/j.devcel.2007.07.018. [DOI] [PubMed] [Google Scholar]
- 39.Lipson KL, Fonseca SG, Urano F. Endoplasmic reticulum stress-induced apoptosis and auto-immunity in diabetes. Curr Mol Med. 2006 Feb;6(1):71–77. doi: 10.2174/156652406775574613. [DOI] [PubMed] [Google Scholar]
- 40.Irizarry RA, Hobbs B, Collin F, Beazer-Barclay YD, Antonellis KJ, Scherf U, et al. Exploration, normalization, and summaries of high density oligonucleotide array probe level data. Biostatistics. 2003 Apr;4(2):249–264. doi: 10.1093/biostatistics/4.2.249. [DOI] [PubMed] [Google Scholar]
- 41.Irizarry RA, Bolstad BM, Collin F, Cope LM, Hobbs B, Speed TP. Summaries of Affymetrix GeneChip probe level data. Nucleic Acids Res. 2003 Feb 15;31(4):e15. doi: 10.1093/nar/gng015. [DOI] [PMC free article] [PubMed] [Google Scholar]
- 42.Smyth GK. Linear models and empirical bayes methods for assessing differential expression in microarray experiments. Stat Appl Genet Mol Biol. 2004;3 doi: 10.2202/1544-6115.1027. Article3. [DOI] [PubMed] [Google Scholar]
- 43.Benjamini Y, Hochberg Y. Controlling the false discovery rate: a practical and powerful approach to multiple testing. J R Statist Soc B. 1995;57:289–300. [Google Scholar]
- 44.Campeau E, Ruhl VE, Rodier F, Smith CL, Rahmberg BL, Fuss JO, et al. A versatile viral system for expression and depletion of proteins in mammalian cells. PLoS ONE. 2009;4(8):e6529. doi: 10.1371/journal.pone.0006529. [DOI] [PMC free article] [PubMed] [Google Scholar]
- 45.Bromberg JF, Wrzeszczynska MH, Devgan G, Zhao Y, Pestell RG, Albanese C, et al. Stat3 as an oncogene. Cell. 1999 Aug 6;98(3):295–303. doi: 10.1016/s0092-8674(00)81959-5. [DOI] [PubMed] [Google Scholar]
- 46.Ohkawa Y, Marfella CG, Imbalzano AN. Skeletal muscle specification by myogenin and Mef2D via the SWI/SNF ATPase Brg1. Embo J. 2006 Feb 8;25(3):490–501. doi: 10.1038/sj.emboj.7600943. [DOI] [PMC free article] [PubMed] [Google Scholar]
- 47.Freeman MF, Tukey JW. Transformations related to the angular, and the square root. Ann Mathem Stat. 1950;21:607–611. [Google Scholar]
Associated Data
This section collects any data citations, data availability statements, or supplementary materials included in this article.


