

Abstract
Several mechanisms contributing to the etiology of sarcopenia (age-related loss of muscle size) have been postulated. One of these attributes the loss of muscle mass to a preceding age-related denervation of myofibers. The aim of this study was to determine if signs of denervation were apparent at the neuromuscular junction (NMJ) before fiber atrophy, or fiber type conversion could be documented, and to reveal if a muscle’s activity level impacts its sensitivity to age-related denervation. Plantaris and soleus muscles were obtained from young adult (10 mo) and early aged (21 mo) rats. Pre- and post-synaptic NMJ morphology was quantified with cytofluorescent staining of nerve terminal branches and endplate regions, respectively. Myofiber profiles (fiber size and fiber type composition) were assessed with histochemical procedures. Results show that in the lightly recruited plantaris, significant (P < 0.05) signs of denervation were noted in aged rats, while the same muscles displayed no change in myofiber profile. In the heavily recruited soleus, however, there was little evidence of denervation, and again no alterations in myofiber profile. These results indicate that age-related denervation occurs before myofiber atrophy, and that high amounts of neuromuscular activity may delay the onset of age-related denervation and sarcopenia.
Keywords: synapse, nerve terminal, aging, motor endplate, fiber type, atrophy, muscle
Introduction
Sarcopenia – or the age-related loss of skeletal muscle mass – is estimated to affect 64% and 34% of aged men and women, respectively in the United States (Janssen et al., 2004a). This loss of contractile tissue has been associated with increased risk of type 2 diabetes, osteoporosis, and obesity (Dutta, 1997; Kim et al., 2009), as well as a greater incidence of accidental falls (Rao, 2005). All told, the annual financial burden of sarcopenia among aged Americans has been estimated to be as high as $26 billion (Janssen et al., 2004b). Accordingly, there has been a major effort in the scientific community to gain a better understanding of the etiology of sarcopenia. Various physiological mechanisms have been postulated to contribute to muscle loss among the aged including changes in the circulating anabolic/catabolic endocrine milieu (Srinivas-Shanker and Wu, 2009), an increase in mitochondrial dysfunction (Hiona and Leeuwenburgh, 2008), oxidative damage (Fulle, et al., 2004) and elevated inflammatory cytokine concentrations (Roubenoff, 2007). However, compelling arguments have been put forth that the loss of skeletal muscle mass with sarcopenia is precipitated by an age-related decrease in the number of motor neurons innervating muscle fibers (Delbono, 2003; Larsson and Ansved, 1995; Vandervoort, 2002). According to this scenario, beyond the age of 60 years, there is a continual process of denervation and re-innervation of skeletal muscle fibers that leads to the death of some myofibers, while others that have been abandoned by fast motor neurons are re-innervated by slow ones resulting in a conversion of type II fibers – which tend to be large - to type I fibers which tend to be smaller in size. Both of these outcomes result in decreased muscle mass.
To date, most of the research cited to support the notion that it is denervation that principally accounts for sarcopenia has been obtained with physiological methodologies, in particular electromyography and to a lesser extent, electrophysiology. The main objective of the present study was to employ morphological techniques to examine whether the changes in muscle fiber profile that characterize sarcopenia (i.e., atrophy, increased percentage of type I fibers) were preceded by signs of denervation at the neuromuscular junction (NMJ). A secondary aim was to determine whether the normal activity level of a muscle influenced its susceptibility to the onset of sarcopenia.
Materials and Methods
Subjects
Male Fischer 344 rats were purchased from the National Institutes on Aging Colonies. Ten month old rats (N=10) served as young adults, and 21 month old rats (N=10) were chosen to represent animals at the early stages of aging. Since the average lifespan of Fischer 344 rats is 25.5 months (Turturro et al., 1999), 21 month old rats have lived 82% of their life expectancy which, expressed relative to the average lifespan of men in the United States (i.e., 75.2 years; Arias, 2006), is the equivalent of a 62 year old man.
Animals were provided with standard rat chow and water ad libitum, and were housed in a 21-22° C environment with a 12 h light-dark cycle. All procedures used in the treatment and handling of animals were approved by the institutional animal care and use committee which operates in accordance with the National Institutes of Health Guide for the Care and Use of Laboratory Animals as revised in 1996.
Selection of muscles
To assess the impact that normal, daily activity levels might have on the onset of sarcopenia, the soleus and plantaris muscles were selected for study. The soleus is the main postural muscle of the rat and as such, is highly recruited throughout the day (Hennig and Lomo, 1985). In contrast, the plantaris – although like the soleus, an ankle extensor – is primarily a locomotor muscle and accordingly, is not recruited as regularly as the soleus (Laughlin and Armstrong, 1982). Following euthanization of the animals, these two muscles were obtained from each hindlimb, cleared of fat and connective tissue, and then frozen at resting length is isopentane chilled with liquid nitrogen. Muscle were then stored at −80° C until analysis.
Cytofluorescent staining of NMJs
To visualize NMJs, 50 μm thick longitudinal sections of the middle one-third of the muscle were obtained at −20°C on a cryostat (Cryocut 1800; Reichert-Jung, NuBloch, Germany). To prevent contraction of sections, microscope slides were pretreated in a 3% EDTA solution as previously described (Pearson and Sabarra, 1974). Sections were washed 4 × 15 min in phosphate buffered saline (PBS) containing 1% bovine serum albumin (BSA). Sections were then incubated in a humidified chamber overnight at 4°C in supernatant of the primary antibody RT97 (Developmental Studies Hybridoma Bank, University of Iowa), diluted 1:20 in PBS with 1% BSA. The RT97 antibody reacts with non-myelinated constituents of pre-synaptic nerve terminals (Anderton et al., 1982). The next day, sections were washed 4 × 15 in PBS with 1% BSA before incubating for 2 h at room temperature in fluorescein isothiocyanate (FITC) conjugated secondary immunoglobulin (Sigma Chemical, St. Louis, MO) that was diluted 1:150 in PBS with 1% BSA. Sections were then washed 4 × 15 min in PBS with 1% BSA. Following this, sections were incubated in a humidified chamber overnight at 4°C in a solution containing rhodamine conjugated α-bungarotoxin (BTX; Molecular Probes, Eugene, OR) diluted 1:600 in PBS along with either anti-fast (soleus) or anti-slow (plantaris) myosin heavy chain ascites fluid (Sigma Chemical, St. Louis, MO) diluted 1:40. BTX recognizes post-synaptic acetylcholine (ACh) receptors, while staining with the myosin specific immunogen enabled us to determine whether the endplate resided on a fast- or slow-twitch myofiber. The next day, sections were washed 4 × 15 min in PBS with 1% BSA before incubating them for 1 h at room temperature in AlexaFluor 647 (Molecular Probes, Eugene, OR) labeled secondary antibody to bind with the anti-slow primary antibody. Sections were given a final wash (4 × 15 min) before being lightly coated with Pro Long (Molecular probes, Eugene, OR) and having cover slips applied. Slides were then coded with respect to treatment group to allow for blinded evaluation of NMJ morphology and then stored at −20°C until analysis. An example of this cytofluorescent staining of pre- and post-synaptic components of the NMJ is displayed in Figure 1. Pre-synaptic variables of NMJs assessed included: 1) number of branches identified at the nerve terminal, 2) the total length of those branches, 3) average length per branch, and 4) branching complexity which, as described by Tomas et al. (1987) is derived by multiplying the number of branches by the total length of those branches and dividing that figure by 100. Post-synaptic variables of interest included: 1) total perimeter, or the length encompassing the entire endplate comprised of stained receptor clusters and non-stained regions interspersed within those clusters, 2) stained perimeter, or the composite length of tracings around individual receptor clusters, 3) total area, which includes stained receptors along with non-stained regions interspersed among receptor clusters, 4) stained area, or the cumulative areas occupied by ACh receptor clusters, and 5) dispersion of endplates, which was assessed by dividing the endplate’s stained area by its total area and multiplying by 100. In this study, pre- to post-synaptic coupling was quantified by dividing the NMJ’s post-synaptic stained area by its total length of nerve terminal branching.
Figure 1.
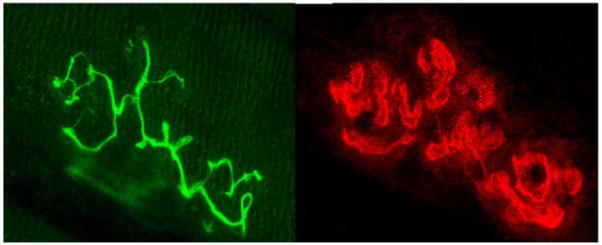
Representative image of fluorescently stained pre-synaptic nerve terminal branching (left panel), and fluorescently stained post-synaptic acetylcholine receptors (right panel) of the same NMJ. Original magnification of X 1000.
Histochemical staining
To quantify myofiber profiles, 10 μm thick transverse sections were obtained from the midbelly of the muscle using a cryostat set at −20°C. Sections were stained for myofibrillar ATPase activity following pre-incubation at a pH of either 4.55 (soleus) or 4.40 (plantaris) according to Nemeth and Pette (1981). Fibers were classified as either type I, IIA, or IIX/B. The staining procedure used did not allow distinction between type IIX and IIB fibers, although it should be noted that the soleus does not express IIB fibers (Delp and Duan, 1996). Slides were coded so that measurements could be conducted in a blinded fashion regarding treatment group. Figure 2 shows histochemically stained myofibers following acidic pre-incubation.
Figure 2.
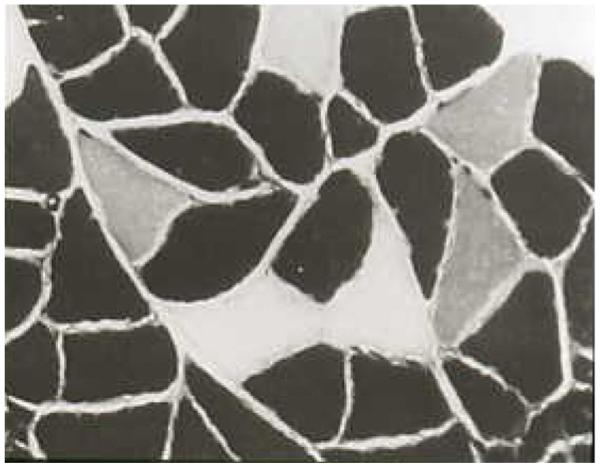
Sample of myofibers histochemically stained for myosin ATPase activity following acidic pre-incubation. Darkest myofibers are type I, lightest myofibers are type IIA, and intermediately stained myofibers are type II X/B. Original magnification of X 400.
Microscopy
An Olympus Fluoview FV 300 confocal system featuring three lasers and an Olympus BX60 fluorescent microscope (Olympus America, Melville, NY) was used to collect images of NMJs and to identify whether they were located on slow or fast-twitch myofibers. Using a 100X oil immersion objective, it was initially established that the entire NMJ was within the longitudinal borders of the myofiber and that the area of interest was not damaged during sectioning. A detailed image of the entire NMJ was constructed from a z-series of scans taken at 1 μm thick increments. To ascertain whether the NMJ resided on a fast- or slow-twitch myofiber, a single scan was collected of the fiber using the appropriate wavelength to detect AlexaFluor 647. Digitized, two-dimensional images of NMJs were stored on the system’s hard drive and later quantified with the Image-Pro Plus software (Media Cybernetics, Silver Spring, MD). For each fiber type within the muscle, 10-12 NMJs were imaged and measurements averaged to represent NMJ structure for fast- and slow-twitch fibers in that muscle.
An Olympus BX41 phase contrast microscope was used to assess myofiber profiles with a 40X objective. Myofiber cross-sectional areas were quantified with the Image-Pro Express software. A random sample of 125-150 myofibers from each muscle was analyzed to determine average myofiber size (i.e., cross-sectional area) and fiber type composition for that muscle.
Statistical analysis
Data are reported as means ± SE. To compare variables of interest between aged and young rats, independent t-tests were conducted. Statistical significance was set at P < 0.05. A sample size of 10/group was selected based on our previous work showing that it would provide the desired statistical power (1 – β) of 0.8.
Results
Body mass and muscle wet weight
All rats were weighed immediately prior to euthanization, and after being surgically removed from euthanized animals, wet weights of soleus and plantaris muscles were quantified. It was determined that neither the soleus nor the plantaris demonstrated age-related differences in wet weight. However, the body mass of aged rats was significantly greater than that of young ones, and accordingly, the muscle wet weight to body mass ratio for both the soleus and the plantaris was significantly higher among young rats. Body mass and muscle wet weight data are displayed in Table 1.
Table 1.
Body mass and muscle wet weight in young, and aged rats
| Young (N=10) | Aged (N=10) | |
|---|---|---|
| Body mass (g) | 352.7 ± 11.1 | 450.9 ± 12.0* |
| Soleus wet weight (mg) | 120.6 ± 5.7 | 133.0 ± 6.7 |
| Plantaris wet weight (mg) | 286.0 ± 18.0 | 284.1 ± 6.9 |
| Soleus/Body mass (mg/g) | 0.342 ± 0.011 | 0.296 ± 0.010* |
| Plantaris/Body mass (mg/g) | 0.807 ± 0.036 | 0.622 ± 0.044* |
Values are means ± SE.
indicates significant (P < 0.05) difference from Young.
NMJ morphology
Plantaris
Compared with the NMJs of young adult rats, the synapses quantified in aged plantaris muscles demonstrated significant remodeling. This was true of NMJs located on both fast- and slow-twitch myofibers, and remodeling typically presented itself as an expansion. For example, there was a statistical trend for the number of pre-synaptic branches in both fast-twitch (P=0.08) and slow-twitch (P=0.06) NMJs to be higher in the aged rats than in young ones. These age-related differences, however, reached statistical significance in other nerve terminal measures. In fast-twitch NMJs, total branch length, average branch length, and branching complexity were all found to be significantly higher among aged muscles. And the nerve terminals of aged slow-twitch NMJs exhibited significantly greater total branch length and branching complexity than those of young slow-twitch NMJs.
Analysis of post-synaptic measurements also revealed the presence of larger dimensions among the aged than the young plantaris muscles. Specifically, both fast- and slow-twitch endplates were noted to have significantly greater total and stained perimeter lengths around endplates, as well as significantly larger total and stained areas. Despite these larger sizes, however, both fast- and slow- twitch endplates of aged rats were found to have similar degrees of dispersion in the distribution of ACh receptors as young rats. Moreover, it was confirmed that age had no impact on the relationship between pre- and post-synaptic components of either fast- or slow-twitch NMJs. Data regarding NMJ morphology in the plantaris muscles of young and aged rats are presented in Table 2.
Table 2.
Neuromuscular junction morphology in young, and aged plantaris muscles
| Fast-twitch | Slow-twitch | |||
|---|---|---|---|---|
| Pre-synaptic | Young (N=10) | Aged (N=10) | Young (N=9) | Aged (N=9) |
| Branch number | 5.8 ± 0.3 | 6.7 ± 0.3† | 5.5 ± 0.5 | 6.9 ± 0.3† |
| Total branch length (μm) |
192.3 ± 11.9 | 255.4 ± 11.9* | 190.7 ± 15.1 | 248.2 ± 11.0* |
| Average branch length (μm) |
33.2 ± 2.0 | 38.1 ± 1.4* | 36.7 ± 2.0 | 35.9 ± 2.3 |
| Branching complexity |
11.2 ± 1.3 | 17.1 ± 1.6* | 10.8 ± 1.8 | 16.5 ± 3.1* |
| Post-synaptic | ||||
| Total perimeter (μm) |
118.4 ± 9.8 | 151.9 ± 13.5* | 123.8 ± 7.6 | 154.2 ± 6.9* |
| Stained perimeter (μm) |
216.6 ± 13.9 | 321.8 ± 16.2* | 248.8 ± 32.4 | 334.4 ± 28.2* |
| Total area (μm2) | 685.4 ± 58.4 | 992.8 ± 76.8* | 743.6 ± 89.8 | 954.3 ± 83.6* |
| Stained area (μm2) | 548.1 ± 37.1 | 795.8 ± 61.0* | 581.2 ± 67.9 | 758.7 ± 80.5* |
| Dispersion (%) | 80.0 ± 2.4 | 78.1 ± 1.6 | 78.2 ± 2.7 | 79.4 ± 2.0 |
| Pre-to post- synaptic coupling |
2.9 ± 0.6 | 3.1 ± 0.2 | 3.0 ± 0.6 | 3.1 ± 0.2 |
Values are means ± SE. Branching complexity = branch number x total branch length/100. Dispersion = stained area/total area. Pre- to post-synaptic coupling = endplate stained area/total nerve terminal branch length.
indicates trend (0.05 < P < 0.10) for significant difference from Young.
indicates significant (P < 0.05) difference from Young.
Soleus
Results of our analysis of NMJ morphology in the soleus muscle showed that age-related modifications were evident in only a few parameters, and only among slow-twitch myofibers. More specifically, both slow- and fast-twitch NMJs failed to exhibit age-related differences in any of the pre-synaptic variables quantified, including pre- to post-synaptic coupling. And among fast-twitch NMJs, no significant post-synaptic differences in endplate morphology were identified between young and aged rats. Among slow-twitch NMJs, however, it was noted that although perimeter lengths did not differ between aged and young muscles, both total and stained area measurements were significantly larger among aged rats, even though the distribution of ACh receptors was found to be more compact (i.e., less dispersed) among those same rats. All data regarding NMJ structure in aged and young soleus muscles are found in Table 3.
Table 3.
Neuromuscular junction morphology in young, and aged soleus muscles
| Fast-twitch | Slow-twitch | |||
|---|---|---|---|---|
| Pre-synaptic | Young (N=7) | Aged (N=6) | Young (N=10) | Aged (N=10) |
| Branch number | 6.2 ± 0.7 | 5.8 ± 0.9 | 6.6 ± 0.7 | 5.9 ± 0.6 |
| Total branch length (μm) |
106.9 ± 10.9 | 101.4 ± 20.9 | 99.3 ± 3.1 | 94.4 ± 13.7 |
| Average branch length (μm) |
16.5 ± 0.5 | 17.4 ± 1.4 | 16.7 ± 1.0 | 19.5 ± 0.5 |
| Branching complexity |
10.7 ± 1.4 | 7.3 ± 2.8 | 7.7 ± 1.8 | 7.8 ± 1.6 |
| Post-synaptic | ||||
| Total perimeter (μm) |
119.4 ± 8.2 | 123.9 ± 28.0 | 135.9 ± 10.7 | 137.4 ± 9.3 |
| Stained perimeter (μm) |
243.0 ± 23.9 | 186.2 ± 68.5 | 223.8 ± 14.0 | 264.9 ± 19.0 |
| Total area (μm2) | 315.0 ± 48.8 | 386.5 ± 66.9 | 410.2 ± 16.0 | 564.3 ± 53.7* |
| Stained area (μm2) | 240.5 ± 22.9 | 248.8 ± 60.8 | 222.6 ± 15.8 | 323.4 ± 32.9* |
| Dispersion (%) | 61.3 ± 1.5 | 68.0 ± 4.9 | 50.0 ± 2.6 | 61.0 ± 1.0* |
| Pre-to post- synaptic coupling |
2.4 ± 0.1 | 2.3 ± 0.6 | 2.5 ± 0.3 | 2.9 ± 0.2 |
Values are means ± SE. Branching complexity = branch number x total branch length/100. Dispersion = stained area/total area. Pre- to post-synaptic coupling = endplate stained area/total nerve terminal branch length.
indicates significant (P < 0.05) difference from Young.
Myofiber profiles
Our analysis of muscle fiber size and fiber type composition revealed that in both the soleus and the plantaris, no significant differences were observed between 10 mo and 21 mo old rats. That is, in neither muscle was there significant fiber type conversion, nor was any age-related atrophy apparent. Indeed, not only was the size of myofibers in aged and young rats similar when fiber types were pooled together, but also when each fiber type was assessed individually. Data from our analysis of myofibers are presented in Table 4.
Table 4.
Myofiber profiles in young, and aged plantaris, and soleus muscles
| Plantaris | Soleus | |||
|---|---|---|---|---|
|
Cross-sectional area (μm2) |
Young (N=10) | Aged (N=10) | Young (N=10) | Aged (N=10) |
| Fiber types combined | 2218 ± 119 | 2018 ± 93 | 2159 ± 101 | 2243 ± 127 |
| Type I fibers | 1359 ± 117 | 1292 ± 46 | 2218 ± 110 | 2286 ± 126 |
| Type IIA fibers | 2632 ± 173 | 2369 ± 112 | 1939 ± 111 | 2164 ± 193 |
| *Type IIX/B fibers | 1304 ± 160 | 1250 ± 86 | 1667 ± 135 | 1796 ± 195 |
|
Fiber type
composition (%) |
||||
| Type I fibers | 16.5 ± 1.3 | 22.3 ± 1.8 | 85.2 ± 2.1 | 86.0 ± 1.1 |
| Type IIA fibers | 67.8 ± 6.1 | 66.6 ± 2.3 | 10.6 ± 2.2 | 9.1 ± 1.2 |
| *Type IIX/B fibers | 15.7 ± 5.5 | 11.1 ± 1.5 | 4.2 ± 0.7 | 4.9 ± 0.8 |
Values are means ± SE.
Type IIB myofibers are not expressed in the soleus muscle of rats (Delp and Duan, 1996).
Discussion
The cost of sarcopenia, both in financial terms to society and to personal quality of life, has been clearly articulated (for reviews see Dutta, 1997; Janssen et al., 2004b; Lang et al., 2009; Robenoff and Hughes, 2000). Less thoroughly understood at this time is the etiology of this condition that afflicts so many of our aged. One mechanism that has been proposed to account for the loss of muscle mass and fiber type conversion (type II → I) that occurs with sarcopenia is an age-related death, or apoptosis, of motor neurons, particularly fast conducting ones. In accounting for this apoptosis, recent evidence suggests that the decline of muscle derived IGF-1 that naturally occurs with aging is a key precipitating factor, and that injecting IGF-1 into muscle inhibits motor neuron and NMJ degeneration in aging fast-twitch muscle (Payne et al., 2006; Payne et al., 2007).
In humans, this process of myofiber denervation begins at about 60 years of age, resulting in fiber atrophy and/or conversion to type I fibers as a result of compensatory re-innervation by slow-conducting motor neurons which resist age-related apoptosis more effectively than fast motor neurons. Here, we provide evidence at the cellular level of the peripheral nervous system that denervation does indeed precede myofiber atrophy and fiber type conversion at the earliest stages of old age. (Recall that the age of the old male rats used in the present study roughly equates to 62 year old men.)
Several investigations have demonstrated that denervation results in modifications in the structure of the NMJ. These modifications typically include nerve terminal sprouting, increased nerve terminal branch length, greater branching complexity, and expanded post-synaptic endplate dimensions (Brown and Ironton, 1977; Eldridge et al., 1981; Fahim, 1993; Guzzini et al., 2008). The pre- and post-synaptic remodeling quantified in the NMJs of the aged rats in the current study clearly indicates the presence of denervation. In the non-weight bearing, and sparingly recruited plantaris muscle, this denervation was detected in both fast- and slow-twitch NMJs. This is of interest because these findings suggest that both fast- and slow-twitch nerve terminals are equally susceptible to age-related denervation in this primarily fast-twitch muscle. But in the postural, and highly recruited soleus muscle, there is little evidence of the onset of age-related denervation at the NMJ. Indeed, fast-twitch NMJs in soleus myofibers display no morphological signs of remodeling, while slow-twitch NMJs show no signs of denervation at pre-synaptic nerve terminals, and only sporadically (i.e., just two of six variables assessed) do so in post-synaptic morphology. The difference in the degree of NMJ remodeling observed among aged plantaris and soleus muscles is intriguing in that it reveals that neuromuscular activity may influence sensitivity to age-related denervation. That is, the denervation-like remodeling of NMJs examined in the plantaris was far more pronounced and comprehensive than that noted among the synapses of the more heavily recruited soleus muscle. This activity related influence on the denervation observed among the aged is consistent with previous research by Kanda and Hashizume (1998). In that study, it was determined that a program of exercise training effectively countered the alterations in motor neuron structure noted in the spinal cords of aged rats.
In the present study it was of interest to note that in both the soleus and plantaris, the early stages of aging affected fast- and slow-twitch NMJs similarly in that either both or neither demonstrated morphological signs of denervation. Thus, the results reported here show that fast motor neurons are not necessarily more likely to suffer apoptosis than slow ones. Moreover, the current investigation supports our previous work indicating that when structural alterations of the adult NMJ occur, there is linkage between pre- and post-synaptic modifications, and that this is evident in both fast- and slow-twitch NMJs (Deschenes et al., 2005).
Our findings regarding the myofiber profiles of young and aged muscles are also vital to our understanding of the onset of sarcopenia. It was determined that myofiber size (cross-sectional area) and fiber type composition did not differ between 10 mo and 21 mo old rats. This was true for both the soleus and the plantaris muscles. In essence then, sarcopenia, which entails myofiber atrophy and a shifting to a greater expression of type I (slow-twitch) myofibers, was not evident in either the predominantly fast-twitch, locomotor plantaris, or the mainly slow-twitch, postural soleus. Yet despite this absence of typical symptoms of sarcopenia in muscle tissue, there was compelling evidence of denervation-like structural alterations in the NMJs residing on myofibers, even on post-synaptic endplates which are specialized regions of the sarcolemma. This unequivocally supports the contention that denervation precedes, and is a pre-requisite to, the loss of muscle mass and fiber type conversion that characterizes sarcopenia. It must be pointed out, however, that the findings presented here do not disprove that other mechanisms such as mitochondrial dysfunction, or attenuated circulating levels of anabolic hormones contribute to the progression of sarcopenia. Only denervation, at the earliest onset of sarcopenia, was examined in the present investigation.
In summary, this investigation provides morphological evidence, at the cellular level, that denervation occurs at the very earliest stages of aging, even before the signs of sarcopenia are detected, supporting the notion that denervation is a principal mechanism accounting for the loss of muscle mass that occurs with aging. Importantly, the results presented here also suggest that high levels of neuromuscular activity may effectively delay this age-related denervation and along with it, the onset of sarcopenia and its associated serious co-morbidities.
Acknowledgments
This study was supported by grants from the National Institutes of Health (grant number R15 AG17440), and the Howard Hughes Medical Institute through a grant to the Undergraduate Biological Sciences Education Program at the College of William & Mary.
Footnotes
Publisher's Disclaimer: This is a PDF file of an unedited manuscript that has been accepted for publication. As a service to our customers we are providing this early version of the manuscript. The manuscript will undergo copyediting, typesetting, and review of the resulting proof before it is published in its final citable form. Please note that during the production process errors may be discovered which could affect the content, and all legal disclaimers that apply to the journal pertain.
References
- Anderton BH, Breinburg D, Downes MJ, Green PJ, Tomlinson BE, Ulrich J, Wood JN, Kahn J. Monoclonal antibodies show that neurofibrillary tangles and neurofilaments share antigenic determinants. Nature. 1982;298:84–86. doi: 10.1038/298084a0. [DOI] [PubMed] [Google Scholar]
- Arias E. United States life tables, 2003. Natl. Vital Stat. Rep. 2006;54:1–40. [PubMed] [Google Scholar]
- Brown MC, Ironton R. Motor neuron sprouting induced by prolonged tetrodotoxin block of nerve action potentials. Nature. 1977;265:549–561. doi: 10.1038/265459a0. [DOI] [PubMed] [Google Scholar]
- Delbono O. Neural control of aging skeletal muscle. Aging Cell. 2003;2:21–29. doi: 10.1046/j.1474-9728.2003.00011.x. [DOI] [PubMed] [Google Scholar]
- Delp MD, Duan C. Composition and size of type I, IIA, IID/X, and IIB fibers and citrate synthase activity of rat muscle. J. Appl. Physiol. 80:261–270. doi: 10.1152/jappl.1996.80.1.261. [DOI] [PubMed] [Google Scholar]
- Deschenes MR, Wilson MH, Kraemer WJ. Neuromuscular adaptations to spaceflight are specific to postural muscles. Muscle Nerve. 2005;31:468–474. doi: 10.1002/mus.20277. [DOI] [PubMed] [Google Scholar]
- Dutta C. Significance of sarcopenia in the elderly. J. Nutr. 1997;127:992S–993S. doi: 10.1093/jn/127.5.992S. [DOI] [PubMed] [Google Scholar]
- Eldridge L, Liebold M, Steinbach JH. Alterations in cat skeletal neuromuscular junctions following prolonged inactivity. J. Physiol. 1981;313:529–545. doi: 10.1113/jphysiol.1981.sp013680. [DOI] [PMC free article] [PubMed] [Google Scholar]
- Fahim MA. Morphological correlates of physiological responses in partially denervated mouse muscle during aging. Int. J. Dev. Neurosci. 1993;11:303–310. doi: 10.1016/0736-5748(93)90002-u. [DOI] [PubMed] [Google Scholar]
- Fulle S, Protasi F, Di Tano G, Pietrangelo T, Beltramin A, Boncompagni S, Vecchiet L, Fano G. The contribution of reactive oxygen species to sarcopenia and muscle ageing. Exp. Gerontol. 2004;39:17–24. doi: 10.1016/j.exger.2003.09.012. [DOI] [PubMed] [Google Scholar]
- Guzzini M, Raffa S, Geuna S, Nicolino S, Torrisi MR, Tos P, Battiston B, Grassi F, Ferretti A. Denervation-related changes in acetylcholine receptor density and distribution in the rat flexor digitorum sublimis muscle. Ital. J. Anat. Embryol. 2008;113:209–216. [PubMed] [Google Scholar]
- Hennig R, Lomo T. Firing patterns of motor units in normal rats. Nature. 1985;314:164–166. doi: 10.1038/314164a0. [DOI] [PubMed] [Google Scholar]
- Hiona A, Leeuwenburgh C. The role of mitochondrial DNA mutations in aging and sarcopenia: implications for the mitochondrial vicious cycle theory of aging. Exp. Gerontol. 2008;43:24–33. doi: 10.1016/j.exger.2007.10.001. [DOI] [PMC free article] [PubMed] [Google Scholar]
- Janssen I, Baumgartner RN, Ross R, Rosenberg IH, Roubenoff R. Skeletal muscle cutpoints associated with elevated physical disability in older men and women. Am. J. Epidemiol. 2004a;159:413–421. doi: 10.1093/aje/kwh058. [DOI] [PubMed] [Google Scholar]
- Janssen I, Shepard DS, Katzmarzyk PT, Roubenoff R. The healthcare costs of sarcopenia in the United States. 2004b;52:80–85. doi: 10.1111/j.1532-5415.2004.52014.x. [DOI] [PubMed] [Google Scholar]
- Kanda K, Hashizume K. Effects of long-term physical exercise on age-related changes of spinal motoneurons and peripheral nerves in rats. Neurosci. Res. 1998;31:69–75. doi: 10.1016/s0168-0102(98)00026-1. [DOI] [PubMed] [Google Scholar]
- Lang T, Streeper T, Cawthon P, Baldwin K, Taaffe DR, Harris TB. Sarcopenia: etiology, clinical consequences, intervention, and assessment. Osteoporos. Int. 2009 doi: 10.1007/s00198-009-1059-y. Epub ahead of print. [DOI] [PMC free article] [PubMed] [Google Scholar]
- Larsson L, Ansved T. Effects of ageing on the motor unit. Prog. Neurobiol. 1995;45:397–458. doi: 10.1016/0301-0082(95)98601-z. [DOI] [PubMed] [Google Scholar]
- Laughlin MH, Armstrong RB. Muscular blood flow distribution patterns as a function of running speed in rats. Am. J. Physiol. 1982;243:H296–H306. doi: 10.1152/ajpheart.1982.243.2.H296. [DOI] [PubMed] [Google Scholar]
- Nemeth P, Pette D. Succinate dehydrogenase activity in fibres classified by myosin ATPase in three hindlimb muscles of rat. J. Physiol. 1981;320:73–80. doi: 10.1113/jphysiol.1981.sp013935. [DOI] [PMC free article] [PubMed] [Google Scholar]
- Payne AM, Zheng Z, Messi ML, Milligan CE, Gonzalez E, Delbono O. Motor neurone targeting of IGF-1 prevents specific force decline in ageing mouse muscle. J. Physiol. 2006;570:283–294. doi: 10.1113/jphysiol.2005.100032. [DOI] [PMC free article] [PubMed] [Google Scholar]
- Payne AA, Messi ML, Zheng Z, Delbono O. Motor neuron targeting of IGF-1 attenuates age-related external Ca2+ -dependent skeletal muscle contraction in senescent mice. Exp. Gerontol. 2007;42:309–319. doi: 10.1016/j.exger.2006.11.003. [DOI] [PMC free article] [PubMed] [Google Scholar]
- Pearson J, Sabarra A. A method for obtaining longitudinal cryostat sections of living muscle without contraction artifacts. Stain. Technol. 1974;49:143–146. doi: 10.3109/10520297409116965. [DOI] [PubMed] [Google Scholar]
- Rao SS. Prevention of falls in older patients. Am. Fam. Physician. 2005;72:81–88. [PubMed] [Google Scholar]
- Roubenoff R, Hughes VA. Sarcopenia: current concepts. J. Gerontol. A. Biol. Sci. Med. Sci. 2000;55:M716–M724. doi: 10.1093/gerona/55.12.m716. [DOI] [PubMed] [Google Scholar]
- Roubenoff R. Physical activity, inflammation, and muscle loss. Nutr. Rev. 2007;65:S208–S212. doi: 10.1111/j.1753-4887.2007.tb00364.x. [DOI] [PubMed] [Google Scholar]
- Srinivas-Shanker U, Wu FC. Frailty and muscle function: role for testosterone? Front. Horm. Res. 2009;37:133–149. doi: 10.1159/000176050. [DOI] [PubMed] [Google Scholar]
- Tomas J, Ferre J, Mayoya E, Fenoll R, Brunet R. Morphometric study of neuromuscular synapses in the adult rat with special reference to the modeling concept. Biol. Cell. 1987;60:133–144. doi: 10.1111/j.1768-322x.1987.tb00553.x. [DOI] [PubMed] [Google Scholar]
- Turturro A, Witt WW, Lewis S, Hass BS, Lipman RD, Hart RW. Growth curves and survival characteristics of the animals used in the Biomarkers of Aging Program. J. Gerontol. A. Biol. Sci. Med. Sci. 1999;54:B492–B501. doi: 10.1093/gerona/54.11.b492. [DOI] [PubMed] [Google Scholar]
- Vandervoort AA. Aging of the human neuromuscular system. Muscle Nerve. 2002;25:17–25. doi: 10.1002/mus.1215. [DOI] [PubMed] [Google Scholar]