Abstract
OBJECTIVE
The purpose of our study was to compare the technical performance of full-field digital mammography (FFDM) and screen-film mammography.
MATERIALS AND METHODS
The American College of Radiology Imaging Network Digital Mammographic Imaging Screening Trial enrolled 49,528 women to compare FFDM and screen-film mammography for screening. For quality assurance purposes, technical parameters including breast compression force, compressed breast thickness, mean glandular dose, and the number of additional views needed for complete breast coverage were recorded and analyzed for both FFDM and screen-film mammography on approximately 10% of study subjects at each site.
RESULTS
Technical data were compiled on 5,102 study subjects at 33 sites. Clean data were obtained for 4,366 (88%) of those cases. Mean compression force was 10.7 dN for screen-film mammography and 10.1 dN for FFDM (5.5% difference, p < 0.001). Mean compressed breast thickness was 5.3 cm for screen-film mammography and 5.4 cm for FFDM (1.7% difference, p < 0.001). Mean glandular dose per view averaged 2.37 mGy for screen-film mammography and 1.86 mGy for FFDM, 22% lower for digital than screen-film mammography, with sizeable variations among digital manufacturers. Twelve percent of screen-film mammography cases required more than the normal four views, whereas 21% of FFDM cases required more than the four normal views to cover all breast tissue. When extra views were included, mean glandular dose per subject was 4.15 mGy for FFDM and 4.98 mGy for screen-film mammography, 17% lower for FFDM than screen-film mammography.
CONCLUSION
Our results show that differences between screen-film mammography and FFDM in compression force and indicated compressed breast thickness were small. On average, FFDM had 22% lower mean glandular dose than screen-film mammography per acquired view, with sizeable variations in average FFDM doses by manufacturer.
Keywords: breast, cancer, digital mammography, mammography, radiation dose, technology
Full-field digital mammography (FFDM) has been under development for two decades [1–5]. In January 2000, the first digital mammography system was approved for clinical use in the United States by the U.S. Food and Drug Administration. In the past 8 years, FFDM systems produced by four manufacturers have been approved for clinical use.
With the introduction of prototype FFDM systems, there was optimism based on phantom testing that FFDM would provide superior breast cancer detection compared with screen-film mammography. In particular, the ability of the radiologist to manipulate digital images in real time promised improved detection of breast cancers [6]. Initial optimism about the promise of FFDM to improve clinical outcomes was tempered by preliminary clinical studies showing that digital mammography in the hands of experienced radiologists had similar performance to screen-film mammography, with a suggestion that sensitivity and receiver operating characteristic (ROC) performance might be inferior with FFDM [7, 8]. These early studies were limited in power by the number of study participants and, in particular, by the number of cancers found in an asymptomatic, normal-risk screening population.
The American College of Radiology Imaging Network (ACRIN) Digital Mammographic Imaging Screening Trial (DMIST) was designed with adequate power to detect a small (0.06) difference in ROC curve areas between screen-film mammography and FFDM, if one existed [9]. Like the previous screening study conducted in the United States [7, 8], this study was designed as a paired study in which each study participant, under informed consent, received both screen-film mammography and FFDM. Accrual to ACRIN DMIST occurred between October 2001 and November 2003. A total of 49,528 women participated. The primary study goal of DMIST was to compare single, independent interpretations of screen-film mammography and FFDM in terms of area under the ROC curve [9]. The results of the primary study have been reported elsewhere, showing a nonsignificant difference between digital and film for the entire study group [10]. The primary study found significantly higher ROC curve areas for FFDM compared with screen-film mammography, however, in three overlapping subgroups: women under 50 years old, pre- and perimenopausal women, and women with heterogeneously or extremely dense breasts [10, 11].
As a quality assurance measure in support of that primary goal, the DMIST study design included collection of technical parameters for both screen-film mammography and FFDM on a sample of approximately 10% of the subjects accrued at each site. In addition, the number of additional views (beyond the normal four views needed for a bilateral screening mammogram) was recorded on this same subset of subjects at each institution. The number of extra views required is of interest because of the more limited detector size of some fixed-detector FFDM systems compared with screen-film mammography. Also of interest is the difference in breast dose between FFDM and screen-film mammography. The difference in the number of views has an important impact on total breast dose as well as work-flow in digital mammography. The effects on breast dose of modality, number of extra views, and other technical parameters are discussed in this article.
Materials and Methods
Technical Parameters
Technical parameters were recorded by the technologist for each exposure on both screen-film mammography and FFDM for the first 85–100 study subjects at each of 33 ACRIN DMIST sites. Technical parameters also were recorded on a smaller sample of subjects (15–50) from each site at or near the end of the study and on 45–50 subjects during the middle of the study for the 10 longest-accruing DMIST sites. Recorded parameters included laterality and view, compressed breast thickness, compression force, target material, filtration material, tube peak kilovoltage (kVp), and the exposure factors in milliampere-seconds (mAs). Other machine parameters, such as beam half-value layer (HVL) and radiation output (mR per mAs), were obtained from physics evaluations conducted on each type of digital and screen-film unit. These measurements enabled calculation of the estimated mean glandular dose from each exposure. A secondary goal of DMIST was to compare mean glandular dose of FFDM to that of screen-film mammography, not just on phantom exposures but on an adequate sample of study subjects.
Five different digital mammography systems from four manufacturers were used in ACRIN DMIST: SenoScan (Fischer Imaging), 5000D CR System (Fujifilm Medical Systems USA), Senographe 2000D (GE Healthcare), and Lorad/Hologic CCD (charge-coupled device) and Selenia (Hologic). Hologic commercialized only the Selenia system, not the CCD system. These digital systems used several different strategies for determining exposure techniques. Two digital systems, the SenoScan and CCD array system, used manual exposure settings for all clinical exposures (Table 1). Because of its slot-scanning design, the SenoScan system used a fixed exposure time of 5.2 seconds. To sustain constant exposure output for that duration, the system design incorporated a tungsten-rhenium (W-Re) target material with aluminum filtration. Tube current, measured in milliamperes, was manually selected from a range between 80 and 230 mA, yielding an effective mAs exposure factor between 18.2 and 52.4 mAs because of the limited (0.23 second) duration that the x-ray beam in the slot-scanning system exposed each segment of the breast. The adjustment of mAs on SenoScan systems was made manually by the technologist based on breast thickness and, in practice, was varied over a narrower range.
TABLE 1.
Technique Parameter Options and Ranges for the Digital Mammography Systems Used in the American College of Radiology Imaging Network (ACRIN) Digital Mammographic Imaging Screening Trial (DMIST)
| Manufacturer | Model | Target | Filtration | kVp Range | mAs Range |
|---|---|---|---|---|---|
| Fischer Imaging | SenoScan | W-Re | Al | 20–45 (22–39) | 18–52, 80–230 mA; (18–49, 80–217 mA) |
| Fujifilma | 5000D (CR) | Mo | Mo | (24–30) | (18–417) |
| Mo | Rh | (26–32) | (56–240) | ||
| Rh | Rh | (30–31) | (88–247) | ||
| GE Healthcare | Senographe 2000D | Mo | Mo | 22–35 (22–33) | 4–400 (21–387) |
| Mo | Rh | 22–40 (26–31) | 4–400 (58–399) | ||
| Rh | Rh | 25–49 (26–32) | 4–320 (28–317) | ||
| Hologic (CCD or Selenia) | Fiber Optic-CCD Array | Mo | Mo | 20–35 (24–32) | 3–600 (35–489) |
Note—For ranges, the first listing is the theoretic range provided by the manufacturer, the ranges in parentheses are ranges of parameters used in ACRIN DMIST. W-Re = tungsten-rhenium, Al = aluminum, Mo = molybdenum, Rh = rhodium.
Automatic exposure control was used on existing mammography systems with Fujifilm CR cassettes. Density control was adjusted to approximately equalize dose between screen-film mammography and CR.
The 5000D CR systems in DMIST used the same automatic exposure control systems used for screen-film mammography, with the automated exposure control (AEC) system density control adjusted to match the exposure output and dose of screen-film mammography.
The Senographe 2000D systems had an AEC that determined the target material (molybdenum or rhodium) and filtration (molybdenum [Mo] or rhodium with Mo target, rhodium filtration with Rh target), tube peak kilovoltage, and mAs exposure based on indicated breast thickness and results of a brief preexposure. The preexposure measured the signal to the detector in the region where the exposure transmitted by the breast was lowest, basing the selection of technique factors on obtaining adequate detector signal in this region. This automated exposure technique, called automatic optimization of parameters, could be used in one of three modes: contrast, standard, or dose mode, in which radiographic contrast- or signal-to-noise ratio was progressively traded for dose reduction. Most Senographe 2000D digital sites used automatic optimization of parameters contrast or standard mode.
The Hologic Selenia system used an AEC system similar to the Senographe 2000D, basing exposure on registered breast thickness and signal recorded during a brief preexposure.
Mean glandular dose was calculated for each exposure based on the methods of Stanton et al. [12], using conversion factors determined by Wu et al. [13] and parameterization of exposure to dose mAs conversion determined by Sobol and Wu [14]. Average glandular dose was calculated for each exposure based on technique factors including target–filter combination, tube peak kilovoltage, mAs exposure, mR/mAs output of each machine for each target-filter and tube peak kilovoltage, and compressed breast thickness.
The number of additional views of each breast performed beyond the normal two screening views was recorded for both screen-film mammography and FFDM for the same set of subjects for whom full technical parameters were collected. We report additional view data in two ways: by reporting the percentage of cases in either screen-film mammography or FFDM for which any extra views were required, not distinguishing between one and multiple additional views, and by reporting the actual number of additional exposures required with each modality. Using the second method of reporting additional views, we can estimate the effect of additional views acquired by each modality on mean glandular dose to the subject. For example, if the mean glandular dose per view were 2.0 mGy and 10% more views per breast were required for a given system, the view-influenced total mean glandular dose would be 4.4 mGy, 10% higher than the two-view mean glandular dose of 4.0 mGy to each breast. The view-influenced total mean glandular dose per breast was reported by digital manufacturer for both screen-film mammography and FFDM.
Statistical Analysis
Technical parameters, including breast compression force, compressed breast thickness, mean glandular dose, and number of additional views needed for complete breast coverage, were collected on 5,102 cases for both screen-film mammography and FFDM, of which 5,093 cases were usable and sent for review and data cleaning by a medical physicist with expertise in breast imaging. Data cleaning identified data that were out of range, exhibited marked systematic differences, appeared to be reported in incorrect units, or were physically impossible. Identified data were referred to the site medical physicist for investigation and correction, if possible. Where correction was not possible, incorrect data were removed from the cleaned data set. The most frequent causes of cleaning were data-entry errors, use of incorrect units, and systematic differences identified at the site. The main systematic difference was incorrectly reported breast thickness on the digital or screen-film unit. The final analysis set after data cleaning consisted of 4,366 cases (88% of cases on which technical data were collected). Measurements of compression force and compressed breast thickness and estimates of mean glandular dose were used for each of the four primary views (craniocaudal and mediolateral oblique views of each breast) obtained in a subject. Estimates for compression force, breast thickness, and mean glandular dose were first averaged over all views to get a mean estimate for each subject. Comparisons between the screen-film mammography and FFDM techniques were based on the pairwise differences in these measures by subject.
To study the dependence of mean glandular dose on breast thickness, doses for a particular modality were categorized in 1-cm increments of compressed breast thickness between 2 cm and 8 cm, with additional categories corresponding to less than 2 cm and greater than 8 cm. Binned data were analyzed for differences in mean glandular dose per view between screen-film mammography and FFDM within each category of breast thickness using average breast thickness measured at screen-film mammography as the patient-specific reference standard for breast thickness. Paired Student’s t tests were used to compute p values for comparing screen-film mammography and FFDM dose for each 1-cm increment of breast thickness (as measured by screen-film mammography) stratified by digital machine type and modality. Adjustment for multiple testing was done separately for comparisons within and across machine types. For comparisons within a machine type, a Bonferroni correction required p values to be less than 0.00625 for significance, whereas for comparisons across machines, a significant p value had to be less than 0.00125.
The overall dependence of dose on breast thickness was tested through a one-way analysis of variance F-test using the different thickness categories as fixed treatment levels. This analysis was done within each machine and modality. SAS software, version 9.1.3 (SAS Institute), was used for the analysis.
Results
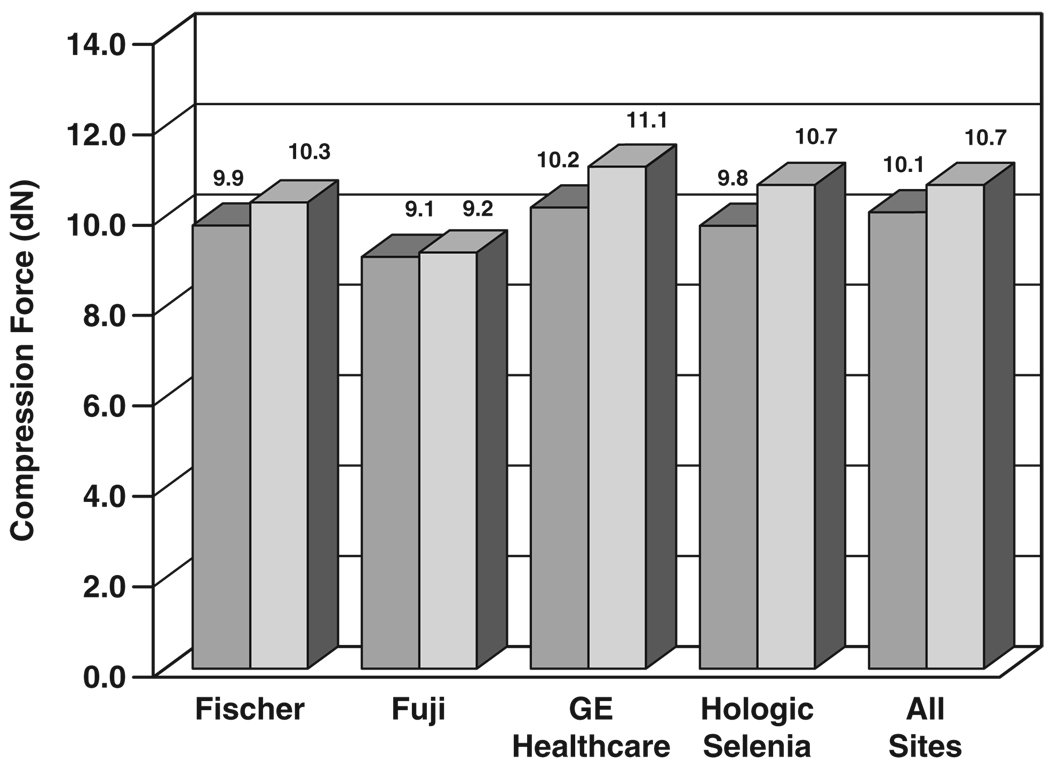
Figure 1 shows mean compression forces for screen-film mammography and FFDM for the four digital manufacturers’ units; early installations of the Fischer SenoScan FFDM unit did not provide an indication of compression force. By digital manufacturer, the mean compression force was 9.86 dN for Fischer FFDM and 10.31 dN for corresponding screen-film mammography exposures (4.4% difference, p = 0.006), 9.06 dN for Fujifilm CR and 9.20 dN for corresponding screen-film mammography exposures (1.5% difference, p < 0.001), 10.22 dN for GE Healthcare digital units and 11.14 dN for corresponding screen-film mammography exposures (8.3% difference, p < 0.001), 13.74 dN for Hologic CCD FFDM and 12.89 dN for corresponding screen-film mammography exposures (6.6% difference, p < 0.001, not plotted because this system was not commercialized), and 9.76 for Hologic Selenia digital and 10.55 dN for corresponding screen-film mammography exposures (7.5% difference, p = 0.005). Averaged over all four screening views per subject acquired on 3,688 subjects with available force data over all 33 sites, mean compression force was 10.13 dN (22.8 pound-force [lbf] [10.3 kilogram-force (kgf)]) for FFDM and 10.72 dN (24.1 lbf [10.9 kgf]) for screen-film mammography (5.5% difference, p < 0.001).
Fig. 1.
Bar graph shows comparison of breast compression force between digital (darker gray) and screen-film (lighter gray) mammography by digital manufacturer, averaged over all views, subjects, and sites.
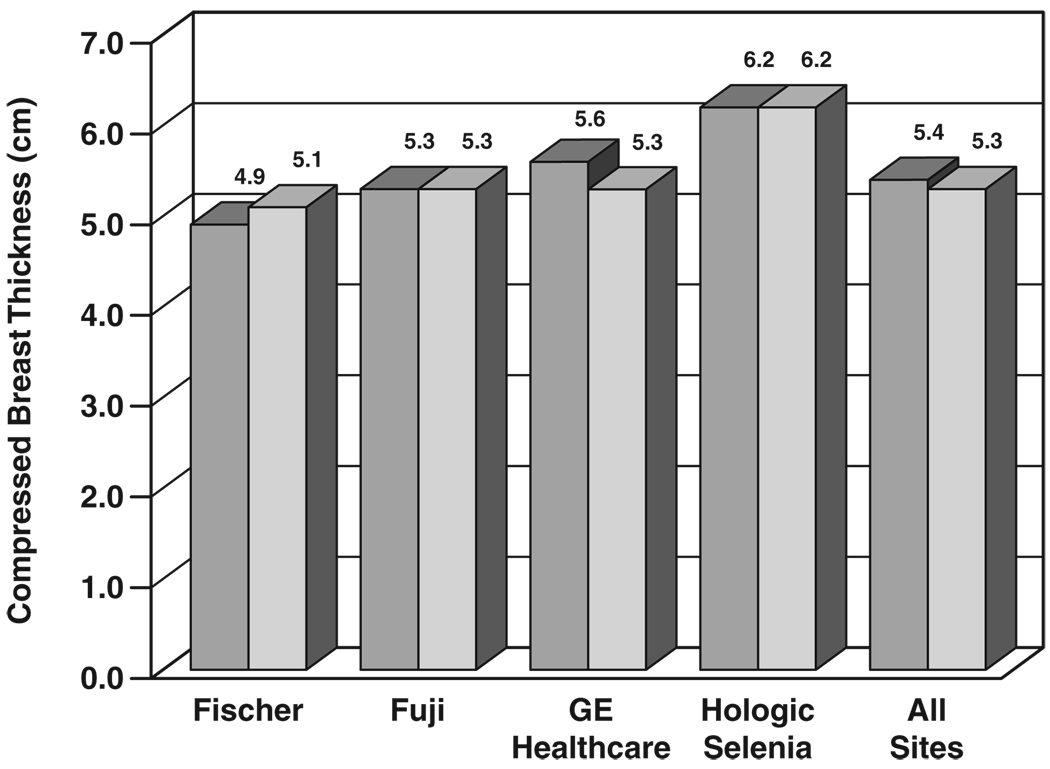
Figure 2 shows the mean results for indicated compressed breast thickness at all sites. By digital manufacturer, mean compressed breast thickness was 4.85 cm for Fischer FFDM and 5.12 cm for corresponding screen-film mammography exposures (5.3% difference, p < 0.001), 5.32 cm for Fujifilm CR and 5.33 cm for corresponding screen-film mammography exposures (0.2% difference, p = 0.33), 5.58 cm for GE Healthcare digital and 5.30 cm for corresponding screen-film mammography exposures (5.3% difference, p < 0.001), 5.40 cm for Hologic CCD and 5.36 cm for corresponding screen-film mammography exposures (0.7% difference, p = 0.175, not plotted), and 6.21 cm for Hologic Selenia and 6.01 cm for corresponding screen-film mammography exposures (3.3% difference, p < 0.001). The larger difference for Fischer digital versus screen-film mammography may have been because the Fischer FFDM compression paddle was curved and had greater flexibility than compression paddles on screen-film mammography units. Averaged over all views per subject on 4,334 subjects with available compression data over all 33 sites, mean compressed breast thickness was 5.38 cm for FFDM and 5.29 cm for screen-film mammography (1.7% difference, p < 0.001).
Fig. 2.
Bar graph shows comparison of compressed breast thickness between digital (darker gray) and screen-film (lighter gray) mammography by digital manufacturer, averaged over all views, subjects, and sites.
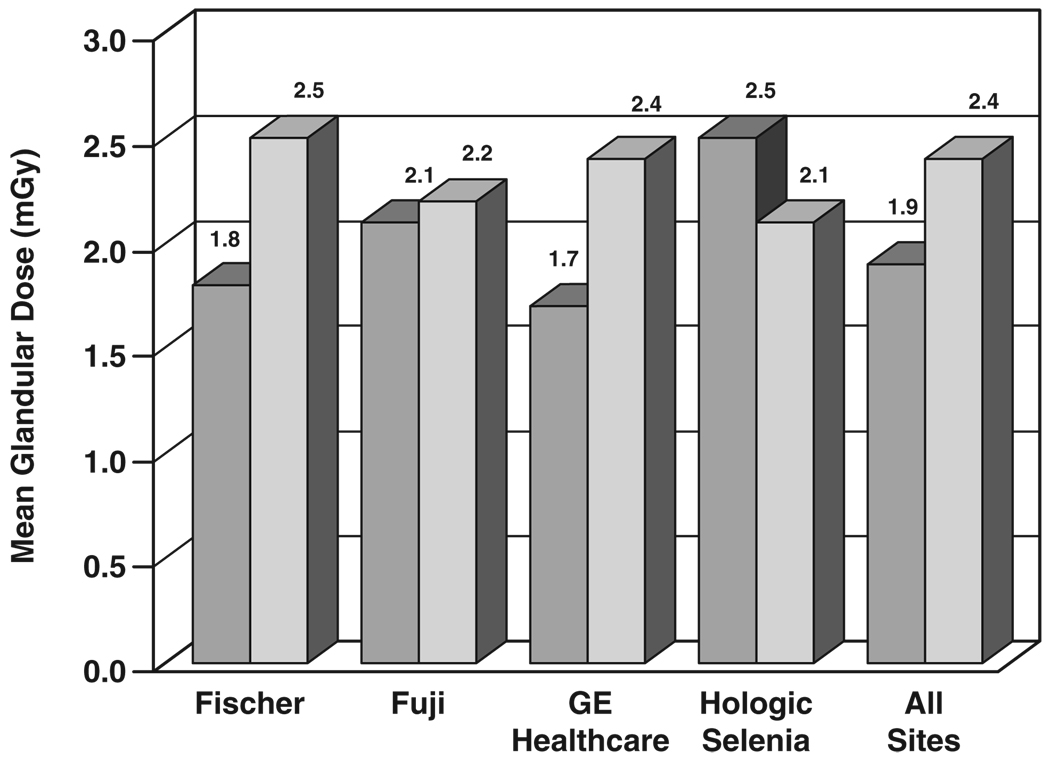
Figure 3 shows results for mean glandular dose by digital manufacturer versus screen-film for the same set of sites and subjects, along with collective mean values. For the seven Fischer digital sites, mean glandular dose from a single view was 1.78 mGy for FFDM and 2.54 mGy for corresponding screen-film mammography exposures, 30% lower for Fischer FFDM than for screen-film mammography. For the six Fujifilm CR sites, mean glandular dose from a single view was 2.14 mGy and 2.21 mGy for corresponding screen-film mammography exposures, 3% lower for Fujifilm CR than for screen-film mammography. For the 18 GE Healthcare sites, mean glandular dose was 1.69 mGy for FFDM and 2.36 mGy for corresponding screen-film mammography exposures, 28% lower for FFDM than screen-film mammography. The five Hologic sites were broken down by machine type. For CCD FFDM systems, data were collected for 341 subjects, yielding a mean glandular dose of 2.21 mGy for FFDM and 2.47 mGy for paired screen-film mammography exposures, 11% lower for CCD FFDM than screen-film mammography (not plotted). For Hologic Selenia units, data were collected on only 115 subjects (112 of whom had dose data available), yielding a mean glandular dose of 2.50 mGy for FFDM and 2.11 mGy for paired screen-film mammography exposures, 18% higher for Selenia FFDM than screen-film mammography. For all 33 sites, mean dose from a single FFDM view was 1.86 mGy, whereas mean glandular dose from a single screen-film mammography view was 2.37 mGy, 22% lower for FFDM than for screen-film mammography.
Fig. 3.
Bar graph shows comparison of mean glandular dose from single view for digital (darker gray) and screen-film (lighter gray) mammography by digital manufacturer, averaged over all views, subjects, and sites.
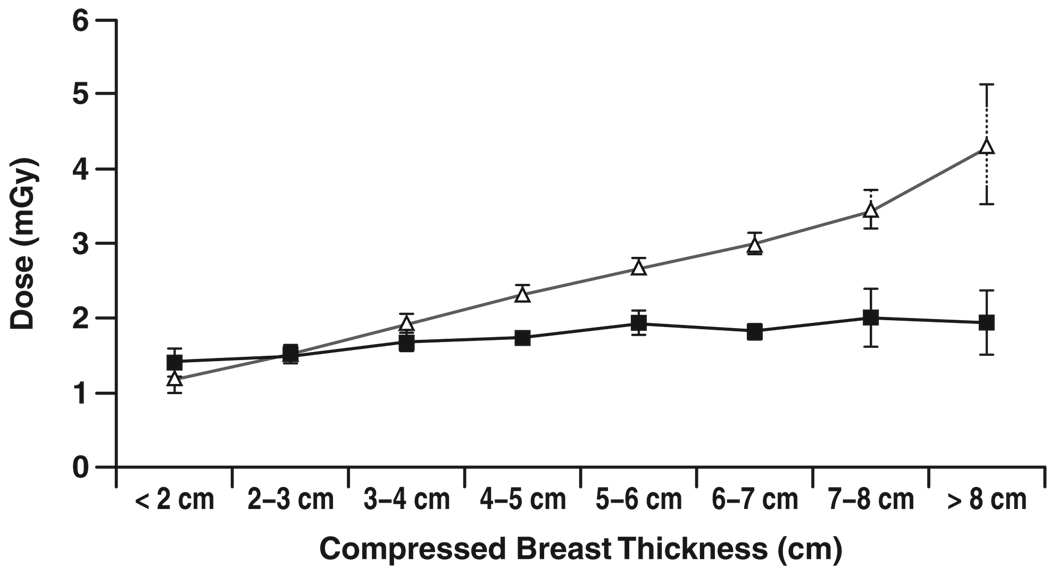
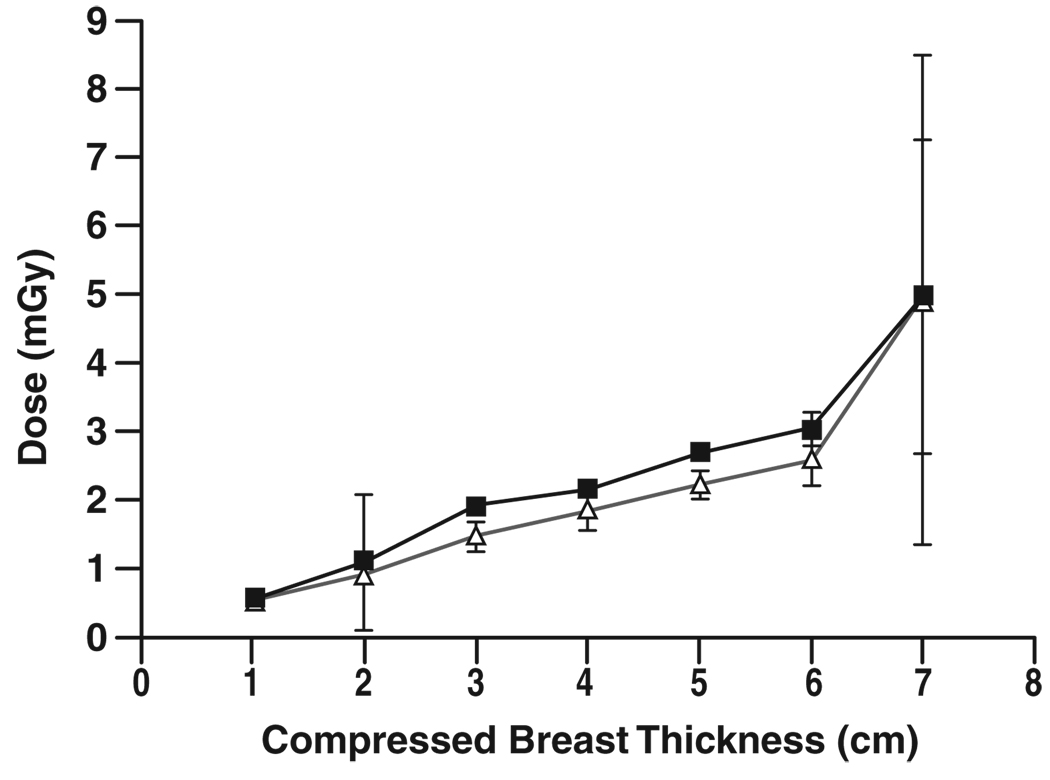
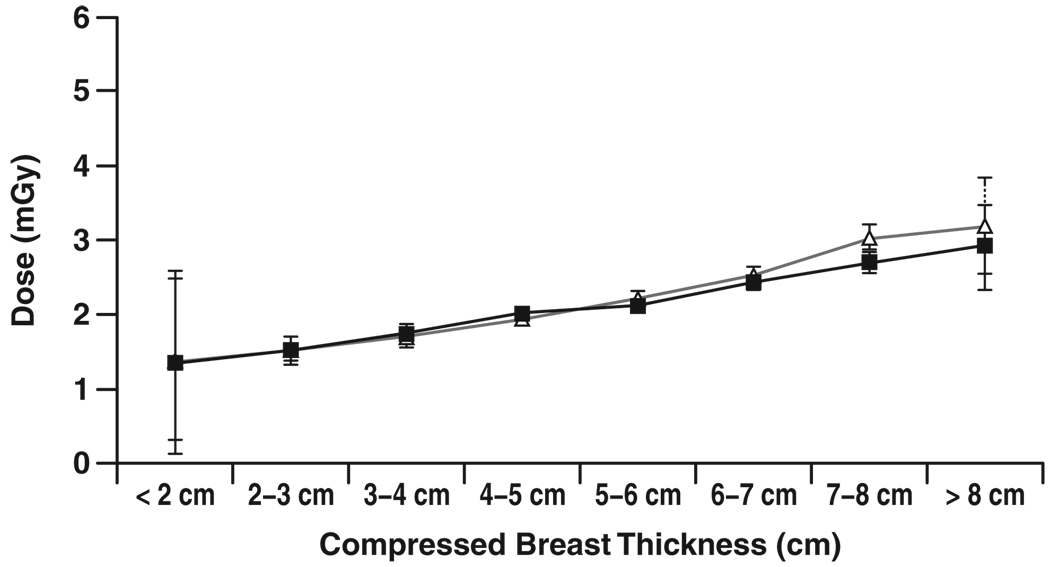
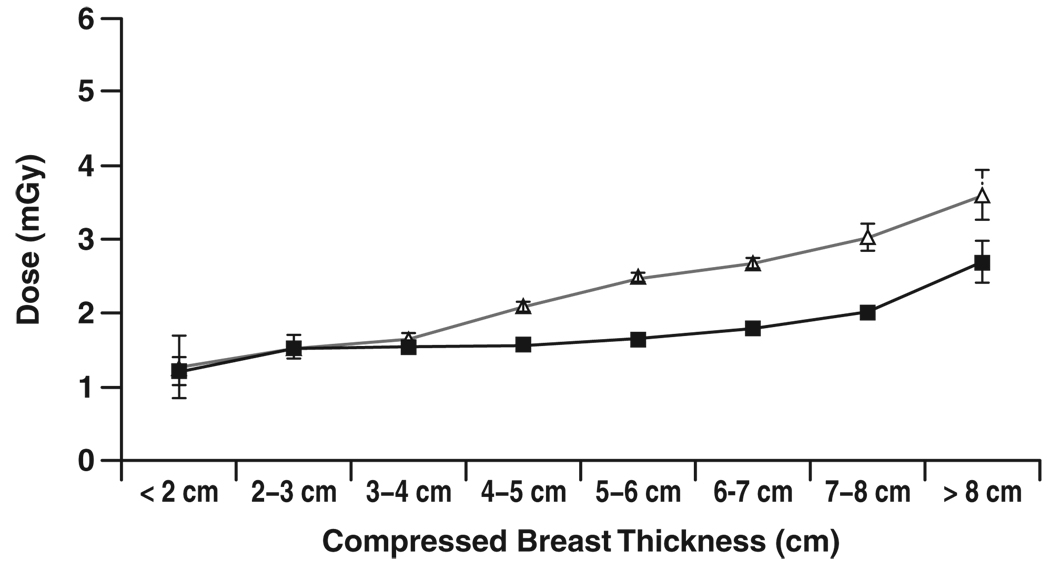
Figure 4–Figure 7 show graphs of mean glandular dose per view versus compressed breast thickness for paired screen-film mammography and FFDM examinations by manufacturer, binned in 1-cm steps of breast thickness. Figure 5 for the Fujifilm CR digital system shows a reasonable match between mean glandular doses for screen-film mammography and FFDM across the full range of compressed breast thickness; as breast thickness increased, mean glandular dose increased in a similar manner for both screen-film mammography and FFDM. Figure 4 for the Fischer SenoScan system and Figure 6 for the GE Healthcare Senographe 2000D system show similar results between screen-film mammography and FFDM for thin breasts, with mean glandular doses for FFDM lower than screen-film mammography doses and increasing more slowly than screen-film mammography doses with increasing breast thickness for average to thicker breasts. Figure 7 for Hologic Selenia digital systems shows an opposite trend, with FFDM doses higher than screen-film mammography doses over the entire thickness range.
Fig. 4.
Chart shows comparison of mean glandular dose from single view for screen-film (Δ) and digital (■) mammography versus compressed breast thickness for examinations conducted at Fischer SenoScan digital sites. Error bars represent 95% CIs. Where 95% CIs do not overlap, differences are statistically significant.
Fig. 7.
Chart shows comparison of mean glandular dose from single view for screen-film (Δ) and digital (■) mammography versus compressed breast thickness for examinations conducted at Hologic Selenia digital sites. No data were recorded below 2-cm breast thickness. Error bars represent 95% CIs. Where 95% CIs do not overlap, differences are statistically significant.
Fig. 5.
Chart shows comparison of mean glandular dose from single view for screen-film (Δ) and digital (■) mammography versus compressed breast thickness for examinations conducted at Fujifilm CR digital sites. Error bars represent 95% CIs. Where 95% CIs do not overlap, differences are statistically significant.
Fig. 6.
Chart shows comparison of mean glandular dose from single view for screen-film (Δ) and digital (■) mammography versus compressed breast thickness for examinations conducted at GE Healthcare Senographe 2000D digital sites. Error bars represent 95% CIs. Where 95% CIs do not overlap, differences are statistically significant.
Statistical tests comparing screen-film mammography to FFDM doses for each binned breast thickness showed that mean glandular doses for Fischer and GE Healthcare FFDM systems were significantly lower than for the corresponding paired screen-film mammography examinations for compressed breast thickness greater than 3 cm for Fischer and greater than 4 cm for GE Healthcare (p ≤ 0.0005), even after Bonferroni correction for multiple comparisons. Selenia doses were significantly higher than screen-film mammography doses for 4–5 cm and 6–8 cm thicknesses (p < 0.005).
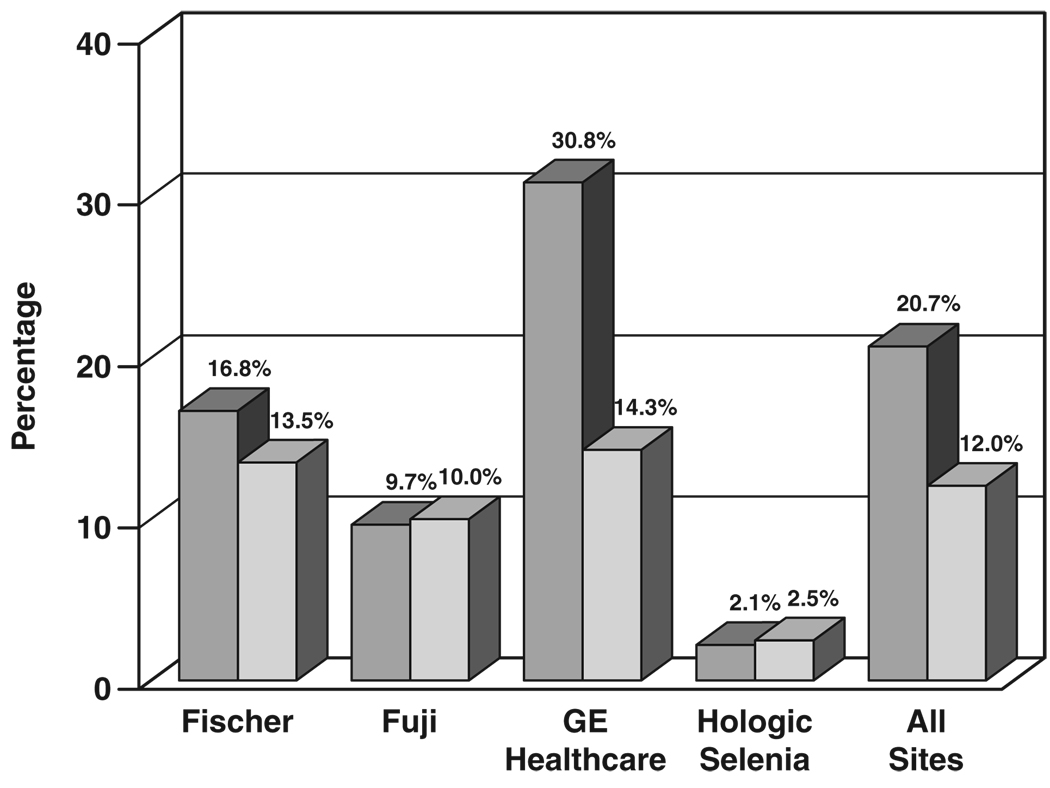
Figure 8 shows the fraction of cases requiring one or more extra views for FFDM and screen-film mammography by digital manufacturer and overall. Fischer FFDM sites required at least one extra view on 16.8% of FFDM examinations and 13.5% of paired screen-film mammography examinations, a difference of 3.3 percentage points. Fujifilm FFDM sites required at least one extra view on nearly the same fraction of FFDM and screen-film mammography examinations, 9.7% for FFDM and 10.0% for screen-film mammography, a difference of −0.3 percentage points. GE Healthcare FFDM sites required at least one extra view on 30.8% of FFDM examinations and 14.3% of paired screen-film mammography examinations, a difference of 16.5 percentage points. Hologic CCD sites required at least one extra view on 5.6% of FFDM examinations and 4.3% of screen-film mammography examinations, a difference of 1.3 percentage points. Hologic Selenia sites required at least one extra view on 2.1% of FFDM examinations and 2.5% of screen-film mammography examinations, a difference of −0.4 percentage points. Averaged over all digital machine types, FFDM required at least one extra view on 20.7% of examinations, whereas screen-film mammography needed at least one extra view on only 12.0% of examinations, a difference of 8.7 percentage points.
Fig. 8.
Bar graph shows comparison of percentage of examinations requiring one or more extra views for digital (darker gray) and screen-film (lighter gray) mammography by digital manufacturer and for technical data collected at all sites.
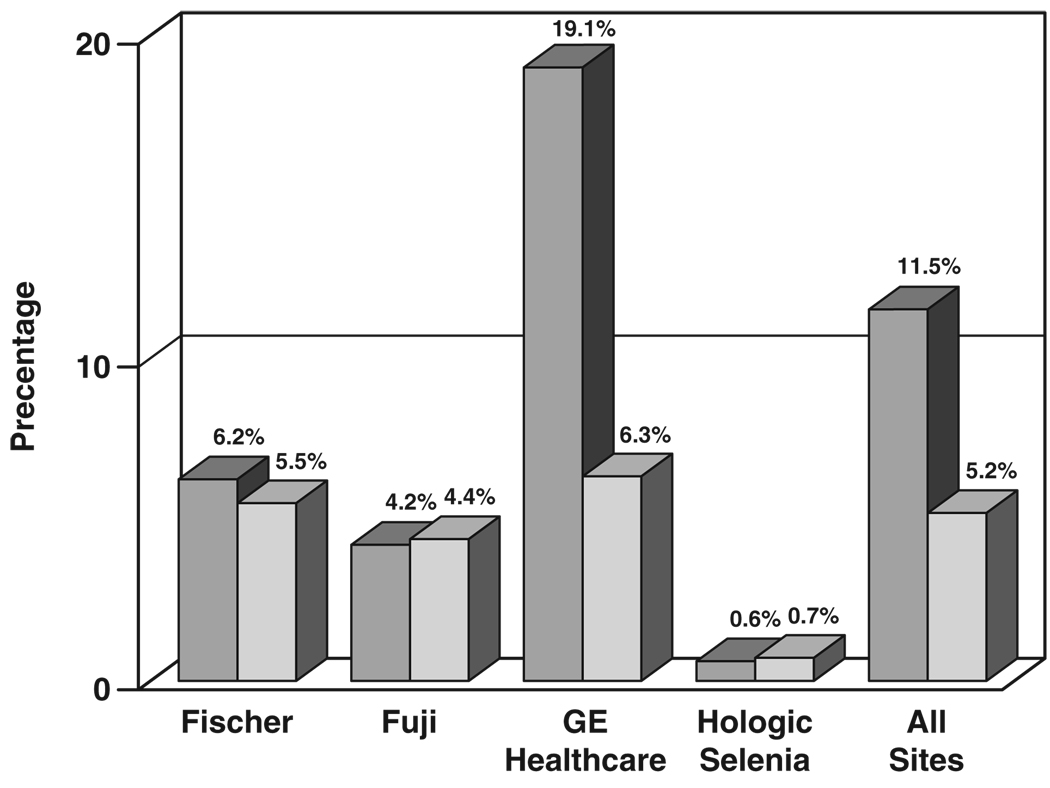
Figure 9 shows the percentage of extra views required beyond four screening views of each subject (craniocaudal and mediolateral oblique views of each breast). For subjects imaged at Fischer FFDM sites, FFDM required 6.2% more views (than the four per subject), whereas screen-film mammography required 5.5% more views, a difference of 0.7 percentage point. For subjects imaged at Fujifilm CR FFDM sites, FFDM required 4.2% more views, whereas screen-film mammography required 4.4% more views, 0.2 percentage point fewer for CR. For GE Healthcare FFDM sites, FFDM required 19.1% more views, whereas screen-film mammography required 6.3%, a difference of 12.7 percentage points more for FFDM than screen-film mammography. For Hologic CCD sites, FFDM required 4.1% more views, whereas screen-film mammography required 1.7% more views, a difference of 2.4 percentage points more for FFDM than screen-film mammography. For Hologic Selenia sites, FFDM required 0.6% more views, whereas screen-film mammography required 0.7% more views, a difference of 0.1 percentage point fewer for FFDM than screen-film mammography. Averaged over all digital machine types, FFDM required 11.5% more views, whereas screen-film mammography required 5.2% more views, a difference of 6.4 percentage points more for FFDM than screen-film mammography. The difference in fraction of extra views needed between FFDM and screen-film mammography was statistically significant for the GE Healthcare 2000D and Hologic CCD FFDM systems and for the entire study (p < 0.001).
Fig. 9.
Bar graph shows comparison of percentage of extra views required beyond two views of each breast for digital (darker gray) and screen-film (lighter gray) mammography by digital manufacturer and for technical data collected at all sites.
Further analyses at a subsample of sites indicated that the mean glandular dose per view for extra views was within 5% of the mean glandular dose per view of the four primary views acquired at each site, and in cases in which the full breast could not be imaged by a single view in a given projection, the percentage of fibroglandular tissue irradiated in extra views was approximately 95% of the amount of fibroglandular tissue irradiated in primary views. Hence, in our analysis, we assumed that any extra view acquired on a given unit contributed the same mean glandular dose as a primary view acquired on that unit.
The effect of extra views on the total dose comparison of FFDM to screen-film mammography was minor for Fischer, Fujifilm, and Hologic Selenia digital systems because the number of extra views differed little between screen-film mammography and FFDM (Table 2). For example, Fischer FFDM required only 0.7 percentage point more views per breast than screen-film mammography on the same subjects, so for Fischer FFDM, mean glandular dose per view and total mean glandular dose per subject (or per breast) were both 30% lower than that of screen-film mammography, even with the effect of extra views included (Table 3). Fujifilm required 0.2 percentage point fewer views with CR than with screen-film mammography, so the effect of extra views on the breast dose comparison of Fujifilm FFDM to screen-film mammography was negligible: Fujifilm CR had 3.2% lower mean glandular dose per view and 3.6% lower total mean glandular dose per subject than screen-film mammography. Hologic CCD required 2.4 percentage points more extra views with FFDM than with screen-film mammography, so its mean glandular dose went from 10.5% less than screen-film mammography per primary view to 8.3% less than screen-film mammography in total mean glandular dose per subject. Hologic Selenia required approximately the same number of extra views with FFDM as with screen-film mammography, so the mean glandular dose remained 18.5% higher than the screen-film mammography mean glandular dose per view and per subject.
TABLE 2.
Estimates of the Number of Extra Views Per Examination by Digital Manufacturer and Overall
| Manufacturer | Primary Views | Extra Views | Extra Views (%) | Percentage Point Difference |
p | |||
|---|---|---|---|---|---|---|---|---|
| SFM | FFDM | SFM | FFDM | SFM | FFDM | |||
| Fischer (n = 1,070) | 4,250 | 4,247 | 233 | 262 | 5.5 | 6.2 | 0.7 | 0.101 |
| Fujifilm (n = 911) | 3,624 | 3,624 | 159 | 152 | 4.4 | 4.2 | −0.2 | 0.413 |
| GE Healthcare (n = 2,406) | 9,514 | 9,532 | 600 | 1,816 | 6.3 | 19.1 | 12.7 | < 0.001 |
| Hologic CCD (n = 395) | 1,568 | 1,568 | 27 | 64 | 1.7 | 4.1 | 2.4 | < 0.001 |
| Hologic Selenia (n = 239) | 951 | 952 | 7 | 6 | 0.7 | 0.6 | −0.1 | 0.706 |
| All (n = 5,021) | 19,907 | 19,923 | 1,026 | 2,300 | 5.2 | 11.5 | 6.4 | < 0.001 |
Note—Data in parentheses are number of subjects. SFM = screen-film mammography, FFDM = full-field digital mammography.
TABLE 3.
Estimate of Average Mean Glandular Dose (MGD) Per View and Average MGD Per Subject, Including Extra Views, by Digital Manufacturer And Overall
| Manufacturer | Average MGD Per View (mGy) | Percentage Decrease Per View With FFDM |
Average MGD Dose Per Subjecta (mGy) | Percentage Decrease in Average MGD Per Subject With FFDMa |
||
|---|---|---|---|---|---|---|
| SFM | FFDM | SFM | FFDM | |||
| Fischer (n = 1,070) | 2.54 | 1.78 | 29.9 | 5.36 | 3.77 | 29.6 |
| Fujifilm (n = 911) | 2.21 | 2.14 | 3.2 | 4.62 | 4.45 | 3.6 |
| GE Healthcare (n = 2,406) | 2.36 | 1.69 | 28.4 | 5.03 | 4.02 | 20.0 |
| Hologic CCD (n = 395) | 2.47 | 2.21 | 10.5 | 5.01 | 4.60 | 8.3 |
| Hologic Selenia (n = 239) | 2.11 | 2.50 | −18.5 | 4.24 | 5.03 | −18.5 |
| All (n = 5,021) | 2.37 | 1.86 | 21.5 | 4.98 | 4.15 | 16.7 |
Note—Data in parentheses are number of subjects. SFM = screen-film mammography, FFDM = full-field digital mammography.
From two primary views per breast and all extra views, averaged over all subjects.
The effect of extra views on total dose with GE Healthcare digital units was more pronounced because 12.7 percentage points more exposures were required for FFDM than for the corresponding set of screen-film mammography examinations. As a result, even though average FFDM mean glandular dose per view was 28% lower than that for screen-film mammography, the average total mean glandular dose per subject was 20% lower for FFDM than screen-film mammography when both the difference in dose per view and the numbers of extra views were taken into account. When averaged over all digital manufacturers, mean glandular dose per primary view was 22% lower for FFDM than for screen-film mammography, whereas the total mean glandular dose per subject was 17% lower for FFDM than screen-film mammography. The total effective mean glandular dose from all acquired views was 4.15 mGy for FFDM and 4.98 mGy for screen-film mammography when all screening views, primary and extra, were included in the dose estimate (Table 3).
Discussion
In DMIST, paired FFDM and screen-film mammography examinations were performed on a given participant by the same technologist, with the modality order randomized. Each technologist was instructed to use similar compression force and compressed breast thickness for FFDM and screen-film mammography for a given study participant. Technical assessment data were collected on a subset of about 10% of participants to assess comparability between the two modalities. Averaged over all views and participants for whom technical data were collected, mean compression forces were 10.1 dN for FFDM and 10.7 dN for screen-film mammography. This 0.59 dN (1.3 lbf [0.6 kgf]) difference in mean compression force is a small, statistically significant, but likely clinically insignificant difference in forces applied in FFDM and screen-film mammography. It is unlikely that the slightly lower compression force used with FFDM played any role in the overall DMIST results, especially because FFDM did not have significantly higher overall ROC curve areas than screen-film mammography (0.775 for FFDM vs 0.744 for screen-film mammography) [10]. The small difference in compression force is more likely random or the result of a few technologists believing that FFDM examinations needed less compression than screen-film mammography examinations.
There is a much smaller fractional difference (1.7%) in mean compressed breast thickness (5.4 cm for FFDM and 5.3 cm for screen-film mammography) between the two modalities. The slightly greater compressed breast thickness with FFDM is consistent with the slightly lower mean compression force with FFDM. It is highly unlikely that this small (1 mm) compressed breast thickness difference is responsible for any difference in DMIST results. It is interesting to note that the mean compressed breast thickness with either modality was considerably larger than the standard American College of Radiology mammography accreditation phantom (4.2 cm) but was in good agreement with previous reports of mean compressed breast thickness in patients [15].
Although the initial design of DMIST attempted to match mean glandular doses for FFDM and screen-film mammography [9], digital mammography technique factors prescribed by equipment manufacturers, either through AEC systems or manual technique charts, yielded doses per view for FFDM that were on average 22% lower than those for screen-film mammography. Most of this difference occurred for two digital manufacturers (Fischer, with 30% lower doses per view than screen-film mammography, and GE Healthcare, with 28% lower doses per view than screen-film mammography). For these two manufacturers, dose differences between FFDM and screen-film mammography occurred primarily for compressed breasts thicker than 4 cm (Fig. 4 and Fig. 6).
The primary reason for lower doses per view with FFDM, especially for thicker breasts, was that for the same breast thickness, FFDM systems selected a harder x-ray beam than screen-film mammography. The use of a harder beam for FFDM takes advantage of fundamental detector differences between most FFDM systems and screen-film mammography. Screen-film cassettes require a softer beam to achieve good x-ray absorption efficiency in the cassette phosphor. Moreover, cassette phosphors cannot be made thicker (which would improve absorption efficiency) without suffering additional blurring due to spread of emitted light in the phosphor material itself. Cesium iodide crystals in the two-stage Fischer and GE Healthcare detectors can be made thick enough to have nearly complete x-ray absorption without affecting blurring because these phosphors have linear crystal structures that help contain the spread of light. Similarly, selenium plates, such as those used in the Hologic system, can be made thick enough to absorb nearly all x-rays, independent of beam energies in the mammography spectrum, without suffering adverse effects in terms of image blurring. Thus, harder x-ray beams can be used with these detectors. There is some loss of tissue contrast with the use of harder x-ray beams, but that can be compensated to some extent by narrowing the window width in the display of digital images.
In addition, the Fischer slot-scanning system provided good scatter rejection without the use of an antiscatter grid. This allowed the slot-scanning system to use reduced primary beam intensity while achieving comparable signal-to-noise ratios to full area detectors that use grids for scatter rejection in contact mode.
The lower dose with FFDM compared with screen-film mammography cannot be explained by the slightly higher indicated breast thickness for FFDM. Typically, under AEC, thicker breasts demand higher doses, which would suggest FFDM doses should be slightly higher than screen-film mammography doses based on the slightly lower average compression force and slightly higher average breast thickness with FFDM. Even if the slightly thicker breasts for FFDM were due to a systematic error in indicated thickness rather than a real effect, a 1-mm error in breast thickness would result in only a 1–2% difference in breast dose, not the observed 22% difference.
One exception to lower doses with FFDM was the Hologic Selenia system, which had an 18% higher dose per view than screen-film mammography. With the introduction of the Selenia detector, Hologic also introduced a new AEC system, with performance that differed from the manual exposure settings used with their CCD detector system. In addition, the Hologic Selenia system was the only digital system in DMIST that was restricted to a Mo–Mo target–filter combination. The softer x-ray beam resulting from the Mo–Mo target–filter combination, along with the AEC settings provided by the manufacturer, was likely responsible for the higher dose of the Hologic Selenia system.
The dose differences between FFDM and screen-film mammography differ for different detector designs, and results found in DMIST may not be representative of current or future results on all digital systems. For example, during DMIST, Fischer and Hologic CCD FFDM systems used manually selected techniques. No clinical system in use today requires the use of manual exposure techniques. Moreover, the AEC system set-up on current commercial systems does not necessarily match those used in DMIST. For example, although the detector is identical between GE Healthcare Senographe 2000D and Senographe DS FFDM systems, the AEC system performance is slightly different, as are manufacturer recommendations about the AEC mode selection, resulting in differences in dose performance. Hologic has now introduced a newer system with a tungsten–silver target–filter combination as a harder x-ray beam alternative to the Mo–Mo systems that were used in DMIST, which will reduce doses from those reported here. Similarly, for the Fujifilm CR systems used in DMIST, AEC techniques on mammography units were adjusted to approximately match the doses from screen-film mammography to comply with the DMIST protocol. This constraint may not apply to currently used CR systems, which use the AEC system of the x-ray unit manufacturer adjusted by the CR system service engineer.
The dose differences among different FFDM manufacturers have, to our knowledge, not been previously published, nor has the effect on dose of extra views that were required by different digital detector sizes. Although there are some differences in the dose performance of new digital systems compared with those used in DMIST, this article provides a reference point at the onset of the adoption of digital mammography to which future doses in digital mammography can be compared. Moreover, dose data are provided on paired screen-film mammography and FFDM examinations on approximately 5,000 subjects collected at 33 sites in the United States and Canada, rather than on phantoms, which are not representative of the North American population in terms of breast thickness, breast density, or resulting mean glandular dose. The dose data in this article also show the detailed dependence of mean glandular dose on compressed breast thickness for both screen-film mammography and various FFDM manufacturers, showing an important difference between FFDM and screen-film mammography.
Our results on extra views needed for FFDM apply to most systems currently in use. Both the Senographe 2000D and the Senographe DS have the same smaller (19 × 23 cm) detector size used in DMIST. The newer Senographe Essential FFDM system has a larger detector size (24 × 31 cm) that would negate the difference in extra views that we observed for Senographe FFDM in DMIST.
Film manufacturers also have introduced new screen-film combinations, such as double-sided screens and double-emulsion films that were not available during DMIST. These new screen-film mammography systems have different speeds that could alter the relative doses between FFDM and screen-film mammography reported here for DMIST [16]. Hence, breast dose along with image quality and other performance parameters should be carefully compared between existing screen-film mammography and any new FFDM system being considered for integration into a breast imaging practice. The results of ACRIN DMIST suggest, however, that new FFDM systems should be capable of achieving equal or improved cancer detection at equal or lower breast doses than screen-film mammography.
Acknowledgments
The authors gratefully acknowledge the important contributions of the many people at ACRIN headquarters and at the recruiting sites in the completion of this work. Special thanks go to the site principal investigators, lead medical physicists, site radiologists, technologists, and research assistants at all recruiting sites and to the women who volunteered to participate in ACRIN DMIST.
Supported by grants U01 CA079778 and U01 CA080098 from the National Cancer Institute and by funding from the Lynn Sage Breast Cancer Research Foundation.
Footnotes
R. E. Hendrick is a consultant to GE Healthcare on digital breast tomosynthesis and other breast imaging projects, projects not related to DMIST. M. J. Yaffe has a research collaboration agreement with GE Healthcare on digital breast tomosynthesis and other research projects breast imaging not related to DMIST. S. Acharyya has been a consultant for GE Healthcare. The project concerned was not related to DMIST.
References
- 1.Nishikawa RM, Mawdsley GE, Fenster A, Yaffe MJ. Scanned-projection digital mammography. Med Phys. 1987;14:717–727. doi: 10.1118/1.596147. [DOI] [PubMed] [Google Scholar]
- 2.Rowlands JA, Hunter DM, Araj N. X-ray imaging using amorphous selenium: a photoinduced discharge readout method for digital mammography. Med Phys. 1991;18:421–431. doi: 10.1118/1.596689. [DOI] [PubMed] [Google Scholar]
- 3.Zhao W, Law J, Waechter D, Huang Z, Rowlands JA. Digital radiology using active matrix readout of amorphous selenium: detectors with high voltage protection. Med Phys. 1998;25:539–549. doi: 10.1118/1.598229. [DOI] [PubMed] [Google Scholar]
- 4.Shtern F. Digital mammography and related technologies: a perspective from the National Cancer Institute. Radiology. 1992;183:629–630. doi: 10.1148/radiology.183.3.1584908. [DOI] [PubMed] [Google Scholar]
- 5.Vedantham S, Karellas A, Suryanarayanan S, et al. Full breast digital mammography with an amorphous silicon-based flat panel detector: physical characteristics of a clinical prototype. Med Phys. 2000;27:558–567. doi: 10.1118/1.598895. [DOI] [PMC free article] [PubMed] [Google Scholar]
- 6.Pisano ED, Yaffe MJ. Digital mammography. Radiology. 2005;234:353–362. doi: 10.1148/radiol.2342030897. [DOI] [PubMed] [Google Scholar]
- 7.Lewin JM, Hendrick RE, D’Orsi CJ, et al. Comparison of full-field digital mammography to screen-film mammography for cancer detection: results of 4,945 paired examinations. Radiology. 2001;218:873–880. doi: 10.1148/radiology.218.3.r01mr29873. [DOI] [PubMed] [Google Scholar]
- 8.Lewin JM, D’Orsi CA, Hendrick RE, et al. Clinical comparison of full-field digital mammography and screen-film mammography for detection of breast cancer. AJR. 2002;179:671–677. doi: 10.2214/ajr.179.3.1790671. [DOI] [PubMed] [Google Scholar]
- 9.Pisano ED, Gatsonis CA, Yaffe MJ, et al. American College of Radiology Imaging Network Digital Mammographic Imaging Screening Trial: objectives and methodology. Radiology. 2005;236:404–412. doi: 10.1148/radiol.2362050440. [DOI] [PubMed] [Google Scholar]
- 10.Pisano ED, Gatsonis CA, Hendrick RE, et al. American College of Radiology Imaging Network (ACRIN) Digital Mammographic Imaging Screening Trial (DMIST) Investigators Group. Diagnostic performance of digital versus film mammography for breast-cancer screening. N Engl J Med. 2005;353:1773–1783. doi: 10.1056/NEJMoa052911. [DOI] [PubMed] [Google Scholar]
- 11.Pisano ED, Hendrick RE, Yaffe MJ, et al. Diagnostic accuracy of digital versus film mammography: exploratory analysis of selected population subgroups in DMIST. Radiology. 2008;246:376–383. doi: 10.1148/radiol.2461070200. [DOI] [PMC free article] [PubMed] [Google Scholar]
- 12.Stanton L, Villafana T, Day JL, Lightfoot DA. Dosage evaluation in mammography. Radiology. 1984;150:577–584. doi: 10.1148/radiology.150.2.6691119. [DOI] [PubMed] [Google Scholar]
- 13.Wu X, Gingold EL, Barnes GT, Tucker DM. Normalized average glandular dose in molybdenum target–rhodium filter and rhodium target–rhodium filter mammography. Radiology. 1994;193:83–89. doi: 10.1148/radiology.193.1.8090926. [DOI] [PubMed] [Google Scholar]
- 14.Sobol WT, Wu X. Parameterization of mammography normalized average glandular dose tables. Med Phys. 1997;24:547–554. doi: 10.1118/1.597937. [DOI] [PubMed] [Google Scholar]
- 15.Geise RA, Palchevsky A. Composition of mammographic phantom materials. Radiology. 1996;198:347–350. doi: 10.1148/radiology.198.2.8596830. [DOI] [PubMed] [Google Scholar]
- 16.Hixson GL, Hendrick RE, Pisano ED, Yaffe MJ, Gatsonis CA. A limitation of ACRIN DMIST. Radiology. 2008;248:702–703. doi: 10.1148/radiol.2482080235. [DOI] [PubMed] [Google Scholar]


