

Abstract
Traditionally, neuronal studies of multisensory processing proceeded by first identifying neurons that were overtly multisensory (e.g., bimodal, trimodal) and then testing them. In contrast, the present study examined, without precondition, neurons in an extrastriate visual area of the cat for their responses to separate (visual, auditory) and combined-modality (visual and auditory) stimulation. As expected, traditional bimodal forms of multisensory neurons were identified. In addition, however, many neurons that were activated only by visual stimulation (i.e., unimodal) had that response modulated by the presence of an auditory stimulus. Some unimodal neurons showed multisensory responses that were statistically different from their visual response. Other unimodal neurons had subtle multisensory effects that were detectable only at the population level. Most surprisingly, these non-bimodal neurons generated more than twice the multisensory signal in the PLLS than did the bimodal neurons. These results expand the range of multisensory convergence patterns beyond that of the bimodal neuron. However, rather than characterize a separate class of multisensory neurons, unimodal multisensory neurons may actually represent an intermediary form of multisensory convergence that exists along the functional continuum between unisensory neurons, at one end, and fully bimodal neurons at the other.
Keywords: Multisensory convergence, Integration, Vision, Audition, Circuit
Introduction
What features identify a neuron (or an area) as multisensory? Multisensory is widely defined as a neuron (or neural area) whose activity is influenced by inputs from more than one sensory modality. Controversy, however, has occurred over the use and meaning of the term “influence,” of whether responses to stimulus combinations must be superadditive, or proportional, or statistically different from the responses to the same stimuli presented individually. Nevertheless, one measure that avoids all of these procedural disputes is the identification of a neuron (or area) that has overt, suprathreshold responses to stimuli from two or more sensory modalities. At the neuronal level, these effects describe bimodal (and trimodal) neurons, as depicted in Fig. 1, and this form of multisensory convergence has been examined for nearly 50 years now (Horn and Hill 1966). The apparent ubiquity of bimodal neurons (for review, see Stein and Meredith 1993) has led to their widespread acceptance as a model for multisensory processing and, as a consequence, the term ‘bimodal’ has unfortunately become synonymous with ‘multisensory.’
Fig. 1.
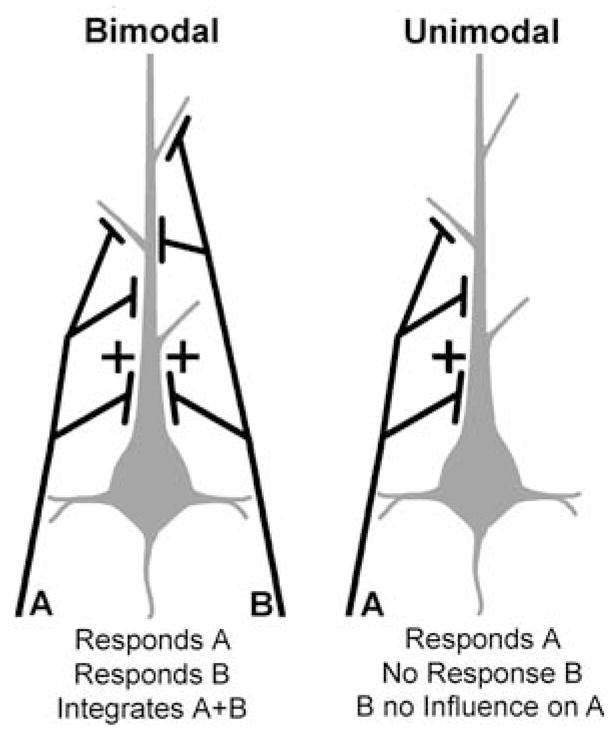
A hypothetical schematic of sensory inputs that produce bimodal and unimodal sensory responses. The bimodal neuron (grey) receives inputs (black) at differing locations and number (or weighting) from sensory modalities ‘A’ and ‘B’. These inputs produce suprathreshold activity in either modality when stimulated alone. In addition, when inputs from ‘A + B’ are combined, responses can be integrated to the extent that they are significantly different from responses to either of the inputs alone. In contrast, the unimodal neuron receives inputs from only one modality (‘A’), and is unaffected by the presence of stimuli in modality (‘B’) alone or in combination with (‘A’)
The multisensory definition, however, does not conceptually limit multisensory processing to bimodal neurons because ‘influence,’ and not ‘activation,’ is the operative criterion. However, the problem of measuring ‘influence’ in non-bimodal multisensory neurons becomes paramount. Non-bimodal multisensory neurons have been observed in different species (Newman and Hartline 1981; Barraclough et al. 2005; Sugihara et al. 2006; Bizley et al. 2007; Carriere et al. 2007) as well as in different visual (Allman and Meredith 2007; Allman et al. 2008a, b), somatosensory (Dehner et al. 2004; Clemo et al. 2007) and auditory (Meredith et al. 2006; Meredith and Allman 2009) cortices. As a group, these neurons are strongly activated by stimuli from one modality, are unresponsive to cues from other modalities, but show facilitated (or suppressed) responses when the different stimuli are combined. Since multisensory influences have been observed in these neurons only as a modulation of activity in the effective modality, these neurons have been designated as ‘subthreshold multisensory’ neurons (also called ‘modulatory’; Carriere et al. 2007; Driver and Noesselt 2008). Subthreshold multisensory effects occur in up to 66% of the neuronal population in their respective areas (Dehner et al. 2004), are subject to GABA-ergic control (Dehner et al. 2004; Allman et al. 2008a), and are sensory in nature (as opposed to non-specific, alerting or arousal phenomena; Allman et al. 2008b). It must be emphasized that the presence of subthreshold effects does not render the response distribution of the neuron bimodal, but merely diminishes or augments the response of a single modality (e.g., unimodal). Because such neurons fail to show a response to the ‘subthreshold’ modality when presented alone, superadditive/proportional criteria cannot verify these effects as multisensory (e.g., any miniscule response increase is superadditive). Instead, statistical treatments are required to assess the reliability of response changes between the separate- and combined-modality test conditions.
Connectional studies of multisensory neurons in cat extrastriate visual cortex have suggested that subthreshold multisensory neurons may result from the convergence of robust inputs from one modality with sparse afferents from another (Clemo et al. 2008). If this assumption is correct, then the connectional difference between bimodal and subthreshold multisensory neurons may simply reflect a reduction in priority or weighting of synaptic contacts from one modality. Similarly, connectional differences between unimodal neurons that demonstrate a significant response modulation (i.e., subthreshold multisensory) and those that do not (i.e., unisensory) may be represented in the latter as the complete reduction of inputs from the second modality, as depicted in Fig. 1. However, the physiological distinction between subthreshold and unisensory neurons is a statistical test that may not be sufficiently sensitive to reveal subtle intervening multisensory effects. Therefore, the primary aim of the present investigation, using the retinotopically organized posterolateral lateral suprasylvian (PLLS; Palmer et al. 1978) visual cortex, is to determine if there is evidence for multisensory processing in neurons that are identified as neither bimodal nor subthreshold. Observation of multisensory processing in such a neuronal population would not only expand our understanding of the range and effect of multisensory convergence, it would provide strong evidence that multisensory convergence actually extends along a continuum of connectivity patterns between multisensory and unisensory neurons.
Materials and Methods
All procedures were performed in compliance with the Guide for Care and Use of Laboratory Animals (NIH publication 86-23) and the National Research Council’s Guidelines for Care and Use of Mammals in Neuroscience and Behavioral Research (2003), and were approved by the Institutional Animal Care and Use Committee at Virginia Commonwealth University. These same procedures have been used successfully to study multisensory processing in other neural areas and animals (e.g., Meredith and Stein 1986, 1996; Wallace et al. 1992; Dehner et al. 2004; Meredith et al. 2006; Clemo et al. 2007; Allman et al. 2008a, b), in which the suppressive effects of surgical anesthesia were avoided through the implementation of a 2-step preparation.
Surgical Procedures
Cats (n = 3) were anesthetized with pentobarbital (40 mg/kg i.p.) and their heads secured in a stereotaxic frame. Using aseptic surgical conditions, a craniotomy was made over the PLLS cortex on the left hemisphere over which a recording well/head supporting device was implanted. The scalp was then sutured closed around the implant and standard postoperative care was provided. Approximately 7 days recovery elapsed before the recording phase of the procedure.
PLLS Recording
Recording sessions were initiated by anesthetizing the animal (35 mg/kg Ketamine; 2 mg/kg Acepromazine, i.m.) and attaching the implanted well to a supporting bar. To achieve ventilatory control, the animals were intubated through the mouth and sustained on a ventilator with expired carbon dioxide maintained at ~4.5%. Fluids, supplemental anesthetics (8 mg/kg/h Ketamine; 0.5 mg/kg/h Acepromazine, i.v.) and, to prevent spontaneous movements, a muscle relaxant (Pancuronium bromide 0.3 mg/kg initial dose; 0.2 mg/kg/h supplement, i.v.) were infused continuously. Heart rate was continuously monitored; a heating pad was used to maintain temperature, monitored rectally, at 37°C.
For recording, a tungsten microelectrode (glass insulated, tip exposure ~20 μm, impedance <1.0 MΩ) was inserted into the lateral bank of the suprasylvian sulcus and advanced from the pial surface and through fundus of the PLLS with a hydraulic microdrive. Neuronal activity was amplified, displayed on an oscilloscope and played on an audiomonitor. To avoid search bias, neurons were sought at 125 μm intervals (or 250 μm for some penetrations) and were identified by their spontaneous activity or by their responses to manually presented stimuli: auditory (clicks, whistles and hisses), somatosensory (taps and brushes with a fine paintbrush); visual (moving bars of light and dark stimuli across a translucent hemisphere positioned in front of the animal). This series of qualitative tests was systematically presented to each neuron to assess its suprathreshold sensory properties (i.e., visual only, auditory only, visual-auditory bimodal, etc.). These qualitative results were tabulated according to the recording depth to map the sensory/multisensory properties of the PLLS region.
Once a neuron was isolated and its suprathreshold sensory properties identified, a non-traditional multisensory testing paradigm was introduced. Until now, most multisensory studies first identified an individual multisensory neuron and then sought to correlate stimulation variables (e.g., intensity, temporal or spatial relationships) with the resulting levels of multisensory integration (e.g., Meredith et al. 1987; Meredith and Stein 1996). In this manner, each multisensory neuron was presented multiple and qualitatively different sensory tests. In contrast, the present investigation sought to determine for a population of neurons the levels of multisensory response generated by a single, standardized set of separate- and combined-modality stimuli. Thus, essentially the same sensory and multisensory tests were delivered to each neuron in each recording penetration for the entire study. These tests consisted of computer-triggered visual and auditory stimuli, presented alone and in combination (V, A and VA). Visual cues were light bars projected onto the translucent hemisphere (92 cm diameter), whose movement direction, velocity and amplitude across the visual receptive field was computer-controlled. The size, intensity, duration and velocity of movement were fixed for each of the neurons tested, but adjustments for preferences in movement direction were made to ensure a response was elicited. The auditory cues were electronically generated white noise bursts (50 ms duration, 55 dB SPL) delivered from a hoop-mounted speaker 44 cm from the head positioned in spatial register with the visual receptive field of the neuron being examined. When no visual receptive field was present, it was estimated from those predicted by the published visuotopic map of Palmer et al. (1978), or from visual neurons at an adjacent location in the penetration. Each stimulus presentation was separated by 7 s and each condition was presented 25 times in an interleaved fashion. During the combined stimuli presentation, the onset of the visual stimulus preceded that of the auditory stimulus by 40 ms, to compensate for the latency discrepancy between these modalities. Neuronal responses were digitized (rate >25 kHz) and individual waveforms were templated using Spike2 (Cambridge Electronic Design) and routed to a computer for storage and later analysis.
Data Analysis
Once the waveform for each recorded neuron was identified and templated, a peristimulus-time histogram was constructed for each neuron for each of the test conditions (V, A and VA) using Spike2 software. From the histogram, the response duration for the combined-modality (VA) condition was measured and the mean spikes per trial (and standard deviation, SD) were calculated for that same epoch for all three stimulus conditions. Crossmodal effects were statistically evaluated in two different ways. For activity generated by individual neurons, the mean spikes/trial evoked by the combined stimuli (VA) were compared (paired, two-tailed t-test; P <0.05) with that elicited by the most effective single-modality stimulus (V or A). For the population of neurons sampled, the average of the mean spikes/trial for each category (i.e., visual, auditory, bimodal) and test condition (V, A and VA) were determined and statistically compared using a paired two-tailed t-test (P <0.05).
Recording Site Reconstruction
For each recording penetration, the depth of each identified neuron was noted and tabulated with the results of the quantitative sensory tests. Two to three recording penetrations were obtained from each animal and, at the conclusion, successful recording penetrations were marked with an electrolytic lesion. At the end of the recording session, the animal was given a barbiturate overdose followed by perfusion with physiological saline and 10% formalin. The brain was blocked stereotaxically, removed and postfixed in 30% sucrose/formalin. Frozen sections (50 μm) were cut in the coronal plane through the recording sites and processed using standard histological procedures with a cresyl violet counterstain. Finally, a projecting microscope was used to trace sections on which the recording penetrations and locations of the examined neurons were reconstructed from the lesion sites.
Results
Only those penetrations that spanned the entire bank of the lateral sulcus (n = 8), from the surface through the fundus, were included. In addition, recordings were taken at every 125 μm (or 250 μm) interval along a penetration to avoid bias toward a particular layer or neuron type. At each recording site, the identified neurons were subjected to essentially the same, standardized set of electronically generated auditory, visual and combined auditory-visual tests. From a total of 520 neurons tested, 41 (8%) were excited by auditory, 233 (45%) by visual, 49 (9%) by both auditory and visual stimuli; 197 (38%) were unresponsive to sensory stimulation. Neurons responsive only to auditory cues were primarily encountered near the lip of the sulcus, presumably as part of the auditory dorsal zone (DZ), and were excluded from further analysis. Unimodal visual neurons occurred deep within the lateral bank and fundus of the sulcus, while bimodal, auditory-visual neurons tended to be located in the upper bank of the sulcus near the border between the visual PLLS and auditory DZ.
Bimodal Neurons
Bimodal neurons represented 17% (49/282) of the sensory neurons encountered in the PLLS. In terms of spike counts evoked by separate- and combined-modality stimulation, bimodal PLLS neurons, like that depicted in Fig. 2b, responded as would be expected from numerous other studies of this neuron type (e.g., Meredith and Stein 1986; Wallace et al. 1992). Bimodal PLLS neurons were activated by visual stimuli as well as auditory stimuli presented alone, and combined-modality stimulation generally elicited a response increase above either of the single-modality responses that often (39%; 19/49) reached statistical significance (i.e., met statistical criterion for multisensory response enhancement). For the population of bimodal neurons, the scatterplots shown in Fig. 3a and b confirm that combined-modality stimulation elicited an overall response increase in most of these neurons. Accordingly, the bar graph in Fig. 3c summarizes that the mean discharge rate for bimodal neurons was significantly increased when visual and auditory stimuli were combined.
Fig. 2.

Location of the PLLS and representative sensory/multisensory responses. In (a), the lateral view of the cat cerebral cortex shows the suprasylvian sulcus opened (grey) and the location of the PLLS (arrows). Some auditory cortical fields are also depicted. The vertical lines indicate the levels from which the lower, coronal sections are derived. On the coronal sections, the grey shaded area indicates the location of the PLLS; each dot represents the location of the neurons whose responses are depicted in parts (b) and (c). In (b), this bimodal PLLS neuron responded (raster = 25 trials; histogram = 10 ms time bins) to the presentation of a visual stimulus (ramp labeled ‘V’) as well as to an auditory stimulus (square wave labeled ‘A’). In the third panel, both visual and auditory stimuli are presented together (VA) and an even more vigorous response was recorded. The responses to the different stimulus conditions are summarized in the bar graph (far right; mean spikes/trial and standard deviation); dashed line = spontaneous activity level; ‘*’ statistical significant (P < 0.05, paired ‘t’-test. Part (c) illustrates the responses of a unimodal PLLS neuron. It was strongly activated by a visual stimulus, but an auditory stimulus had no effect either alone or in combination with the visual cue
Fig. 3.

Bimodal as well as unimodal PLLS neurons show multisensory effects. In (a) and (d), the graphs plot the visual response (V) versus the multisensory response change (visual response subtracted from combined visual-auditory response) for bimodal and unimodal PLLS neurons. For bimodal neurons (n = 49), combined (VA) responses were greater than the visual (V) responses in a large proportion of neurons, and multisensory responses tended to increase with increases in visual responsiveness, as shown in (a). These data are re-plotted in (b) to show that the proportion of response change (%) was overwhelmingly in the positive direction. The bar graph (c) shows that the average response of bimodal neurons was significantly (P < 0.05, paired ‘t’-test) increased from 7.0 ± 1.0 mean spikes/trial to 8.8 ± 1.3 mean spikes/trial when an auditory stimulus was also present. Surprisingly, these same trends were observed for the larger population of unimodal PLLS neurons (n = 233), which were activated robustly by visual stimulation but could not be activated by an auditory stimulus presented alone. In fact, the bar graph (f) indicates that the average response of unimodal neurons was significantly (P < 0.05, paired ‘t’-test) increased from 6.0 ± 0.4 mean spikes/trial to 6.9 ± 0.7 mean spikes/trial when visual was combined with auditory stimulation
Non-bimodal Neurons
In contrast to the bimodal neurons, the vast majority of sensory PLLS neurons (83%; 233/282) were strongly activated by visual stimuli but did not respond to any auditory cues (manual search cues as well as test stimuli) presented alone, as illustrated in Fig. 2c. Curiously, however, the population results depicted by the scatterplots in Fig. 3d and e showed that responses to combined visual-auditory stimuli were larger, and the mean discharge rate significantly greater (bar graph Fig. 3f), than were evoked by the visual stimulus alone.
Relative Contributions to Multisensory Signaling
The results summarized in Fig. 3 demonstrate that both bimodal and unimodal neurons contribute to multisensory processing in the PLLS. To assess their proportional contribution to the overall multisensory signal of the region, the difference in spike discharge evoked by the combined versus visual condition was calculated for each neuron (mean spikes/trial difference). These individual differences were summed for each neuron for both of the neuron categories, where the summed response difference in unimodal neurons was 195.5 spikes, and for bimodal neurons equaled 88.1 spikes. The proportional contribution was determined by dividing the group sum by the total (e.g., bimodal = 88.1/(88.1 ? 195.5)). These calculations reveal that bimodal neurons, which are traditionally regarded as the arbiters of multisensory processing, carried only 31% of the multisensory signal in the PLLS. Quite unexpectedly, the major generator of multisensory signals in this region were the unimodal neurons, which transmitted 69% of the multisensory-evoked spikes.
Unimodal Neurons and Subthreshold Multisensory Effects
Because examples of multisensory processing have been documented in unimodal neurons in the PLLS (Allman and Meredith 2007; Allman et al. 2008b) and other areas (e.g., Dehner et al. 2004; Meredith et al. 2006; Allman et al. 2008a; Meredith and Allman 2009), similar statistical treatments were applied to identify them in the present sample. A paired ‘t’-test was used to compare the responses of each unimodal neuron to visual and visual-auditory stimulation and a group of neurons was identified that showed a significant difference between the two responses. These neurons (n = 37/233), designated as subthreshold multisensory neurons (as in studies cited above), all showed significantly increased response discharges elicited by combined visual-auditory stimulation (see Fig. 4a, b). Furthermore, as a population, their mean discharge rates were quite vigorous and showed a significant multisensory increase, as summarized in the bar graph (Fig. 4c). In fact, the multisensory response increase of this group of subthreshold neurons was proportionally larger (42 ± 3%) than that observed for bimodal neurons (30 ± 5%).
Fig. 4.

Unimodal PLLS neurons show multisensory effects. The subset of unimodal neurons (37/233) that showed a statistically significant response modulation at the single neuron level during the combined visual-auditory condition (i.e., subthreshold multisensory neurons) all demonstrated an increased multisensory response change (a), with an average response change of 42 ± 3% (b). The bar graph (c) summarizes this effect, where the average response for the group of subthreshold multisensory neurons was significantly greater for the combined visual-auditory (VA; 11.4 ± 1.4 spikes/trial) condition than the visual (V) condition (8.7 ± 1.2, P < 0.05, paired ‘t’-test). The vast majority (81%, 159/196) of seemingly ‘unisensory’ neurons in the PLLS, despite failing to achieve the statistical criterion of multisensory processing at the neuronal level, demonstrated modest group response facilitation during the VA condition (hence, plotted above zero on the y-axis in d). For these unimodal neurons, the average response change was 11 ± 1% (e). Consequently, as seen in the bar graph (f), the population average mean spikes/trial for these neurons was significantly greater for the VA condition than the V condition (5.5 ± 0.4 vs. 6.0 ± 0.4, P < 0.05, paired ‘t’-test)
Once the neurons that showed significant subthreshold multisensory influences were subtracted from the overall population of unimodal neurons, it might be expected that the remaining visual neurons would be unaffected by auditory inputs. As such, plots of visual versus combined visual-auditory responses for each of the remaining unimodal neurons would be expected to resemble one another with minor increases or decreases occurring with similar frequency. However, as the scatter plots in Fig. 4d and e illustrate, a great many more unimodal neurons showed multisensory increases than equivalences or decreases and the mean spikes/trial was significantly increased when visual and auditory stimuli were combined (see bar graph 4f). Thus, due to the consistency of this modest effect, unimodal neurons whose response increase was too small to meet multisensory statistical criteria at the neuronal level still revealed a significant multisensory effect (11 ± 1% increase) at the population level.
Unimodal Multisensory Versus Unisensory Neurons
Although there is a clear difference between bimodal and subthreshold multisensory neurons, the distinction between subthreshold multisensory and truly unisensory neurons is currently difficult to discern. Some unimodal PLLS neurons showed virtually no change between visual and visual-auditory responses, and with the available data, are considered ‘unisensory.’ The apparent ‘gap’ between these unisensory neurons and the subthreshold multisensory neurons is filled by neurons that should be considered subthreshold multisensory as well. Two lines of evidence support this assertion. First, by increasing number of trials, the number of neurons identified as significantly affected by combined-modality stimulation progressively increases. When using the present data set, Table 1 demonstrates that as the number of trials used in the ‘t’-test was progressively increased from 5 to 25, the number of neurons showing a statistically significant response change also increased. Therefore, it is logical to assume that if a substantially larger number of trials had been presented, many more of the unimodal neurons would have demonstrated significant multisensory response changes at the single neuron level. At present, however, we cannot estimate what the optimal number of trials would be that would rigorously separate subthreshold multisensory from unisensory neurons. Second, pharmacological blockage of local inhibitory circuits is known to reveal subthreshold multisensory effects in unimodal visual neurons (Allman et al. 2008a), and the systematic application of this technique may also serve to differentiate those unimodal neurons which receive multisensory inputs from those which do not.
Table 1.
The relationship of number of sensory trials to responses showing statistically significant differences
| Number of trials | % Significant subthreshold neurons |
|---|---|
| 5 | 4 (n = 10/233) |
| 10 | 9 (n = 22/233) |
| 15 | 12 (n = 27/233) |
| 20 | 13 (n = 31/233) |
| 25 | 16 (n = 37/233) |
For the full population of unimodal neurons (n = 233), a series of paired ‘t’-tests were conducted that included a progressive increase in the number of trials (from 5 to 25). Note as the number of trials increased the proportion of neurons showing response changes that met the statistical criterion also increased
Discussion
The present single-unit study of multisensory processing in extrastriate visual cortex produced an unexpected finding: a large proportion of unimodal visual neurons had their visually evoked responses augmented by concurrent auditory stimulation. In addition to the visual neurons that demonstrated significant subthreshold multisensory integration (i.e., those neurons whose response increase reached statistical significance; 16% of visual neurons), an overwhelming number of unimodal neurons were facilitated by an auditory stimulus in a more subtle manner. Using a statistical comparison at the population level, we were able to identify these modest effects in assessing the multisensory capacity of the unimodal neurons within the PLLS. Ultimately, we found that the population of unimodal neurons showed a significant response facilitation generated by combined visual-auditory cues that amounted to nearly one additional spike discharge per stimulus presentation. Finally, and perhaps the most surprising, we found that the contribution to the multisensory signal generated in the PLLS region overwhelmingly originated from unimodal, not bimodal, neurons.
Nomenclature Considerations
In the field of multisensory processing there seems little consensus on the meaning of terms critical to defining the observed effects. Toward that end, we provide here the terms and their definitions (and reasoning for them) relevant to our present study. The term ‘multisensory’ is used to mean the influence of more than one sensory modality (e.g., vision, audition) on a neuron (or region). Neurons (or regions) that are activated by more than one sensory modality clearly have a bimodal functional distribution (exhibit responses to one modality and to another modality). Obviously, neurons (and regions) that are bimodal are also multisensory. In contrast, neurons that are activated by only one modality have a single, or unimodal, functional distribution. However, neurons that are activated by only one modality have the potential to be influenced by subthreshold inputs from other sensory modalities such that their single functional distribution can be modulated upward or downward by the subthreshold modality. Experimentally, subthreshold effects are not apparent when presented alone, but become evident when combined with stimulation in the effective modality. Unimodal neurons whose responses are modulated by subthreshold inputs from another modality are defined as subthreshold multisensory neurons (Dehner et al. 2004; Meredith et al. 2006; Allman and Meredith 2007; Allman et al. 2008a, b; Meredith and Allman 2009; also called ‘modulatory’ Carriere et al. 2007; Driver and Noesselt 2008). It should be noted that subthreshold neurons are not just bimodal neurons tested with an inadequate stimulus. Certainly there are circumstances (spatial, temporal, intensity, etc.) among bimodal neurons in which a 2nd modality seems ineffective (e.g., see Meredith and Stein 1996). However, for subthreshold neurons, we were unable to identify any parameterization of the 2nd modality that produced a suprathreshold response. Thus, some unimodal neurons can show multisensory properties. On the other hand, unimodal neurons may also be unaffected by another sensory modality at the neuronal and population levels and such neurons are regarded as ‘unisensory’ (see also Bizley et al. 2007).
Methodological Considerations
Until recently, the sole neuronal model of multisensory convergence has been the bimodal (or trimodal) neuron, and most electrophysiological investigations of multisensory neuronal processing first isolate a bimodal neuron and then examine its response properties. This procedure yielded a wealth of information about the sensory and multisensory responses of bimodal neurons (for review, see Stein and Meredith 1993). However, if the acceptance criterion for multisensory is incomplete, then only a partial estimate of the range of multisensory processing can be determined from this paradigm. On the other hand, it is widely recognized that bimodal neurons do not exist in isolation from other neuron types. Even the highly multisensory structure, the deep layers of the feline superior colliculus, contains only 55–60% multisensory neurons (Meredith and Stein 1986). It has been widely assumed that the non-multisensory neurons in a region must be unimodal (or, as recently adopted, ‘unisensory;’ Bizley et al. 2007). However, multisensory is defined as the influence of more than one modality and the appropriate test for this criterion is assessing responses of neurons not only to separate stimuli from different modalities, but also their combination. In this manner, neurons that appear to be excited by only one sensory modality might have those responses influenced (facilitated or suppressed) by the presence of a second, otherwise ineffective, modality. A handful of recent studies have employed this different search paradigm to identify multisensory neurons and they have revealed the presence not only of the traditional bimodal forms of multisensory neurons, but subthreshold forms as well (Dehner et al. 2004; Meredith et al. 2006; Allman and Meredith 2007; Allman et al. 2008a, b; Meredith and Allman 2009). In fact, using combined multisensory stimulation to identify multisensory neurons (both bimodal and subthreshold) these studies have determined that between 12% and 66% of neurons in a given area may be of the subthreshold multisensory variety. Consequently, the multisensory capacity of the cortex, including the PLLS, has been largely underestimated.
Multisensory Integration in the PLLS
We reported previously (Allman and Meredith 2007) that within the PLLS the bimodal neurons, located high in the bank of the sulcus, had visual receptive fields in the periphery, whereas the visual neurons, found deeper in the bank of the sulcus, had more centrally positioned receptive fields. Given that excitatory cross-modal interactions might contribute to better localization of dual-modality objects in space (Newman and Hartline 1981), PLLS neurons with receptive fields in the periphery (i.e., bimodal neurons) may benefit from greater excitatory convergence, evident in suprathreshold responses to auditory stimuli. Continuing that thought, PLLS neurons with more central receptive fields may not require the same extent of converging auditory inputs, and as such these lessened inputs are capable of facilitating the excitation during combined stimuli presentations but incapable of eliciting a response to an isolated auditory stimulus.
By extending the conventional criteria that define multisensory responses in individual neurons to populations of neurons, it became evident that the subtle crossmodal response changes in each unimodal neuron could combine into a substantial population effect, whereby the sampled population of unimodal neurons in the PLLS discharged with an average of one additional spike per trial (Fig. 3f). This finding, coupled with the suprathreshold effects of the bimodal neurons, provides support in favor of designating the PLLS as a multisensory area. Furthermore, because all of the neurons encountered were tested with essentially one stimulus set, we were able to assess the relative contributions from bimodal and unimodal neurons to the multisensory response of the region. Despite only subtle response facilitation in most unimodal neurons, the large number of these similarly responding neurons resulted in the majority (69%) of the multisensory processing in the PLLS being derived from cross-modal subthreshold effects in unimodal neurons rather than suprathreshold effects in bimodal neurons. Taken together, this comparative measure of subthreshold versus suprathreshold cross-modal effects, and the inability of separately presented auditory stimuli to elicit an excitatory response in the vast majority of visually responsive neurons (i.e., 83%; 233/282 were unimodal) suggest that the multisensory processing in the PLLS is mitigating effects at the modulatory end of the multisensory spectrum. Ultimately, the relatively greater contribution from unimodal versus bimodal neurons to the overall measure of multisensory integration in the PLLS highlights the need to extend the investigation of multisensory integration beyond the suprathreshold responses of bimodal neurons, and identifies the benefit of including population analyses in describing the multisensory capacities of a brain region.
Multisensory Convergence: A Continuum?
The present results provide important insights regarding the circuitry underlying multisensory processing in general. At present, only one form of convergent architecture is acknowledged: that of the bimodal-type multisensory neuron. The bimodal neuron is the most easily apparent and best studied type of multisensory neuron, in which afferents from different modalities independently excite the target neuron to suprathreshold levels. This fact alone implies connections that provide potent inputs from different modalities onto high-priority sites on the recipient neuron. For excitatory inputs, this may represent targeting of proximal dendrites or dense terminations on primary and secondary branches by afferents from two modalities. Furthermore, and perhaps as a result of the close spatial arrangement of these different inputs, the currents they evoke on shared patches of membrane can interact with one another to produce significantly enhanced levels of activity not achieved by either set of inputs alone. Given these assumptions, it seems plausible that such an architecture, summarized in Fig. 5, could underlie the sensory/integrative properties of bimodal neurons. In contrast, neurons which lack bimodal properties have largely been excluded from consideration as being capable of multisensory processing. However, numerous reports have now shown that some non-bimodal neurons can have their response influenced (facilitated or suppressed) by the presence of a stimulus from a second, otherwise ineffective modality (e.g., see: Dehner et al. 2004; Meredith et al. 2006; Allman and Meredith 2007; Allman et al. 2008a, b; Meredith and Allman 2009). Accordingly, subthreshold multisensory neurons are likely to receive strong excitatory inputs from one modality and, from a second modality, inputs that have lower priority and/or weighting, as illustrated in Fig. 5 (bottom). Further reduction in the priority/weighting of inputs from a second modality may underlie unimodal neurons that reveal multisensory properties only with techniques that adequately reduce statistical variance or by pharmacological treatment. Finally, reduction of inputs from a second modality to a value of zero priority/weighting underlies the connectional architecture of unisensory neurons. Therefore, as depicted in Fig. 5-bottom, it is apparent that the different multisensory circuits together constitute a connectional continuum from bimodal multisensory forms on one end, to a total lack of multisensory effects (e.g., unisensory) on the other. Thus, rather than represent a separate form of multisensory convergence, subthreshold multisensory neurons may actually represent intermediary forms of multisensory neurons that exist along a functional continuum to provide a range of activity within a given area in response to multisensory stimulation.
Fig. 5.

Hypothetical schematics of the patterns of sensory inputs that generate different forms of sensory/multisensory processing. The figures at the top represent the current model of multisensory processing. For a given neuron (grey colored body and dendrite), afferent axons and terminals (black) from one sensory modality (e.g., A) or another (B) provide excitatory drive via the priority (location) or weight (number) of their inputs. In the case of unimodal neurons (top right), inputs from modality ‘A’ generate suprathreshold responses to that modality while there is no effect of modality ‘B’ alone or in combination with ‘A.’ In contrast, for bimodal neurons (top-left), inputs from either modality ‘A’ and ‘B’ are sufficient to activate the neuron alone, and their combination produces an integration of the responses to ‘A’ and ‘B.’ A combined ‘A + B’ stimulus generates a integrated multisensory signal in bimodal neurons, but a distinct unisensory response from unimodal neurons. The results of the present investigation suggest that there is a range of convergence patterns that occur between the bimodal and unisensory extremes. By reducing the priority and/or weighting of inputs from modality ‘B,’ a neuron may loose its suprathreshold response to that modality while still being significantly affected by it when combined with inputs from modality ‘A.’ These forms of multisensory neurons have been termed ‘subthreshold’ (e.g., Dehner et al. 2004; Allman and Meredith 2007; Meredith and Allman 2009). In addition, further reduction of input priority/weighting of modality ‘B’ further reduces its effectiveness of influencing responses to modality ‘A,’ such that its effect can be seen at population levels or when local inhibitory circuits are pharmacologically blocked (Allman et al. 2008a). In this way, combination of modality ‘A + B’ produces a response within a mixed population of neurons whose levels of activity generate a smoothed, or continuous distribution between the two extremes. The pattern of multisensory convergence is not likely to be limited to these schematics; nor do these figures intend to represent any specific anatomical relationships
Supplementary Material
Acknowledgments
This work was supported by National Institutes of Health Grant NS-39460. BLA was supported by a Natural Sciences and Engineering Research Council of Canada postdoctoral fellowship.
Footnotes
This article is published as part of the Special Issue on Multisensory Integration.
References
- Allman BL, Meredith MA. Multisensory processing in ‘unimodal’ neurons: cross-modal subthreshold auditory effects in cat extrastriate visual cortex. J Neurophysiol. 2007;98:545–549. doi: 10.1152/jn.00173.2007. [DOI] [PubMed] [Google Scholar]
- Allman BL, Bittencourt-Navarrete RE, Keniston LP, Medina AE, Wang MY, Meredith MA. Do cross-modal projections always result in multisensory integration? Cereb Cortex. 2008a;18:2066–2076. doi: 10.1093/cercor/bhm230. [DOI] [PMC free article] [PubMed] [Google Scholar]
- Allman BL, Keniston LP, Meredith MA. Subthreshold auditory inputs to extrastriate visual neurons are responsive to parametric changes in stimulus quality: sensory-specific versus non-specific coding. Brain Res. 2008b;1242:95–101. doi: 10.1016/j.brainres.2008.03.086. [DOI] [PMC free article] [PubMed] [Google Scholar]
- Barraclough NE, Xiao D, Baker CI, Oram MW, Perrett DI. Integration of visual and auditory information by Superior Temporal Sulcus neurons responsive to the sight of actions. J Cognitive Neurosci. 2005;17:377–391. doi: 10.1162/0898929053279586. [DOI] [PubMed] [Google Scholar]
- Bizley JK, Nodal FR, Bajo VM, Nelken I, King AJ. Physiological and anatomical evidence for multisensory interactions in auditory cortex. Cereb Cortex. 2007;17:2172–2189. doi: 10.1093/cercor/bhl128. [DOI] [PMC free article] [PubMed] [Google Scholar]
- Carriere BN, Royal DW, Perrault TJ, Morrison SP, Vaughan JW, Stein BE, Wallace MT. Visual deprivation alters the development of cortical multisensory integration. J Neurophysiol. 2007;98:2858–2867. doi: 10.1152/jn.00587.2007. [DOI] [PubMed] [Google Scholar]
- Clemo HR, Allman BL, Donlan MA, Meredith MA. Sensory and multisensory representations within the cat rostral suprasylvian cortices. J Comp Neurol. 2007;503:110–127. doi: 10.1002/cne.21378. [DOI] [PubMed] [Google Scholar]
- Clemo HR, Sharma GK, Allman BL, Meredith MA. Auditory projections to extrastriate visual cortex: connectional basis for multisensory processing in ‘unimodal’ visual neurons. Exp Brain Res. 2008;191:37–47. doi: 10.1007/s00221-008-1493-7. [DOI] [PMC free article] [PubMed] [Google Scholar]
- Dehner LR, Keniston LP, Clemo HR, Meredith MA. Cross-modal circuitry between auditory and somatosensory areas of the cat anterior ectosylvian sulcal cortex: a ‘new’ inhibitory form of multisensory convergence. Cereb Cortex. 2004;14:387–403. doi: 10.1093/cercor/bhg135. [DOI] [PubMed] [Google Scholar]
- Driver J, Noesselt T. Multisensory interplay reveals crossmodal influences on ‘sensory-specific’ brain regions, neural responses, and judgments. Neuron. 2008;57:11–23. doi: 10.1016/j.neuron.2007.12.013. [DOI] [PMC free article] [PubMed] [Google Scholar]
- Horn G, Hill RM. Responsiveness to sensory stimulation of units in the superior colliculus and subjacent tectotegmental regions of the rabbit. Exp Neurol. 1966;14:199–223. doi: 10.1016/0014-4886(66)90007-0. [DOI] [PubMed] [Google Scholar]
- Meredith MA, Allman BL. Subthreshold multisensory processing in cat auditory cortex. NeuroReport. 2009;20:126–131. doi: 10.1097/WNR.0b013e32831d7bb6. [DOI] [PMC free article] [PubMed] [Google Scholar]
- Meredith MA, Stein BE. Visual, auditory, and somatosensory convergence on cells in the superior colliculus results in multisensory integration. J Neurophysiol. 1986;56:640–662. doi: 10.1152/jn.1986.56.3.640. [DOI] [PubMed] [Google Scholar]
- Meredith MA, Stein BE. Spatial determinants of multisensory integration in cat superior colliculus neurons. J Neurophysiol. 1996;75:1843–1857. doi: 10.1152/jn.1996.75.5.1843. [DOI] [PubMed] [Google Scholar]
- Meredith MA, Nemitz JW, Stein BE. Determinants of multisensory integration in superior colliculus neurons. I. Temporal factors. J Neurosci. 1987;7:3215–3229. doi: 10.1523/JNEUROSCI.07-10-03215.1987. [DOI] [PMC free article] [PubMed] [Google Scholar]
- Meredith MA, Keniston LR, Dehner LR, Clemo HR. Cross-modal projections from somatosensory area SIV to the auditory field of the anterior ecosylvian sulcus (FAES) in cat: further evidence for subthreshold forms of multisensory processing. Exp Brain Res. 2006;172:472–484. doi: 10.1007/s00221-006-0356-3. [DOI] [PubMed] [Google Scholar]
- Newman EA, Hartline PH. Integration of visual and infrared information in bimodal neurons of the rattlesnake optic tectum. Science. 1981;213:789–791. doi: 10.1126/science.7256281. [DOI] [PMC free article] [PubMed] [Google Scholar]
- Palmer LA, Rosenquist AC, Tusa RJ. The retinotopic organization of lateral suprasylvian visual areas in the cat. J Comp Neurol. 1978;177:237–256. doi: 10.1002/cne.901770205. [DOI] [PubMed] [Google Scholar]
- Stein BE, Meredith MA. Merging of the Senses. MIT Press; Cambridge, MA: 1993. [Google Scholar]
- Sugihara T, Diltz MD, Averbeck BB, Romanski LM. Integration of auditory and visual communication information in the primate ventrolateral prefrontal cortex. J Neurosci. 2006;26:11138–11147. doi: 10.1523/JNEUROSCI.3550-06.2006. [DOI] [PMC free article] [PubMed] [Google Scholar]
- Wallace MT, Meredith MA, Stein BE. Integration of multiple sensory modalities in cat cortex. Exp Brain Res. 1992;91:484–488. doi: 10.1007/BF00227844. [DOI] [PubMed] [Google Scholar]
Associated Data
This section collects any data citations, data availability statements, or supplementary materials included in this article.