Abstract
Brains from human neurofibromatosis type 1 (NF1) patients show increased expression of glial fibrillary acidic protein (GFAP), consistent with activation of astrocytes (M.L. Nordlund, T.A. Rizvi, C.I. Brannan, N. Ratner, Neurofibromin expression and astrogliosis in neurofibromatosis (type 1) brains, J. Neuropathol. Exp. Neurology 54 (1995) 588–600). We analyzed brains from transgenic mice in which the Nf1 gene was targeted by homologous recombination. We show here that, in all heterozygous mice analyzed, there are increased numbers of astrocytes expressing high levels of GFAP in medial regions of the periaqueductal gray and in the nucleus accumbens. More subtle, but significant, changes in the number of GFAP positive astrocytes were observed in the hippocampus in 60% of mutant mice analyzed. Astrocytes with elevated GFAP were present at 1 month, 2 months, 6 months and 12 months after birth. Most brain regions, including the cerebellum, basal ganglia, cerebral cortex, hypothalamus, thalamus, cortical amygdaloid area, and white matter tracts did not show any gliotic changes. No evidence of degenerating neurons was found using de Olmos’ cupric silver stain. We conclude that Nf1/nf1 mice provide a model to study astrogliosis associated with neurofibromatosis type 1.
Keywords: Neurofibromatosis, NF1, Astrocyte, Gliosis, Learning disability, Ras, Mouse, Neurofibromin
1. Introduction
Type 1 neurofibromatosis is one of the most common inherited human diseases. NF1 is inherited as an autosomal dominant trait [6,24,25,56], and affects about 1 in 3500 people worldwide. Common manifestations of NF1 include hyperpigmentation, bone abnormalities, and peripheral nerve sheath tumors (neurofibromas) (reviewed in Refs. [20,49]). NF1 patients are also at increased risk to develop malignant tumors including pheochromocytomas, childhood myelogenous leukemia, and malignant peripheral nerve sheath tumors. NF1 is characterized by extreme variability in disease severity, even among members of the same family (reviewed in Ref. [47]).
NF1 patients show changes associated with the central nervous system. For example, benign astrocytomas of the optic nerve are common in children with NF1 (reviewed in Ref. [36]). In addition, learning disabilities are a frequent and disabling problem in NF1 families. Between 30 and 45% of children who inherit one defective NF1 allele have learning disabilities (reviewed in Ref. [41]). School-aged children with NF1 can show organizational, visual spatial, memory, attentional and \ or fine motor problems [17,23,24]. Mean IQ scores of NF1 children are lower than the general population, but within one standard deviation of the mean [42].
Because of these CNS manifestations of NF1, it is important to define the cellular and molecular changes that exist in the brain as a consequence of NF1 mutation. Rosman and Pearce [50] described abnormal cortical lamination and heterotopic neurons in cortical gray and white matter as well as glial nodules that most closely resembled astrocytes in cerebral white matter in NF1 patients. A second abnormality is observed in a sub-population of children with NF1, who show foci of increased T2 signal on brain magnetic resonance imaging that are not enhanced by gadolinium, visible by CT, or associated with focal neurologic deficits. These have been called unidentified bright objects (UBOs) [12,38,46], and are found primarily in the cerebellum, subcortical white matter, brainstem, and basal ganglia [2,10,12,13,51]. UBOs disappear with increasing age. DiPaulo et al. [11] studied brains from three children with UBO’s at autopsy. They concluded that UBOs represent areas of demyelination or edema.
Another brain abnormality associated with NF1 is astrogliosis. Astrogliosis, or astrocyte activation, is a common response to brain injury, resulting in up-regulation of more than 100 proteins including cytokines, growth factors, adhesion molecules and transcription factors (reviewed in Refs. [13,47]). Astrogliosis is commonly marked by up-regulation of the intermediate filament protein GFAP, a 51 kd type III intermediate filament (reviewed in Refs. [15,16,35]). We described astrogliosis in three of three NF1 adult brains examined, using GFAP as a marker for astrocyte activation [39].
The NF1 gene product, neurofibromin, is expressed at high levels in the brain as compared to other tissues [7,19]. Neurofibromin is present in subpopulations of adult brain neurons [26,40]. Astrocytes in neither rodent nor human brain express detectable neurofibromin [7,39,40]. However, astrocytes up-regulate neurofibromin expression in vitro [22] and in vivo in response to cerebral ischemia [18].
The relevance of UBOs, astrogliosis, or abnormal cortical lamination to decreases in NF1 expression and learning problems in NF1 is not known; model systems in which to study these changes have not been described. Mice with targeted mutations at Nf1 were developed. Homozygous null embryos die at mid-gestation and are therefore unavailable for brain analysis [4,27]. Adult heterozygous Nf1 mice are predisposed to certain types of malignant tumors and show hyperplasia of some neuronal populations [4,27]. While Nf1/nf1 (heterozygous) mice do not mimic many features of human NF1, learning deficits have been defined in about 60% of the mutant mice suggesting the use of these mice to study brain abnormalities [53]. With additional training, Nf1 mice become comparable to wild-type controls, implying that Nf1 mutations affect rate of learning. It is not yet known whether Nf1/nf1 mice show the physical brain changes characteristic of human NF1, including UBO’s, abnormal cortical lamination, nor whether the brains of mutant mice are gliotic. We therefore analyzed GFAP expression as a measure of astrocyte function in the mice. Our data demonstrate that astrogliosis occurs in Nf1/nf1 mice, providing a model system in which to study one of the features of human NF1.
2. Materials and methods
2.1. Animals
Male C57Bl/6 mice were used in this study. Mice heterozygous for the Nf1 mutation [4] had been back-crossed onto C57Bl/6 for seven to nine generations at the time of these experiments. Mice were genotyped by PCR as described by Brannan et al. [4]. A total of 48 mice were fixed and analyzed for brain histology. Six wild type and six heterozygous mice were analyzed at each time point: 1 month, 2 months, 6 months and 1 year of age. An additional three wild type and three heterozygous mice were evaluated for neuronal degeneration using cupric silver staining at 1, 2, and 6 months of age. Five additional pairs of 1–2 month old animals were analyzed for GFAP levels using Western blotting.
2.2. Histology and immunocytochemistry
Mice were anaesthetized and then perfused transcardially with ice cold 0.9% saline followed by 4% paraformaldehyde (in 0.1 M Phosphate buffer—PB) for 10–15 min. Brains were removed, postfixed in the same fixative overnight and then cryoprotected in 20% sucrose overnight. Free floating frozen sections (35 μm) were cut on a freezing microtome. Every other section was mounted on a slide, dried, and processed for Nissl staining (cresyl violet). Every fourth section was processed for immunocytochemistry using anti-GFAP. Control experiments included omission of primary or secondary antibodies. Polyclonal antibody to GFAP (rabbit, Dako-Patts; Catalog #Z334) was used at a dilution of 1:20,000–1:100,000 for immunohistochemistry. Monoclonal anti-GFAP was from Sigma (Catalog #G-3893). Antibody incubations and detection using Vectastain ABC kits (Vector Labs) was performed according to Nordlund et al. [40].
2.3. Cell counts
Tissue sections stained with GFAP were examined under the microscope using bright field optics using a 20 × objective. GFAP positive cells were identified by brown DAB reaction product. Wild type and heterozygous animals were analyzed at each age. For each of the 48 animals evaluated, cells in a defined rectangle overlaying left and right hippocampi, and left and right PAG, were counted and the number of cells per area calculated (see Figs. 1 and 3). A mean cell number per area was calculated for each animal (left and right sides of individual animals differed by 3–5%). Statistical significance was determined using Student’s t-test.
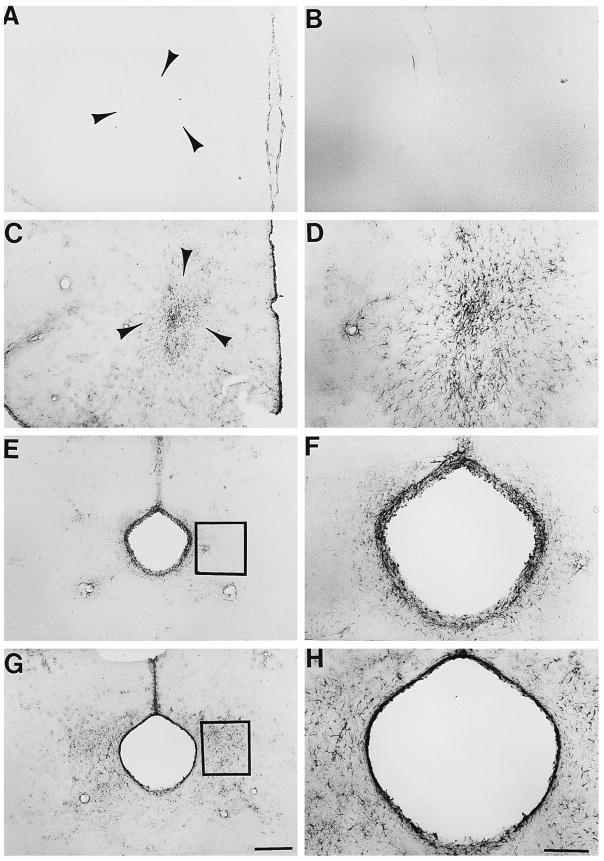
Fig. 1.
Nf1/nf1 mouse brain astrocytes show increased GFAP expression in nucleus accumbens and periaquductal grey. Sections through nucleus accumbens (A–D) or periaqueductal grey (E–H) were stained with anti-GFAP antibody, and labeling visualized as described in Section 2. Sections from wild type mice are shown in A, B, E, and F. Sections from Nf1/nf1 mice are shown in C, D, G, and H. Low magnification photographs are shown in the left panel (Bar = 100 μM); higher magnification views are on the right (Bar = 50 μm). Arrowheads in A and C circumscribe the area of the nucleus accumbens. Boxes in E and G designate areas analyzed for cell number and cell size.
Fig. 3.
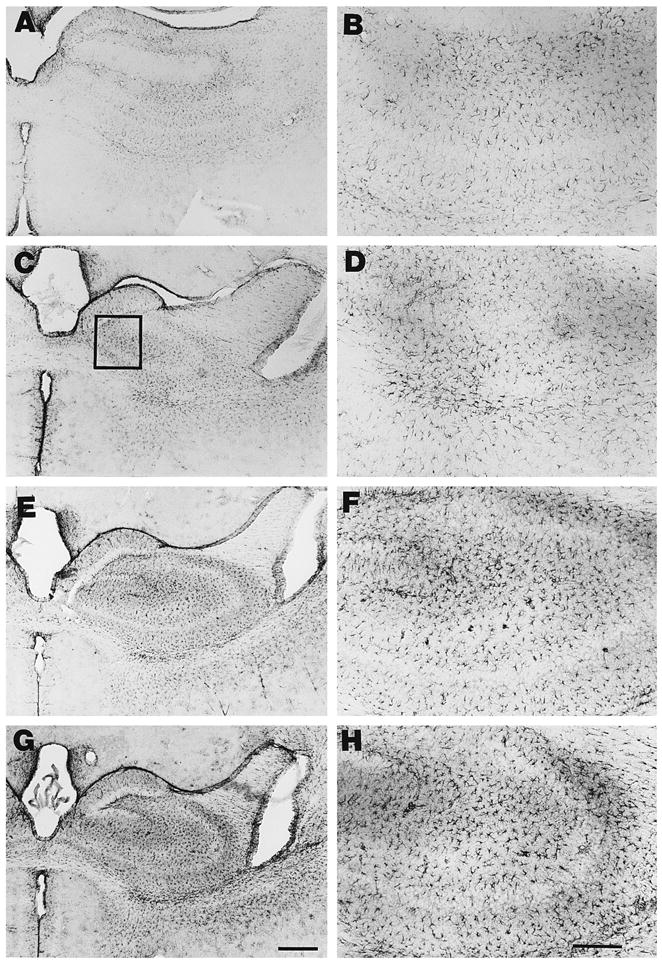
Nf1/nf1 mouse brain astrocytes show variable increases in GFAP expression in hippocampus. Sections through hippocampus were stained with anti-GFAP antibody, and labeling visualized as described in Section 2. Sections from wild type mice are shown in A and B. Sections from Nf1/nf1 mice are shown in C–H. Low magnification photographs are shown in the left panel (Bar = 100 μM); higher magnification views are on the right (Bar =50 μm). Box in panel C designates area representative of those analyzed for cell number and cell size.
2.4. Cell size measurements
Cell size (area) of 25 randomly chosen GFAP positive cells in sections through hippocampus from each of 4 heterozygous and 3 wild type animals (1 month old) were measured using a 40 × objective. Additional cells (25/animal) were measured in sections through the PAG from the same animals. Cell area was calculated using Metamorph.
2.5. Cupric silver degeneration staining
Mice were perfused with 4% paraformaldehyde in 0.067 M cacodylate, pH = 7.4. Brain blocks were postfixed in the same solution. The mouse brains were cryoprotected with 20% gycerol and 2% DMSO, embedded together in a gelatin matrix using MultiBrain Technology© and freeze cut at 30 μ on an AO-860 sliding microtome. Every sixth section was stained using the cupric silver degeneration reaction according to De Olmos et al. [9]. Neural elements undergoing disintegrative degeneration, if present, would be seen as black–brown profiles against a pale yellow background [55].
2.6. Western blot analysis
Tissue extracts of whole brain, hippocampus or cerebellum were prepared by homogenizing tissue in 8 M urea in 0.1 M Tris pH 8.0 (30 mg/100 ul buffer). Extracts were incubated on ice for 30 min and the protein content analyzed using the method of Markwell et al. [37]. Aliquots containing 0.3, 1, 3, and 10 μg of protein were diluted in Laemmli buffer and loaded onto 12% polyacrylamide gels. Electrophoresis and Western blot analysis was performed as previously described [8]. Polyclonal antibody to GFAP (rabbit, Dako-Catalog #Z334) was used at a dilution of 1:1000 for western analysis of tissue extracts. Parallel blots were stained with anti-tubulin (Amersham catalog #N357) at a dilution of 1:2500 as a loading control.
3. Results
3.1. Analysis of Nf1/nf1 brain sections for abnormalities in cortical lamination and for glial nodules
Rosman and Pearce [50] found that a subpopulation of NF1 patient brains showed abnormal cortical lamination, displaced neurons in the white matter, and, in one of twenty brains analyzed, glial cell nodules in white matter. Nf1/nf1 brain sections stained with cresyl violet were carefully analyzed to discern if these phenotypes were detectable. Three wild type and 3 mutants were analyzed at one month of age; 2 wild type and 2 mutants were analyzed at six months of age; 1 wild type and 1 mutant were analyzed at 12 months of age. No abnormal cortical lamination, displaced neurons in the white matter, or glial cell nodules in white matter were noted in any of the brains analyzed (not shown). No regions with altered cellularity were detected. Even brain regions with increased GFAP expression (see below) were not overtly different from normal controls when Nissl staining was used to analyze sections (not shown).
3.2. GFAP expression in wild type and Nf1/nf1 brains
Antibodies raised against glial fibrillary acidic protein (GFAP), a marker for astrocytes, were used to localize astrocytes in wild type control and heterozygous (Nf1/nf1) brain sections. Mouse monoclonal anti-GFAP at a dilution of 1:1000 or rabbit polyclonal anti GFAP at a dilution of 1:20,000 gave similar results on representative sections. We document results here using polyclonal anti-GFAP.
We analyzed 35 μM sections though whole brains to determine if differences in GFAP immunoreactivity were present in Nf1/nf1 mutant brains in comparison to wild type brains. We first studied brains from one-month-old mice. Differences in the intensity or number of GFAP positive cells were not evident when anti-GFAP was used at a dilution of 1:20,000 (not shown). To enhance possible differences between wild type and mutant brains, the concentration of the polyclonal anti-GFAP antibody was reduced to 1:100,000 [39,45]. At this dilution, the anti-GFAP antibody labeled few cells in control mouse brains. For example, few labeled astrocytes were detected in the nucleus accumbens in 1 month old wild type animals (n = 3) (Fig. 1A and B). In contrast, all brains of 1 month old heterozygous animals (n = 3) showed a large number of intensely labeled cells (Fig. 1C and D). Similarly, in the periaqueductal gray of the midbrain, few cells were labeled by anti-GFAP in wild type animals (n = 6) (Fig. 1E and F), while all analyzed Nf1/nf1 mouse brains (n = 6) showed numerous labeled cells in this area (Fig. 1G and H). Labeled astrocytes were localized mainly in the mediolateral region of the periaqueductal gray, not in the portions of the PAG dorsal or ventral to the aqueduct. These data suggest an increased amount of GFAP in astrocytes in the PAG and the nucleus accumbens in mutant mice.
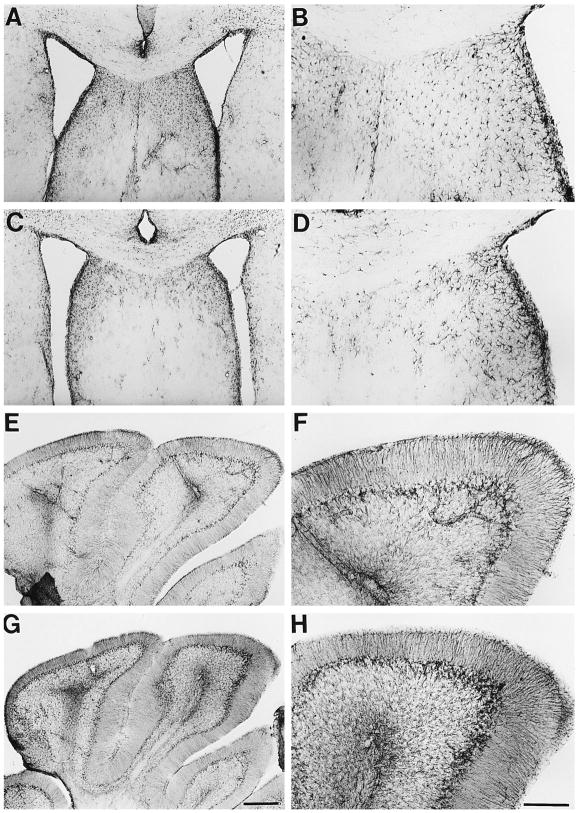
Most other brain regions did not show any differences in GFAP immunoreactivity between wild type brains and mutant brains. For example, thalamus (Fig. 2A–D) and cerebellum (Fig. 2E–H) of wild type and Nf1/nf1 showed similar levels of immunoreaction in all brains examined. Similarly, no differences between control and mutant brains were observed in the cortex, hypothalamus, amygdala, brain stem, basal ganglia, or white matter tracts (not shown).
Fig. 2.
Nf1/nf1 mouse brain astrocytes show normal GFAP expression in thalamus and cerebellum. Sections through thalamus (A–D) or cerebellum (E–H) were stained with anti-GFAP antibody, and labeling visualized as described in Section 2. Sections from wild type mice are shown in A, B, E, and F. Sections from Nf1/nf1 mice are shown in C, D, G, and H. Low magnification photographs are shown in the left panel (Bar = 100 μM); higher magnification views are on the right (Bar =50 μm).
The hippocampus showed a subtle increase in staining in some Nf1/nf1 brains (Fig. 3). For example, in one month old mice, GFAP staining was increased in sections through the hippocampus from 4/6 Nf1/nf1 brains (Fig. 3E–H) evaluated as compared to 6 control brains (Fig. 3A–B). GFAP staining in Nf1/nf1 hippocampus in the remaining 2/6 brains (Fig. 3C–D) was not noticeably different from that of control brains. In sections of PAG and nucleus accumbens from these same mice, striking increases in GFAP staining were observed in heterozygous mice, indicating that differences among animals were specific to the hippocampus. Over-staining of sections by longer incubation in diaminobenzidine substrate failed to reveal additional staining of astrocytes in the regions of hippocampus, nucleus accumbens or periaqueductal gray in control or mutant brains.
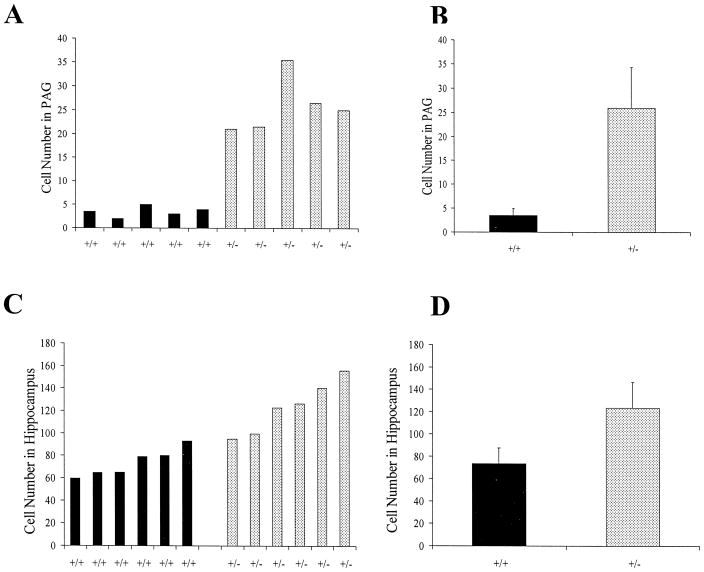
To quantitate numbers of GFAP positive cells in the hippocampus and PAG of mutant mice, GFAP labeled cells/field were counted. Sections were analyzed for each animal, counting cell numbers in fields from the right and left side of hippocampus and PAG. Fig. 4 shows the mean number of GFAP-positive cells labeled in sections from PAG of normal and mutant animals at one month of age (n =5 each genotype). In the PAG, a mean six-fold increase in GFAP-positive cells was counted (p <0.001; paired t-test) (Fig. 4B). Fig. 4C and D show the mean number of astrocytes/area labeled by anti-GFAP in mouse hippocampal sections from 1 month old animals (n =6 each genotype). The number of astrocytes in 2/6 heterozygous mice was similar to that of wild type controls; 4/6 heterozygous mice showed slightly increased numbers of GFAP-positive astrocytes (Fig. 4C). Averaging over all animals (Fig. 4D, a small (2-fold) but statistically significant (p < 0.0001) increase in GFAP-positive astrocytes was evident.
Fig. 4.
Increased numbers of GFAP-positive astrocytes in PAG and hippocampus in Nf1/nf1 mice. GFAP-positive astrocytes were counted in sections. Counts from individual animals (2 sections/animal) are shown in A and C; pooled data is shown in B and D. Error bars indicate standard deviation; difference between wild type and mutant mice was significant for both regions.
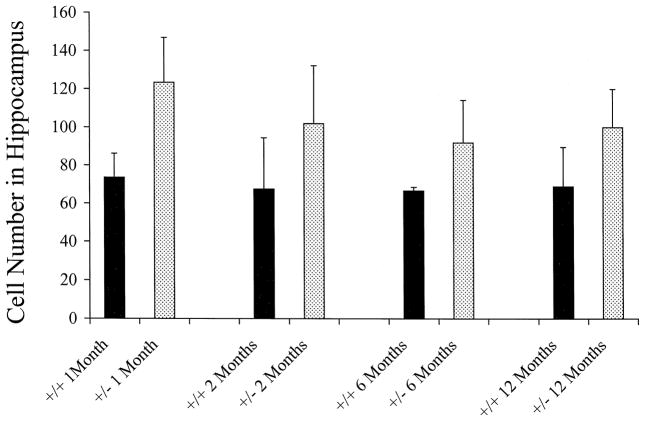
The finding that increased GFAP expression was common in some regions of Nf1/nf1 mouse brains enabled us to test if the extent of the abnormality, or the percentage of affected animals, might change with developmental age. Variability in the extent of the GFAP expression within the hippocampus was noted at all ages analyzed. At 1 month, 4 of 6 animals showed increased GFAP expression (as above); at 2 months, 3 of 6 animals showed increased GFAP expression, at 6 months and at 1 year, 2 of 6 animals showed increased GFAP expression. In contrast, all animals showed increased GFAP expression in the PAG and nucleus accumbens at all ages analyzed (not shown). Anti-GFAP labeled astrocytes were counted in hippocampus from mice at 1 month, 2 months, 6 months and 1 year (n =6 each age group and each genotype). Cells from one field per section was counted from each side of the hippocampus and the mean number of cells/field from control and Nf1/nf1 brains from each age group are graphically represented in Fig. 5. A paired Student’s t-test was performed on these data; an increase in the number of GFAP cells in Nf1/nf1 brain was significant, with p <0.006 for 1 month, P <0.002 for 2 month, P <0.034 for 6 months and P <0.035 for the 1 year age group.
Fig. 5.
Increased numbers of GFAP-positive astrocytes in hippocampus in Nf1/nf1 mice at different ages. GFAP-positive astrocytes were counted in sections through the hippocampus of 1 month, 2 month, 6 month and 1 year old animals. Counts from individual animals (2 sections/animal) were pooled for each age group (n =6 animals each age and each genotype). Error bars represent standard deviation. Statistical significance was observed for all ages (see text).
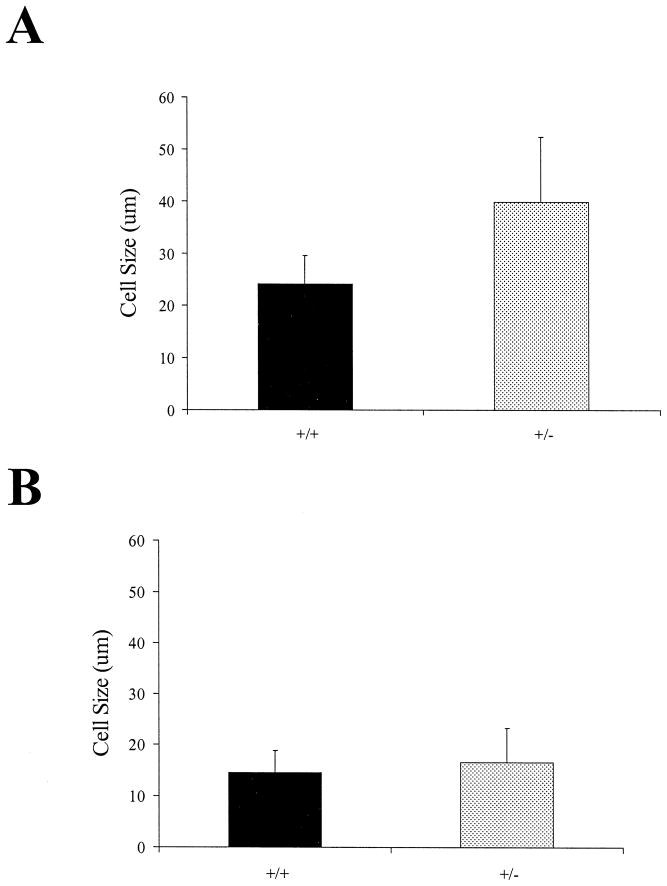
Increased levels of GFAP in mutant astrocytes suggested that some astrocytes might be increased in size. To determine if GFAP labeled astrocytes show hypertrophy in Nf1/nf1 brains, the mean area of anti-GFAP-positive cells was measured in sections of hippocampus from 1 month old wild type and heterozygous mice in the hippocampus and in the PAG. Fig. 6 shows the results. An increase in cell size was evident in astrocytes of the PAG; the increase was significant, with p =0.036 in an unpaired Student’s t-test. In the hippocampus, little if any increase was noted (not significant). It is likely that the larger number of normal astrocytes expressing GFAP in the hippocampus obscures any size difference in this area.
Fig. 6.
Increased size of anti-GFAP labeled astrocytes in periaqueductal gray but not hippocampus in Nf1/nf1 mice. The perimeter of 25 astrocytes was measured in sections of periaqueductal gray (A) or hippocampus (B), in regions similar to those shown in boxes in Fig. 1 and Fig. 3. The difference between the size of astrocytes from wild type (+/+) and Nf1 heterozygous (+/−) animals was significant (P < 0.036) only for cells from PAG.
3.3. Neuronal degeneration analysis in Nf1/nf1 brains
Increased GFAP is often correlated with neuronal degeneration [43]. To evaluate whether neuronal degeneration is present in Nf1/nf1 brains, cupric silver staining was carried out on sections of a total of 9 mutant animals (3 each at 1, 2, and 6 months of age). A similar number of) wild type animals were evaluated. No degenerative debris was observed in any of the animals in any brain region (data not shown).
3.4. Quantitation of GFAP levels in wild type and Nf1/nf1 brains
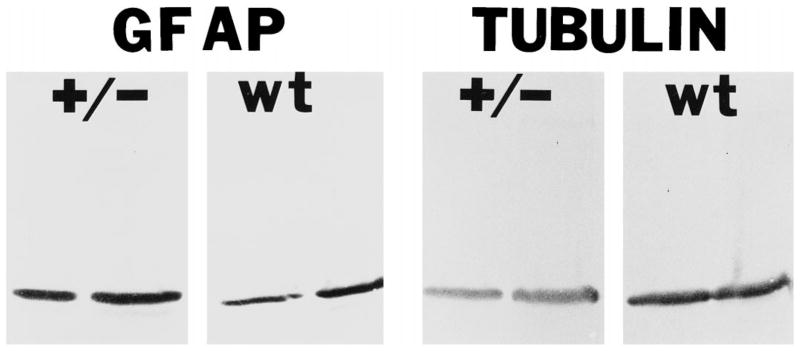
GFAP levels in control and Nf1/nf1 brains were measured in tissue extracts under conditions that dissociate cytoskeletal proteins. Control (n =3) and Nf1/nf1 (n =3) whole brains were homogenized, and varying amounts of protein were loaded onto gels. GFAP and β-tubulin were visualized using Western analysis. Blots stained by anti-GFAP or anti-tubulin and the density of bands was compared in control and Nf1/nf1 extracts (Fig. 7). All three Nf1/nf1 brains contained higher concentration of GFAP than wild type controls. Hippocampal extracts from mutant brains (n =2) also contained slightly higher GFAP than wild type controls (n =2; cerebellar extracts did not show) differences between genotypes (not shown).
Fig. 7.
GFAP protein is increased in Nf1/nf1 brain lysates. GFAP and tubulin levels were quantified with Western blot analysis. 3 μg (left lane in each set) and 10 μg (right lane in each set) of cytoskeletal extracts from Nf1/nf1 brains (+/−) or wild type (wt) brains were transferred to nitrocellulose and probed with antibodies recognizing GFAP (left four lanes) or tubulin (right four lanes). Nf1/nf1 brains have approximately two-fold increased levels of GFAP proteins.
4. Discussion
This report demonstrates that Nf1/nf1 mouse brains contain discrete regions of increased GFAP. In contrast, no changes in cortical lamination or brain organization were detected in Nf1/nf1 mutant mouse brains. The current study indicates that mutation at the Nf1 locus results in astrocyte activation; a previous study using human brains, from patients who died of malignant disease, left open the possibility that gliosis in NF1 was a non-specific change associated with tumor burden, or other cause [39].
Analysis of cresyl violet stained sections failed to reveal the subtle changes in neuronal placement, believed to reflect abnormal neuronal migration, that were reported in human NF1 brains [50]. However, the mouse model suffers several limitations. For example, the small size of mouse white matter tracts makes it difficult to detect stray neurons in subcortical white matter. In addition, the layering of cortex is significantly less obvious in mice than in primates, with a much higher neuronal packing density in mouse cortex, making it difficult to detect changes in layering. Thus the criteria used to distinguish normal from dysmorphic human brains cannot be easily applied to mice. Within these constraints, our analysis rules out gross abnormalities in neuronal migration or placement in Nf1/nf1 mice.
Nf1/nf1 mouse brain sections showed increases in astrocyte size and in number of GFAP-positive cells in affected regions. Astrogliosis is characterized by hypertrophy of astrocyte cytoplasmic processes and increase in GFAP intermediate filaments (reviewed in Refs. [15,16]). Our Western blot analysis confirmed an increase in GFAP content in the Nf1/nf1 mutant brains. The changes in GFAP level observed in mutant mice are much smaller than those evident in human NF1 brains. In our previous study using human NF1 brains, and in this study, we found increases in GFAP-expressing astrocyte cell number and in astrocyte size, as well as in GFAP content [39]. Whether the overall number of brain astrocytes in Nf1/nf1 mutants is increased as compared to controls remains to be determined; Nissl analysis of mutant brain sections failed to suggest obvious differences in astrocyte number. Because numerous changes in gene expression accompany astrogliosis (reviewed in Refs. [14,48]), it will be of interest to study changes in expression of other astrocyte proteins in Nf1 mutant mice.
NF1 is usually classified as a tumor suppressor gene; mutations in both NF1 alleles are detectable in tumors associated with NF1 [34,52,57]. Whether mutations in both NF1 alleles are required for gliosis is not known. Peripheral nerve glia (Schwann cells) heterozygous for Nf1 mutations show phenotypes intermediate between wild type and null cells [29,30]. Thus complete absence of neurofibromin is not always required for cell abnormalities to ensue. Indeed, Crowe et al. [6] suggested that primary deficiency (mutation at the NF1 locus), rather than secondary involvement (additional genetic changes), of the nervous system was responsible for the low IQ associated with NF1 patients.
Sixty percent of mice analyzed in this study showed detectable gliosis in the hippocampus. The hippocampus is of special interest in Nf1/nf1 brains, because behavioral assessment of Nf1 mice showed failure to perform well in the spatial version of the water maze (hidden platform) test [53]. The abnormality in the Nf1/nf1 brains was ascribed to hippocampal dysfunction. Strikingly, just as we showed that gliosis was present in some but not all hippocampi from Nf1/nf1 mutants, only 60–70% of mice analyzed showed learning problems [53]. It remains to be determined if mice with learning problems are the same ones that show gliosis. As mice used in this study were back-crossed 7–9 generations from the 129 strain onto the C57Bl/6 background, modifier effects are unlikely to explain differences between individual mice. An alternative explanation is that levels of factors (e.g., cytokines) differ between mice, and that only mice with higher levels of cytokines show gliosis. We favor this explanation because gliotic changes were detected in the PAG and nucleus accumbens of 100% of mice, while hippocampal changes were present only in some.
Astrogliosis was dramatic in medial regions of the periaqueductal gray and in the nucleus accumbens, while many other brain areas showed no gliotic changes. Astrocytes in specific brain regions differ (e.g., Ref. [3]); astrocyte differences could account for the sensitivity of these regions to effects of loss of NF1. In contrast to our results in Nf1/nf1 mice, human brains analyzed showed widespread astrogliosis [39]. The brain regions that show astrogliosis in this study also do not correlate with the distribution of UBOs in humans; UBOs are most frequent in the cerebellum, basal ganglia, brainstem, and subcortical white matter [2,10,12,13,51]. The lateral region of the periaqueductal gray is mainly known for relevance to pain perception and in autonomic cardiac regulation, the nucleus accumbens functions in pleasure circuitry in the limbic system, while the hippocampus is associated with learning and memory. Thus the three brain regions associated with a gliotic response in Nf1 mutant mice are not associated in any obvious way with a specific sensory or motor system, or connected by brain circuitry.
Astrocytes in the hippocampus, PAG, and nucleus accumbens were gliotic from as early as one month of age. Gliosis was maintained in adulthood. Neither the number of animals with gliosis nor the severity of the gliotic phenotype increased with age. It is therefore likely that the gliotic phenotype reflects a long-lasting difference between normal and mutant astrocytes in specific brain regions, rather than a transient response to acute events. Altered response to environmental factors might result from changes in intracellular signaling pathways in mutant astrocytes. Neurofibromin is a regulator of intracellular Ras (reviewed in Ref. [31])and perhaps cAMP pathways [21]. Silva et al. [53] proposed that cognitive defects in Nf1/nf1 mice may be due to neurofibromin GAP activity. Mutations in an exchange factor for a non-Ras small G-protein cause a form of human mental retardation [1]. Altered small G-protein activity may be a key regulator of normal brain function that underlies the pathology we have defined.
Astrocyte activation is a marker for neuronal degeneration (see Refs. [44,54,55]). GFAP levels increase in response to CNS injuries such as toxins, stab wounds, pharmaceutical insults, transplantation and disease (see Latov et al. [33]; reviewed in Ref. [15]). Brains from patients with neurodegenerative diseases such as Alzheimer’s, Down syndrome, and amyotrophic lateral sclerosis show increased GFAP levels, particularly in regions of extensive neuronal degeneration [5,28,32]. We failed to find any evidence of neuronal degeneration in Nf1/nf1 brains. Similarly, human NF1 brains did not show consistent evidence of neuronal degeneration [39]. Therefore, the gliosis we have defined in Nf1/nf1 mice may result from astrocyte or neuronal abnormalities but in either case is likely to reflect subtle biochemical changes in cells, rather than cell degeneration. Additional study will determine whether astrocytes manifest cell-autonomous changes leading to increase in GFAP expression and/or if neuronal abnormalities induce changes in astrocytes, indirectly resulting in astrogliosis.
Acknowledgments
This work was supported by NIH NS28840 (to NR).
References
- 1.D’Adamo P, Menegon A, Lo Nigro C, Grasso M, Gulisano M, Tamanini F, Bienvenu T, Gedeon AK, Oostra B, Wu SK, Tandon A, Valtorta F, Balch WE, Chelly J, Toniolo D. Mutations in GDI1 are responsible for X-linked non-specific mental retardation. Nature Genet. 1998;19(2):134–139. doi: 10.1038/487. [DOI] [PubMed] [Google Scholar]
- 2.Aoki S, Barkovich AJ, Nishimura K. Neurofibromatosis types 1 and 2: cranial MR findings. Radiology. 1989;172:527–534. doi: 10.1148/radiology.172.2.2501822. [DOI] [PubMed] [Google Scholar]
- 3.Black JE, Sontheimer, Waxman SG. Spinal cord astrocytes in vitro: phenotypic diversity and sodium channel immunoreactivity. Glia. 1993;7:272–285. doi: 10.1002/glia.440070403. [DOI] [PubMed] [Google Scholar]
- 4.Brannan CI, Perkins AS, Vogel KS, Ratner N, Nordlund ML, Reid SW, Buchberg AM, Jenkins NA, Parada LF, Copeland NG. Targeted disruption of the neurofibromatosis type-1 gene leads to developmental abnormalities in heart and various neural crest-derived tissues. Genes and Development. 1994;8:1019–1029. doi: 10.1101/gad.8.9.1019. [DOI] [PubMed] [Google Scholar]
- 5.Casanova MF, Stevens JR, Kleinman JE. Astrocytosis in the molecular layer of the dentate gyrus: a study in Alzheimer’s disease and schizophrenia. Psychiatric Res. 1990;35:149–166. doi: 10.1016/0925-4927(90)90017-z. [DOI] [PubMed] [Google Scholar]
- 6.Crowe CA, Schull WJ, Neel JV. A clinical, pathological and genetic study of multiple neurofibromatosis. Springfield, IL: Charles C. Thomas; 1956. pp. 1–181. [Google Scholar]
- 7.Daston MM, Scrable H, Nordlund M, Sturbaum AK, Nissen LM, Ratner N. The protein product of the neurofibromatosis type 1 gene is expressed at highest abundance in neurons, Schwann cells, and oligodendrocytes. Neuron. 1992;8:415–428. doi: 10.1016/0896-6273(92)90270-n. [DOI] [PubMed] [Google Scholar]
- 8.Daston M, Ratner N. Neurofibromin, a predominantly neuronal GTPase activating protein in the adult, is ubiquitously expressed during development. Dev Dynamics. 1992;195:216–226. doi: 10.1002/aja.1001950307. [DOI] [PubMed] [Google Scholar]
- 9.De Olmos JS, Ebbesson SOE, Heimer L. Silver methods for the impregnation of degenerating axoplasm. In: Heimer L, Robards MJ, editors. Neuroanatomical Tract-tracing Methods. Plenum Press; New York: 1981. pp. 117–170. [Google Scholar]
- 10.DiMario FJ, Ramsby G, Greenstein R, Langshur S, Dunham B. Neurofibromatosis type 1: magnetic resonance imaging findings. Child Neurol. 1993;8:32–39. doi: 10.1177/088307389300800105. [DOI] [PubMed] [Google Scholar]
- 11.DiPaolo DP, Zimmerman RA, Rorke LB, Zackai EH, Bilanuk LT, Yachnis AT. Neurofibromatosis type 1: pathologic substrate of high signal intensity foci in the brain. Neuroradiology. 1995;195:721–724. doi: 10.1148/radiology.195.3.7754001. [DOI] [PubMed] [Google Scholar]
- 12.Duffner PK, Cohen ME, Seidel FG, Shucard DW. The significance of MRI abnormalities in children with neurofibromatosis. Neurology. 1989;39:373–378. doi: 10.1212/wnl.39.3.373. [DOI] [PubMed] [Google Scholar]
- 13.Dunn DW, Roos KL. Evaluation of learning difficulties and incoordination in neurofibromatosis type 1. Neurofibromatosis. 1989;2:1–5. [PubMed] [Google Scholar]
- 14.Eddleston M, Mucke L. Molecular profile of reactive astrocytes implication for their role in neurologic disease. Neuroscience. 1993;54:15–36. doi: 10.1016/0306-4522(93)90380-X. [DOI] [PMC free article] [PubMed] [Google Scholar]
- 15.Eng LF, Lee YL. In: Intermediate filaments in astrocytes. Kettenman H, Ransom BR, editors. Neuroglia: Oxford University Press; 1995. pp. 650–667. [Google Scholar]
- 16.Eng LF. Regulation of glial intermediate filaments in astrogliosis. In: Norenberg MD, Hertz L, Schousboe A, editors. Biochemical Pathology of Astrocytes. Liss; New York: 1988. pp. 79–90. [Google Scholar]
- 17.Ferner RE, Hughes RAC, Wenman J. Intellectual impairment in NF1. J Neurol Sci. 1996;138:125–133. doi: 10.1016/0022-510x(96)00022-6. [DOI] [PubMed] [Google Scholar]
- 18.Giordano MJ, Mahadeo DK, He YY, Geist RT, Hsu C, Gutman DH. Increased expression of the neurofibromatosis 1 (NF1) gene product, neurofibromin, in astrocytes in response to cerebral ischemia. J Neurosci Res. 1996;43(2):246–253. doi: 10.1002/(SICI)1097-4547(19960115)43:2<246::AID-JNR12>3.0.CO;2-4. [DOI] [PubMed] [Google Scholar]
- 19.Golubic M, Roudebush M, Dobrowolski S, Wolfman A, Stacey DW. Catalytic properties, tissue distribution and intracellular distribution of neurofibromin. Oncogene. 1992;7:2151–2159. [PubMed] [Google Scholar]
- 20.Guo HF, The I, Hannan F, Bernards A, Zhong Y. Requirement of Drosophila NF1 for activation of adenlyl cyclase by PACAP38-like neuropeptides. Science. 1997;276:795–798. doi: 10.1126/science.276.5313.795. [DOI] [PubMed] [Google Scholar]
- 21.Gutmann D, Aylsworth A, Varey J, Korf B, Marks J, Pyeritz R, Rubenstein A, Viskochil D. The diagnostic evaluation and multi-disciplinary management of neurofibromatosis 1 and neurofibromatosis 2. J Am Med Assoc. 1997;278:51–57. [PubMed] [Google Scholar]
- 22.Hewett SJ, Choi DW, Gutmann DH. Expression of the neurofibromatosis 1 (NF1) gene in reactive astrocytes in vitro. NeuroReport. 1995;6(11):1565–1568. doi: 10.1097/00001756-199507310-00025. [DOI] [PubMed] [Google Scholar]
- 23.Hofman KJ, Harris EL, Bryan N, Denckla MB. Neurofibromatosis type 1: the cognitive phenotype. J Pediatrics. 1994;124:S1–S8. doi: 10.1016/s0022-3476(05)83163-4. [DOI] [PubMed] [Google Scholar]
- 24.Huson SM, Compston DAS, Clark P, Harper PS. A genetic study of von Recklinghausen neurofibromatosis in South East Wales: I. Prevalence, fitness, mutation, rate and effect of parental transmission on severity. J Med Genetics. 1989;26:704–711. doi: 10.1136/jmg.26.11.704. [DOI] [PMC free article] [PubMed] [Google Scholar]
- 25.Huson SM, Harper PS, Compston DAS. Von Recklinghausen neurofibromatosis. A clinical and population study in South-East Wales. Brain. 1988;111:1355–1381. doi: 10.1093/brain/111.6.1355. [DOI] [PubMed] [Google Scholar]
- 26.Huynh DP, Lin CT, Pulst SM. Expression of neurofibromin, the neurofibromatosis 1 gene product: studies in human neuroblastoma cells and rat brain. Neurosci Lett. 1992;143:233–236. doi: 10.1016/0304-3940(92)90272-9. [DOI] [PubMed] [Google Scholar]
- 27.Jacks T, Shih TS, Schmitt EM, Bronson RT, Bernards A, Weinberg RA. Tumour predisposition in mice heterozygous for a targeted mutation in Nf1. Nature Genet. 1994;7:353–361. doi: 10.1038/ng0794-353. [DOI] [PubMed] [Google Scholar]
- 28.Jorgensen OS, Brooksbank BWL, Balazs R. Neuronal plasticity and astrocytic reaction in Down Syndrome and Alzheimer disease. J Neurol Sci. 1990;98:63–79. doi: 10.1016/0022-510x(90)90182-m. [DOI] [PubMed] [Google Scholar]
- 29.Kim H, Ling B, Ratner N. NF1 deficient mouse Schwann cells are angiogenic, invasive and can be induced to hyperproliferate: reversion of some phenotypes by an inhibitor farnesyl protein transferase. Mol Cell Biol. 1997;17:862–872. doi: 10.1128/mcb.17.2.862. [DOI] [PMC free article] [PubMed] [Google Scholar]
- 30.Kim H, Rosenbaum T, Marchioni M, Ratner N, DeClue J. Schwann cells from Neurofibromin-deficient mice exhibit activation of p21ras, inhibition of cell proliferation and morphologic changes. Oncogene. 1995;11:325–335. [PubMed] [Google Scholar]
- 31.Kim MR, Tamanoi F. Neurofibromatosis 1 GTPase activating protein-related domain and its functional significance. In: Upadhyaya M, Cooper DN, editors. Neurofibromatosis Type 1: From Genotype to Phenotype. BIOS Scientific Publishers; Oxford: 1998. pp. 89–112. [Google Scholar]
- 32.Kushner PD, Stephanson BA, Wright S. Reactive gliosis in the subcortical white matter of amyotrophic lateral sclerosis brain. J Neuropathol Exp Neurol. 1991;50:263–277. doi: 10.1097/00005072-199105000-00008. [DOI] [PubMed] [Google Scholar]
- 33.Latov N, Nilaver G, Zimmerman EA, Johson WG, Silverman AJ, Defendini R, Cote L. Fibrillary astrocytes proliferate in response to brain injury. Dev Bio. 1979;72:381–384. doi: 10.1016/0012-1606(79)90127-1. [DOI] [PubMed] [Google Scholar]
- 34.Legius EM, Collins FS, Glover TW. Somatic deletion of the neurofibromatosis type 1 gene in a neurofibrosarcoma supports a tumor suppressor hypothesis. Nature Genet. 1993;3:122–126. doi: 10.1038/ng0293-122. [DOI] [PubMed] [Google Scholar]
- 35.Lindsay RM. Reactive Gliosis. In: Fedoroff S, Vernadakis A, editors. Astrocytes: Cell Biology and Pathology of Astrocytes. Vol. 3. Academic Press; Orlando, FL: 1986. pp. 231–262. [Google Scholar]
- 36.Listernick R, Louis DN, Packer RJ, Gutmann DH. Optic pathways glioma in children with neurofibromatosis 1: consensus statement from the optic pathway glioma task force. Ann Neurol. 1997;41:143–149. doi: 10.1002/ana.410410204. [DOI] [PubMed] [Google Scholar]
- 37.Markwell MA, Aaas SM, Bieber L, Tolbert NE. A modification of the Lowry procedure to simplify protein determination in membrane and lipoprotein samples. Anal Biochemistry. 1978;82:206–210. doi: 10.1016/0003-2697(78)90586-9. [DOI] [PubMed] [Google Scholar]
- 38.Mulvihill JJ, Parry DM, Sherman JL, Pikus A, Kaiser-Kupfer MI, Eldridge R. NIH conference: neurofibromatosis 1 (Recklinghausen disease) and neurofibromatosis 2 (bilateral acoustic neurofibromatosis), an update. Annals of Internal Medicine. 1990;113:39–52. doi: 10.7326/0003-4819-113-1-39. [DOI] [PubMed] [Google Scholar]
- 39.Nordlund ML, Rizvi TA, Brannan CI, Ratner N. Neurofibromin expression and astrogliosis in neurofibromatosis (type 1) brains. J Neuropathol Exp Neurology. 1995;54:588–600. doi: 10.1097/00005072-199507000-00013. [DOI] [PubMed] [Google Scholar]
- 40.Nordlund M, Gu X, Shipley MT, Ratner N. Neurofibromin is enriched in the endoplasmic reticulum of CNS neurons. J Neurosci. 1993;13:1588–1600. doi: 10.1523/JNEUROSCI.13-04-01588.1993. [DOI] [PMC free article] [PubMed] [Google Scholar]
- 41.North KN, Riccardi VM, Samago-Sprouce C, Ferner R, Legius E, Moore B, Legius E, Ratner N, Denckla MB. Cognitive function and academic performance in Neurofibromatosis type 1: consensus statement from the NF1 cognitive disorders task force. Neurology. 1997;48:1121–1127. doi: 10.1212/wnl.48.4.1121. [DOI] [PubMed] [Google Scholar]
- 42.North K, Joy P, Yuille D, Cocks N, Hutchins P. Cognitive function and academic performance in children with neurofibromatosis. Develop Medicine Child Neurol. 1995;37:427–436. doi: 10.1111/j.1469-8749.1995.tb12026.x. [DOI] [PubMed] [Google Scholar]
- 43.O’Callaghan JP, Jensen KF. Enhanced expression of glial fibrillary acidic protein and cupric silver degeneration reaction can be used as sensitive markers and early indicators of neurotoxicity. Neurotoxicology. 1992;13:113–132. [PubMed] [Google Scholar]
- 44.O’Callaghan JP. Biochemical analysis of glial fibrillary acidic protein as a quantitative approach to neurotoxicity assessment: advantages and application to the assessment of NMDA receptor antagonist induced neurotoxicity. Psychopharmacol Bull. 1994;30:549–554. [PubMed] [Google Scholar]
- 45.Oh TH, Markelonis GJ, Von Visger JR, Bail B, Shipley MT. Acidic pH rapidly increases immunoreactivity of glial fibrillary acidic protein in cultured astrocytes. Glia. 1995;13(4):319–322. doi: 10.1002/glia.440130408. [DOI] [PubMed] [Google Scholar]
- 46.Pont MS, Elster AD. Lesions of skin and brain: modern imaging of the neurocutaneous syndromes. Am J Roentgenol. 1992;158:1193–1203. doi: 10.2214/ajr.158.6.1590106. [DOI] [PubMed] [Google Scholar]
- 47.Riccardi VM. Natural History and Pathogenesis. 2. Johns Hopkins University Press; Baltimore: 1992. Neurofibromatosis: Phenotype; p. 498. [Google Scholar]
- 48.Ridet JL, Malhotra SK, Privat A, Gage FH. Reactive astrocytes and molecular cues to biological function. Trends Neurosci. 1997;20(12):570–577. doi: 10.1016/s0166-2236(97)01139-9. [DOI] [PubMed] [Google Scholar]
- 49.Rosenbaum T, Patrie K, Ratner N. Neurofibromatosis Type 1: genetic and cellular mechanisms of peripheral nerve tumor formation. Neuroscientist. 1997;3:412–420. [Google Scholar]
- 50.Rosman NP, Pearce J. The brain in multiple neurofibromatosis (von Recklinghausen’s disease): a suggested neuropathological basis for the associated mental defect. Brain. 1967;90:829–838. doi: 10.1093/brain/90.4.829. [DOI] [PubMed] [Google Scholar]
- 51.Sevick RJ, Barkovich AJ, Edwards MSB, Koch T, Berg B, Lempert T. Evolution of white matter lesions in neurofibromatosis type 1: MR findings. Am J Roentgenol. 1992;159:171–175. doi: 10.2214/ajr.159.1.1609692. [DOI] [PubMed] [Google Scholar]
- 52.Shannon KM, O’Connell P, Martin GA, Paderanga D, Olson K, Dinndorf P, McCormick F. Loss of the normal NF1 allele from the bone marrow of children with type 1 neurofibromatosis and malignant myeloid disorders. New Engl J Med. 1994;330:597–601. doi: 10.1056/NEJM199403033300903. [DOI] [PubMed] [Google Scholar]
- 53.Silva AJ, Frankland PW, Marowitz Z, Friedman E, Lazlo G, Cioffi D, Jacks T, Bourtchuladze R. A mouse model for learning and memory deficits associated with neurofibromatosis type 1. Nature Genet. 1997;15(3):281–284. doi: 10.1038/ng0397-281. [DOI] [PubMed] [Google Scholar]
- 54.Stone R. New marker for nerve damage. Science. 1993;259:1541. doi: 10.1126/science.8456282. [DOI] [PubMed] [Google Scholar]
- 55.Switzer C. Strategies for assessing neurotoxicity. Neurosci Biobehav Rev. 1991;15:89–93. doi: 10.1016/s0149-7634(05)80097-1. [DOI] [PubMed] [Google Scholar]
- 56.von Recklinghausen FD. Ueber die multiplen fibrome der haut und ihre Beziehung zu den multiplen Neuromen. 1882. [PubMed] [Google Scholar]
- 57.Xu W, Mulligan LM, Ponder MA, Liu L, Mathew CGP, Ponder BAJ. Loss of Nf1 alleles in phaeochromocytomas from patients with type 1 neurofibromatosis, Genes. Chromosomes and Cancer. 1992;4:337–342. doi: 10.1002/gcc.2870040411. [DOI] [PubMed] [Google Scholar]


