

Abstract
Objective
This secondary analysis from the Stop Atherosclerosis in Native Diabetics Study examines the effects of lowering low-density lipoprotein cholesterol (LDL-C) with statins alone versus statins plus ezetimibe (E) on common carotid artery intimal medial thickness (CIMT) in patients with type 2 diabetes and no prior cardiovascular event.
Background
It is unknown whether the addition of E to statin therapy affects subclinical atherosclerosis.
Methods
Within an aggressive group (target LDL-C ≤70mg/dL; non-high-density lipoprotein [non-HDL]-C ≤<100 mg/dL; systolic blood pressure [SBP] ≤115mmHg), change in CIMT over 36mos was compared in diabetic individuals >40 yrs receiving statins plus E versus statins alone. CIMT changes in both aggressive subgroups were compared with changes in the standard subgroups (target LDL-C ≤<100mg/dL; non-HDL-C ≤ 130 mg/dL; SBP ≤130mmHg).
Results
Mean (95%CI) LDL-C was reduced by 31 (23, 37)mg/dL and 32 (27, 38)mg/dL in the aggressive group receiving statins plus E and statins alone, respectively, compared with changes of 1 (−3, 6) mg/dL in the standard group (p<0.0001 vs both aggressive subgroups. Within the aggressive group, mean IMT at 36mos regressed from baseline similarly in the E (−.025 [−05,.003] mm) and non-E subgroups (−.012 [−.03,.008] mm) but progressed in the standard treatment arm (0.039 [0.02, 0.06] mm), intergroup p<0.0001.
Conclusions
Reducing LDL-C to aggressive targets resulted in similar regression of CIMT in patients who attained equivalent LDL-C reductions from a statin alone or statin plus E. CIMT increased in those achieving standard targets.
Keywords: ezetimibe, CIMT, atherosclerosis
INTRODUCTION
Ezetimibe (E) diminishes intestinal cholesterol absorption by inhibiting the Niemann-Pick-like 1 enterocyte receptor, thereby upregulating low-density lipoprotein cholesterol (LDL-C) receptors and lowering serum levels of LDL-C and non-high-density lipoprotein (non-HDL)-C (1). Since its approval for clinical use, it has become a major adjunct to statins in lowering LDL-C (2). Implicit in the use of E to lower LDL-C is the belief that the resultant lowering will translate into a reduction in clinical atherosclerotic cardiovascular (CV) events, similar to that observed with statins. This hypothesis, however, remains unproven.
No data are available on the influence of ezetimibe on atherosclerosis except for findings from the Effect of Combination Ezetimibe and High-Dose Simvastatin vs. Simvastatin Alone in the Atherosclerotic Process in Patients with Heterozygous Familial Hypercholesterolemia (ENHANCE) trial (3). Despite an additional 17% reduction in LDL-C in the group receiving E plus simvastatin compared with statin alone, the average increase in CIMT over 2 years in the group receiving combination therapy did not differ significantly from that in the statin-only group (3).
The Stop Atherosclerosis in Native Diabetics Study (SANDS) was a randomized, open-label, blinded to outcomes, 3-year trial examining the effects of aggressive goals for LDL-C (≤70 mg/dL), non-high-density lipoprotein cholesterol (non-HDL-C) (≤100 mg/dL), and blood pressure (BP) (≤115/75 mmHg) reduction versus standard goals of ≤100 mg/dL, ≤130 mg/dL, and ≤130/80 mmHg, respectively, in 499 individuals with type 2 diabetes (4). The primary outcome was change in CIMT after 36 months of treatment. Substantial epidemiological data documents strong relationships between LDL-C, non-HDL-C, and BP and CV events in American Indians, a population with high rates of diabetes and diabetes-related CV disease (5,6). Among patients randomized to the aggressive treatment goals (n=252), E was used in about one third as an adjunct to statin therapy. This secondary analysis from SANDS examines the effect of aggressive lowering of LDL-C and non-HDL-C with statins alone versus statins plus E on CIMT and other measures of carotid atherosclerosis. Individuals randomized to standard LDL-C, non-HDL-C and SBP targets served as a reference group.
METHODS
Recruitment and Intervention
Details of the design and main results of SANDS have been published (4,7). In total, 499 American Indian men and women ≥age 40 with type 2 diabetes, LDL-C>100mg/dL, SBP>130mmHg, and no prior CV events were enrolled between May 2003 and July 2004 at four clinical centers and randomized to aggressive (n=252) or standard treatment groups (n=247), stratified by center and gender (Figure 1). All participants provided informed written consent. The study was approved by all participating institutional review boards, the National Institutes of Health, and all participating American Indian communities.
Figure 1. SANDS Participant Flow Diagram.

CVD = cardiovascular disease
IMT = intimal medial thickness
LDL-C = low-density lipoprotein cholesterol
SBP = systolic blood pressure
TG = triglyceride
The standard group was treated to conventional goals for LDL-C (100 mg/dL), non-HDL-C (130 mg/dL), and SBP (130 mmHg) and the aggressive group to goals of 70 mg/dL, 100 mg/dL, and 115 mmHg, respectively. The algorithm for attaining lipid goals was based on recommendations of the National Cholesterol Education Program – Adult Treatment Panel III (NCEP-ATP III) (8). If lifestyle modification was unsuccessful in lowering LDL-C to the prescribed goals within 3 months, a statin was started. If the LDL-C goal was not reached with a statin alone, E was added. Non-HDL-C goals were addressed using fish oil, fenofibrate, or niacin. Details of the intervention procedures and targets have been published (4,7). The baseline visit included collection of demographic data, health history, and current medication use plus a physical exam, electrocardiogram, carotid artery ultrasound, and echocardiogram. Height, weight, waist circumference, and seated BP were measured; fasting blood samples were collected to measure chemistry panel, lipoprotein profile, glucose, hemoglobin A1c, C-reactive protein (CRP), and creatinine; and urine samples were obtained for urinary albumin and creatinine as described previously (4,7). Participants were followed from date of entry until death, loss to follow-up, request for no further contact, or completion of the study, regardless of adherence to the medication intervention. Follow-up visits occurred in both groups after 1 month, and then every 3 months through 36 months, and a lipid profile obtained, using a Cholestech LDX apparatus [Cholestech Corporation, Hayward, CA] standardized against the laboratory assay (9). At 36 months, fasting blood and urine samples were obtained to repeat all baseline measurements; additionally, fasting blood samples for complete lipoprotein profile and urine samples for albumin and creatinine were obtained at 6, 12, 18, 24, and 30 months (4,7).
Outcomes Ascertainment
At baseline and 18- and 36-month visits, carotid ultrasound studies were performed following standardized protocols (10) by centrally trained sonographers and interpreted at a core reading center by a single experienced cardiologist reader blinded to treatment assignment (11). For these studies, B-mode imaging from multiple angles was performed to determine the presence and location of plaque (focal protrusion into the vessel lumen ≥50% greater than the surrounding wall), as well as arterial wall dimensions. Plaque score (0–8) was determined as the number of arterial segments (left and right common carotid, bulb, internal and external carotid arteries) containing plaque; a participant with plaque was anyone with a score ≥1. End-diastolic B-mode images of the distal right and left common carotid artery (CCA) were acquired in real-time, and a 1-cm segment of each far wall was measured using an automated system employing an edge detection algorithm with manual override capacity. One hundred separate dimensional measurements were obtained from the 1-cm segment and averaged to obtain mean CIMT and lumen diameter.
Data Analysis
This non-prespecified secondary analysis compared CIMT changes in those receiving 1) aggressive lipid therapy with statin monotherapy, 2) aggressive therapy with statin plus E, or 3) standard statin monotherapy. Of 499 participants, 47 individuals in whom CIMT measurements were not available after 36 months of treatment were excluded (Figure 1). In addition, the 25 individuals in the standard group who received E were excluded because their different lipid goals compared to the aggressive group confounded the analysis. However, their inclusion did not significantly affect any of the comparisons shown. Including these individuals, change in CIMT in the standard group at 36 months was.041 mm (vs.039 mm excluding them); change in LDL-C was 1.5mg/dL (vs 0.9 mg/dL excluding them). For all analyses, the aggressive group was divided into two subgroups, one composed of patients receiving E and the other, patients who were not. Variables of interest at baseline and 36 months in each aggressive subgroup were compared with the standard group as well as with each other. The changes in these variables during the study period were tested using two-sided F and chi-square tests. A Bonferroni adjustment was applied for multiple comparisons. To assess the effect of treatment, the changes in the carotid measures (CIMT mean and plaque score) were computed for each group and the differences in changes at 36 months across groups were compared using Bonferroni adjusted F-tests. Change in CIMT was categorized into two possible outcomes (decreased/no change vs increased), and logistic regression analyses adjusting for relevant variables were conducted to test for differences between the E and non-E subgroups compared with the standard treatment.
RESULTS
Altogether, 427 SANDS participants fulfilled the inclusion criteria for the secondary analysis, 204 in the standard treatment group and 223 in the aggressive group (154 who received statin alone and 69 who received statin plus E). Median duration of E therapy was 21 months. Baseline characteristics of these subgroups are compared in Tables 1 and 2. In Table 2, significant subgroup differences in the mean change values are indicated by superscripts in the standard-group column. The subgroups were comparable with regard to age, gender mix, diabetes therapy, aspirin use, smoking status, and renal function (Table 1). Similar infrequent use of fibrates, fish oil, and niacin was seen among all of the subgroups. The vast majority in all three subgroups were receiving oral hypoglycemic medication (Table 1). The E subgroup, however, had significantly lower SBP (vs no E, p=0.007; vs standard, p=0.0004) and diastolic BP, (vs no E, p=0.02; vs standard, p=0.004) at baseline than the other two subgroups.
Table 1.
Baseline Characteristics of the SANDS Participants
| Standard Group(N=204) | Aggressive Group(N=223) | |||
|---|---|---|---|---|
| All | Ezetimibe(N=69) | No Ezetimibe(N=154) | P- value | |
| Mean (95% CI) | Mean (95% CI) | Mean (95% CI) | ||
| Age (years) | 57 (56,58) | 55 (53,57) | 57 (55,58) | .20 |
| Gender, women N (%) | 138 (68) | 41 (59) | 106 (69) | .36 |
| Diabetes Therapy | .20 | |||
| Lifestyle N (%) | 23 (12) | 3 (4) | 13 (9) | |
| Oral hypoglycemic N (%) | 117 (64) | 40 (59) | 100 (66) | |
| Insulin N (%) | 13 (7) | 10 (15) | 11 (7) | |
| Insulin plus oral N (%) | 31(17) | 15 (22) | 27 (18) | |
| Lipid Medications N (%) | ||||
| Statins* | 75 (37) | 30 (44) | 44 (29) | .07 |
| Fibrates* | 10 (5) | 5 (7) | 6 (4) | .54 |
| Niacin* | 2 (1) | 0 | 0 | .66 |
| Fish oil* | 2 (1) | 0 | 2 (1) | 1.00 |
| eGFR (N= S:199; E+:68; E−:150) | 87.7 (84,91) | 93.4 (88,99) | 89.5 (86,93) | .25 |
| Smoker N (%) | 37 (18) | 14 (20) | 32 (21) | .81 |
| Aspirin (≥ 80 mg) N (%) | 154 (68) | 49 (71) | 111 (72) | .78 |
Abbreviations: eGFR = estimated glomerular filtration rate; E+= ezetimibe subgroup; E− = no-ezetimibe subgroup; S=standard group.
prior to randomization.
Notes: 1) Chi-square test was used for categorical variables and ANOVA F test was used for continuous variables. 2) The sample size for the baseline characteristics was determined by the available data on 36-mo IMT mean measurement. The standard group excluded 25 patients who were on ezetimibe.
Table 2.
Baseline and 36-Month Changes in Blood Pressure, Lipids, and Other Relevant Variables
| Baseline | 36 Mo | Mean Change at 36 Mo | ||||||||
|---|---|---|---|---|---|---|---|---|---|---|
| Standard Group (S) |
Ezetimibe (E+) |
NoEzetimibe (E−) |
Standard Group (S) |
Ezetimibe (E+) |
No Ezetimibe (E−) |
Standard Group (S) |
Ezetimibe (E+) |
No Ezetimibe (E−) |
p-value (mean change) |
|
| Mean (95%CI) |
Mean (95%CI) |
Mean (95%CI) |
Mean (95%CI) |
Mean (95%CI) |
Mean (95%CI) |
Mean (95%CI) |
Mean (95%CI) |
Mean (95%CI) |
ANOVA F-test |
|
| Weight, kg | 89 # (86,91) | 95 (90,100) | 89 (86,92) | 91 (88,94) | 95 (90,99) | 90 (87,94) | 1.6 (−.2,3.1) | −0.7 (−2.6,1.3) | 1.3 (−.8,3.4) | .32 |
| BMI, kg/m2 | 33 (32,34) | 35 (33,37) | 33 (32,34) | 34 (33,35) | 35 (33,36) | 34 (33,35) | 0.7 (−0.1,1.2) | −0.2 (−0.1,0.5) | 0.5 (−0.3,1.3) | .33 |
| Systolic BP, mm Hg | 131# (129,133) | 124 (121,127) | 130 (127,132) | 129#,& (128,130) | 115 (113,117) | 117 (115,119) | −2.4#,& (−5,0) | −9 (−12, − 6) | −13 (−15, − 10) | .0001 |
| Diastolic BP, mm Hg | 75# (74,77) | 71 (69,74) | 75 (73,76) | 73#,&, (72,74) | 66 (64,68) | 67 (66,69) | −2& (−3, − 1) | −5 (−7, − 3) | −7 (−9, − 6) | .0001 |
| Total C, mg/dL | 183 (178,187) | 187 (179,195) | 181 (176,187) | 185#,& (181,188) | 156* (148,163) | 146 (142,151) | 2#,& (−3,7.1) | −31 (−40, − 22) | −34 (−40, − 28) | .0001 |
| LDL-C, mg/dL | 102 (98,106) | 108 (101,116) | 101 (97,106) | 103#,& (100,105) | 78* (72,84) | 68 (65,72) | 0.9#,& (−3.6,5.4) | −31.1 (−36.7, − 23) | −32.3 (−38, − 26.6) | .0001 |
| HDL-C, mg/dL | 46 (44,48) | 46 (42,49) | 46 (44,48) | 49 (47,50) | 48 (46,51) | 49 (46,51) | 2.7 (1.3,4.2) | 2.7 (.7,4.7) | 2.5 (1,4.1) | .987 |
| Total C/HDL-C | 4.2 (4.0,4.3) | 4.4 (4.1,4.7) | 4.2 (4,4.3) | 4.0#,& (3.9,4.1) | 3.4 (3.1,3.6) | 3.2 (3.0,3.4) | −0.2#,& (−0.3, −.0.1) | −1.0 (−1.3, −.7) | −0.9 (−1.1, − 0.7) | .0001 |
| Non-HDL-C, mg/dL | 137 (133,141) | 141 (133,150) | 135 (130,140) | 136#,& (133,139) | 107 (100,115) | 98 (93,102) | −0.7#,& (−5.7,4.3) | −34.0 (−43, − 25) | −36.6 (−43, − 30) | .0001 |
| Triglycerides mg/dL | 164 (140,171) | 154 (139,171) | 159 (148,171) | 157#,& (150,165) | 136 (123,150) | 138 (130,150) | −6% (−11,.0%) | −12% (−20, − 3%) | −15% (−21, − 8%) | .11 |
| A1c (%) | 7.9 (7.6,8.2) | 8.3(7.8,8.8) | 8.1(7.8,8.4) | 8.0(7.7,8.2)# | 8.7(8.2,9.3) | 8.1(7.7,8.4) | 0.4(−.3,4) | 0.4(−.1,.9) | −0.04 (−0.4,0.3) | .38 |
| CRP mg/dL | 2.80 (2.4,3.3) | 3.25 (2.5,4.3) | 2.58 (2.1,3.2) | 3.3& (2.8,3.9) | 2.96 (2.1,4.2) | 1.99 (1.6,2.5) | +11% & (−5,26%) | −24% (−47,. − 1%) | −26% (−47, − 4%) | .008 |
Abbreviations: BMI = body mass index; BP = blood pressure; C= cholesterol; CRP = C-reactive protein; E+ = ezetimibe subgroup; E− = no ezetimibe subgroup; HDL-C = high-density lipoprotein cholesterol; LDL = low-density lipoprotein; S = standard group.
Notes: 1) 36-month lipid variables are based on the average of 24-, 30- and 36-month observations.
2) P-values are based on the analysis of variance of the mean change measures comparing the standard group to E+ and E− groups. A Bonferroni adjustment was made to the significantly different pairs.
= significant difference between S and E+.
= significant difference between S and E− (based on log CRP).
= significant difference between E+ and E−.
3) Triglycerides and CRP were log-transformed. The means presented are exp (mean) of the logarithmic variables. The differences of the two logarithmic variables indicate mean % changes at 36 months for each group.
4) Sample size for baseline and 36-months may not be equal. Therefore, the mean changes apply to the sample where both measures exist.
Intervention
During the 36-month follow-up, no significant changes in body mass index or A1c levels were observed in any subgroup (Table 2). As anticipated, total, LDL-C, and non-HDL-C were reduced substantially and to a nearly identical extent in both aggressive subgroups but not in the standard subgroup. Both LDL–C and non-HDL-C, however, averaged 10mg/dL higher at follow-up in the aggressive subgroup using E compared with the aggressive subgroup using statin alone (p=.02), primarily reflecting higher baseline values. As designed, both LDL-C and non-HDL-C were significantly lower at 36 months in both aggressive subgroups compared with the standard subgroup. Similar small increases in HDL-C occurred in all three subgroups, and there were greater decreases in triglycerides in the two aggressive subgroups. Serum CRP decreased similarly (24–26%) in the aggressive groups but increased by 11% in the standard group (p<.05). As anticipated, BP was reduced more in both aggressive subgroups than in the standard subgroup; within the aggressive group, SBP reduction was significantly greater in the non-E than the E subgroup, p=0.03. Adverse events thought to be related to lipid lowering drugs occurred in similar modest proportions (14–18%) in all three subgroups.
CIMT
Baseline and 36-month values for CIMT and plaque score, as well as changes from baseline, are detailed in Table 3. CIMT progressed in the standard group and regressed in both aggressive subgroups; at 36 months the aggressive subgroups significantly differed from the standard group (p<0.001). Plaque score was similar at baseline, with similar modest increases at 36 months in all three subgroups. Figure 2 compares the proportion of patients in the three subgroups who experienced an increase in CIMT >0.01 mm from baseline to 36 months versus no change or a decline in CIMT. Nearly identical proportions in the two aggressive subgroups (62% E vs 61% no E) demonstrated no change or a decrease in CIMT during follow up, compared with 39% in the standard subgroup, p<0.0001. CV events occurred in 16 individuals, 3.5%, 5.8%, and 3.3% of persons in the standard, aggressive with E, and aggressive without E subgroups, respectively, p=0.62.
Table 3.
Baseline and Follow-up Carotid Measures
| Standard Group (S) N=204 | Aggressive Group N=223 | Bonferroni Adjusted | |||||
|---|---|---|---|---|---|---|---|
| Ezetimibe(E+) | No Ezetimibe(E−) | F test(p- value) | Group Diff. (p-value) E+ vs E− | Group Diff. (p-value) E+ vs S | Group Diff. (p-value) E− vs S | ||
| Mean (95% CI) | Mean (95% CI) | Mean (95% CI) | |||||
| CIMT (mm) | |||||||
| Baseline | .794 (.77,.82) | .819 (.77,.86) | .813 (.78,.84) | .46 | |||
| 18 mo | .803 (.78–.82) | .815(.78–.86) | .810 (.78–.84) | .84 | |||
| 36 mo | .833(.81–.86) | .794 (.75,.84) | .801 (.77,.83) | .17 | |||
| Mean Change,18 mo | .009 (−.01,.03) | −.006(−.03,.02) | −.005(.02,.014) | .48 | |||
| Mean Change, 36 mo | .039 (.02,.06) | −.025(−.05,.003) | −.012(.03,.008) | .0001 | .01(.999) | .06(.001) | .05(.001) |
| Plaque Score | |||||||
| Baseline | 1.83 (1.6,2.1) | 1.93 (1.5,2.3) | 1.88 (1.6,2.1) | .89 | |||
| 18 mo | 2.02 (1.8,2.2) | 2.10 (1.7,2.5) | 2.11 (1.9,2.4) | .84 | |||
| 36 mo | 2.33 (2.1,2.6) | 2.35 (1.9,2.8) | 2.49 (2.2,2.8) | .65 | |||
| Mean Change, 18 mo | .18 (.04,.3) | .17 (−.04,.4) | .21 (.06,.4) | .94 | |||
| Mean Change, 36 mo | .51 (.4,.7) | .42 (.1,.7) | .61 (.4,.8) | .50 | |||
Abbreviations: E+ = ezetimibe subgroup; E− = no ezetimibe subgroup; CIMT = carotid artery intimal medial thickness; S = standard group.
Figure 2. Categorical Change in Carotid Intimal Medial Thickness in SANDS Subgroups.
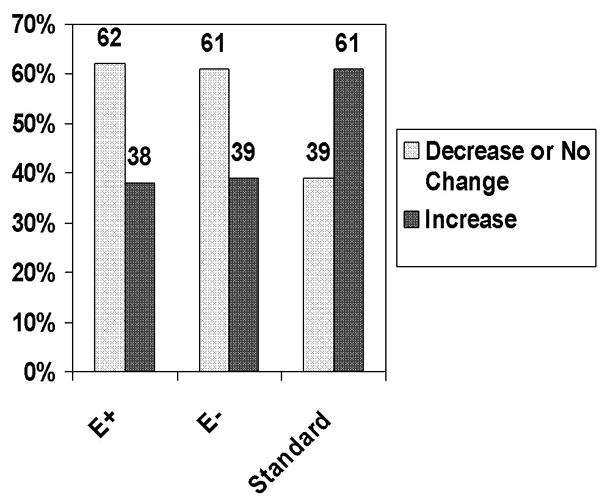
Numbers represent percentages of participants who experienced a decrease or no change in CIMT greater than 0.01mm versus an increase. The majority of both aggressive subgroups experienced a decline or no change in IMT, whereas the majority of the standard group showed an increase, p<0.0001.
E+ = statin plus ezetimibe; E− = statin alone
In a logistic regression analysis of the categorical change in CIMT mean over 36 months (decrease or same vs increase) that included indicator variables for the E and non-E groups, baseline age, IMT, BMI, change in LDL-C, HDL-C, and SBP, the E and non-E subgroups did not differ and were both more likely to experience a decrease in CIMT compared with the standard group (E vs. standard, OR= 2.30, p=0.009; no E vs standard, OR=2.07, p=0.003). In this model, higher baseline CIMT (p= p<0.0001) and changes in LDL-C (p =.06) were correlated with a greater reduction in CIMT. Baseline SBP and change in SBP did not correlate with change in CIMT.
DISCUSSION
In the SANDS cohort, composed of persons with type 2 diabetes with baseline LDL-C≥ 100 mg/dL, approximately one-third of those targeted to an aggressive LDL-C goal of ≤70 mg/dL and non-HDL-C≤100 mg/dL required E in addition to statins to reach these goals. Similar reductions in LDL-C and non-HDL-C were accompanied by a similar regression in CIMT over 36 months in the aggressive target subgroups (−.025 in E+ vs−.012 in E−), whereas CIMT increased (+.039) in the group randomized to standard targets. In a multivariate model, greater reduction in LDL-C and non-HDL-C, higher baseline CIMT, and younger age correlated with a greater decrease in CIMT, whereas treatment with E vs without E made no independent contribution. Thus, comparable LDL-C and non-HDL-C lowering accomplished with statins plus E versus statins alone resulted in similar benefit on CIMT. There were no serious adverse events related to lipid drugs in the trial. There were five cases of cancer, three in the E- subgroup and two in the standard group.
Since its introduction into clinical practice in 2002, E has become the primary adjunct to statins in reducing elevated LDL-C (1,2). Similar to other LDL-C lowering drugs, its approval by the U.S. Food and Drug Administration was based upon its ability to reduce LDL-C (1). Only one completed clinical trial (Simvastatin and Ezetimibe in Aortic Stenosis) has examined the ability of E combined with statins to reduce CV events; it showed a 22% reduction compared to placebo (12).
In the ENHANCE trial (3) of 720 patients with familial hypercholesterolemia, no statistically significant difference in the primary endpoint of mean increase in CIMT over 24 months was seen between the statin alone and the statin plus E arms (p=0.29), despite a 58% vs 41% reduction in LDL-C with combination therapy. Despite recognized methodologic limitations, including the high baseline LDL-C levels of participants, high prevalence of prior statin therapy, lower than expected baseline CIMT, short follow up, and lack of statistically significant primary or secondary outcomes, the ENHANCE study has stimulated controversy and concern regarding the clinical utility of E (3). In addition, the report of increased CV morbidity and mortality in patients receiving the cholesterol ester transport protein inhibitor torcetrapib plus high-dose statin compared with those receiving statin alone, despite marked increases in HDL-C in the former group, has raised concern that achieving apparently beneficial changes in serum lipid levels may not necessarily improve clinical outcomes (13). The ENHANCE findings have further fueled this controversy.
In contrast to ENHANCE, the findings in the current secondary analysis of SANDS suggest that the combination of E plus statin, despite higher final levels of LDL-C and SBP, has essentially an identical beneficial effect on CIMT as statin alone, for a similar change in LDL-C and non-HDL-C. Although SANDS was not a randomized comparison of these therapies, several strengths of the present analysis should be noted. As contrasted with the markedly elevated baseline LDL-C levels of 319 mg/dL in ENHANCE participants, the mild baseline elevation of LDL-C levels in SANDS are more representative of the majority of patients requiring LDL-C lowering drugs. Additionally, the mean baseline CIMT of 0.81mm in SANDS participants was substantially greater than the value of 0.69mm in ENHANCE, providing perhaps more opportunity to detect regression in CIMT. The CASHMERE study, another study where baseline CIMTs were low, also showed no effect of statin on CIMT (14). Another difference from ENHANCE is our sequential use of E after high-dose statin therapy failed to adequately reduce LDL-C or was limited by side effects. Indeed, the LDL-C reductions in the subgroups with or without E were nearly identical, as were the declines in CIMT. Mean LDL-C and non-HDL-C were slightly higher at both baseline and follow-up in the E subgroup, although the change in LDL-C was nearly identical to the subgroup receiving statin alone. The higher baseline LDL-C and non-HDL-C levels in the subgroup requiring E, although not statistically significant, might be anticipated; nevertheless similar improvements in CIMT were observed in the two aggressive subgroups.
Certain limitations of the present analysis must be recognized. As mentioned above, our sample size was modest and was not powered to detect a difference in clinical events between treatment groups. Thus, the primary outcome was CIMT, an index of atherosclerotic progression that has been used in multiple modest sized trials of lipid-altering agents (15,16). Second, this was not a randomized comparison of statin plus E versus statin alone; thus, there were differences in characteristics between these subgroups. SBP averaged 6mmHg lower in the E subgroup at baseline, and the decline in SBP at 36 months was 5mmHg less in this group than in the aggressive subgroup not receiving this drug; similar trends were observed for DBP. Although this difference may have biased the outcomes against the E subgroup, SBP change did not significantly influence CIMT in the main SANDS trial or in our multivariate analysis. Finally, the SANDS trial was limited to American Indians with diabetes; similar data in more diverse populations are needed.
Conclusion
In conclusion, the findings from this secondary analysis of SANDS suggest that for a similar extent of LDL-C and non-HDL-C lowering to respective targets of ≤70 and ≤100 mg/dL, a nearly identical regression in carotid IMT occurs in patients with type 2 diabetes who achieve similar reductions in these lipid levels from a statin alone versus statin plus E; in contrast, CIMT increased in patients titrated to a conventional LDL-C target of ≤100 mg/dL. Whether addition of E to aggressive statin therapy will translate into lower CV event rates in populations without prior CV events must await the results of ongoing trials. In the interim, E remains a viable therapeutic option for patients who fail to reach their LDL-C target on a statin alone.
Acknowledgments
We thank the Indian Health Service facilities, SANDS participants, and participating tribal communities for extraordinary cooperation and involvement without which this study would have been impossible. We thank Rachel Schaperow for editorial services. We gratefully acknowledge donations of pharmacologic agents by First Horizon Pharmacy (Triglide); Merck and Co. (Cozaar/Hyzaar); and Pfizer, Inc. (Lipitor). The opinions expressed in this paper are those of the author(s) and do not necessarily reflect the views of the Indian Health Service, the Office of Public Health and Science, or the National Institutes of Health.
Financial support: Funding was provided by the National Heart, Lung, and Blood Institute, National Institutes of Health, NHLBI grant # 1U01 HL67031-01A1. Medications were donated by First Horizon Pharmacy (Triglide); Merck and Co., Cozaar/Hyzaar; Pfizer, Inc. (Lipitor).
ABBREVIATIONS
- BP
blood pressure
- CCA
common carotid artery
- CIMT
common carotid artery intimal medial thickness
- CRP
C-reactive protein
- CV
cardiovascular
- E
ezetimibe
- LDL-C
low-density lipoprotein cholesterol
- Non-HDL-C
non-high-density lipoprotein cholesterol
- SANDS
Stop Atherosclerosis in Native Diabetics Study
- SBP
systolic blood pressure
Footnotes
Disclosures: Dr. B.V. Howard has served on the advisory boards of Merck, Shering Plough, the Egg Nutrition Council, and General Mills and has received research support from Merck and Pfizer. Dr. Wm. J. Howard has received research support from Pfizer, Astra Zeneca, Merck and Schering Plough; has served as a consultant for Merck, Schering Plough, Pfizer, and Reliant; and has served on the speakers bureau for Merck, Schering Plough, Pfizer, Astra Zeneca, Abbott, and Daichi Sankyo. Dr. Ratner has received research support from AstraZeneca, Bayhill Therapeutics, Boehringer Ingelheim, GlaxoSmithKline, Merck, NovoNordisk, Pfizer, Takeda, and Veraligh; has served on the advisory boards of Amylin, AstaZeneca, ElliLilly, GlaxoSmith Kline, Lifescan, NovoNordisk, Sanofi-Aventis, Takeda, and Tethys Bioscience; and owns stock in Merck, Johnson & Johnson, and Abbott. Dr. Weir has served on the speaker’s bureau for Merck Sharp & Dohme, Novartis, Boehringer Ingelheim, and Bristol-Myers Squibb. The other authors have nothing to declare.
Publisher's Disclaimer: This is a PDF file of an unedited manuscript that has been accepted for publication. As a service to our customers we are providing this early version of the manuscript. The manuscript will undergo copyediting, typesetting, and review of the resulting proof before it is published in its final citable form. Please note that during the production process errors may be discovered which could affect the content, and all legal disclaimers that apply to the journal pertain.
References
- 1.Jackevicius CA, Tu JV, Ross JS, Ko DT, Krumholz HM. Use of ezetimibe in the United States and Canada. N Engl J Med. 2008;358:1819–28. doi: 10.1056/NEJMsa0801461. [DOI] [PubMed] [Google Scholar]
- 2.Bruckert E, Giral P, Tellier P. Perspectives in cholesterol-lowering therapy: the role of ezetimibe, a new selective inhibitor of intestinal cholesterol absorption. Circulation. 2003;107:3124–3128. doi: 10.1161/01.CIR.0000072345.98581.24. [DOI] [PubMed] [Google Scholar]
- 3.Kastelein JJ, Akdim F, Stroes ES, et al. Simvastatin with or without ezetimibe in familial hypercholesterolemia. N Engl J Med. 2008;358:1431–43. doi: 10.1056/NEJMoa0800742. [DOI] [PubMed] [Google Scholar]
- 4.Howard BV, Roman MJ, Devereux RB, et al. Effect of lower targets for blood pressure and LDL cholesterol on atherosclerosis in diabetes: the SANDS randomized trial. JAMA. 2008;299:1678–89. doi: 10.1001/jama.299.14.1678. [DOI] [PMC free article] [PubMed] [Google Scholar]
- 5.Howard BV, Lee ET, Cowan LD, et al. Rising tide of cardiovascular disease in American Indians: the Strong Heart Study. Circulation. 1999;99:2389–2395. doi: 10.1161/01.cir.99.18.2389. [DOI] [PubMed] [Google Scholar]
- 6.Howard BV, Robbins DC, Sievers ML, et al. LDL cholesterol as a strong predictor of coronary heart disease in diabetic individuals with insulin resistance and low LDL. Arterioscler Thromb Vasc Biol. 2000;20:830–835. doi: 10.1161/01.atv.20.3.830. [DOI] [PubMed] [Google Scholar]
- 7.Russell M, Fleg JL, Galloway WJ, et al. Examination of lower targets for low-density lipoprotein cholesterol and blood pressure in diabetes--the Stop Atherosclerosis in Native Diabetics Study (SANDS) Am Heart J. 2006;152:867–75. doi: 10.1016/j.ahj.2006.05.021. [DOI] [PubMed] [Google Scholar]
- 8.Expert Panel on Detection, Evaluation, and Treatment of High Blood Cholesterol in Adults. Executive Summary of The Third Report of The National Cholesterol Education Program (NCEP) Expert Panel on Detection, Evaluation, And Treatment of High Blood Cholesterol In Adults (Adult Treatment Panel III) JAMA. 2001;285:2486–97. doi: 10.1001/jama.285.19.2486. [DOI] [PubMed] [Google Scholar]
- 9.Allain CC, Poon LS, Chan CS, et al. Enzymatic determination of total serum cholesterol. Clin Chem. 1974;20:470–5. Ortho-Clinical Diagnostics, a Johnson & Johnson company. Cholesterol. Pub No. MP2–35. 2000:1–10. [PubMed] [Google Scholar]
- 10.Devereux RB, Roman MJ. Evaluation of cardiac and vascular structure by echocardiography and other nonivasive techniques. In: Laragh JH, Brenner BM, editors. Hypertension: Pathophysiology, Diagnosis, Management. 2. New York: Raven Press; 1995. pp. 1969–85. [Google Scholar]
- 11.Roman MJ, Saba PS, Pini R, Spitzer M, Pickering TG, Rosen S, Alderman MH, Devereux RB. Parallel cardiac and vascular adaptation in hypertension. Circulation. 1992;86:1909–18. doi: 10.1161/01.cir.86.6.1909. [DOI] [PubMed] [Google Scholar]
- 12.Rossebø AB, Pedersen TR, Boman K, et al. SEAS Investigators. Intensive lipid lowering with simvastatin and ezetimibe in aortic stenosis. N Engl J Med. 2008;359:1343–56. doi: 10.1056/NEJMoa0804602. [DOI] [PubMed] [Google Scholar]
- 13.Barter PJ, Caulfield M, Eriksson M, et al. Effects of torcetrapib in patients at high risk for coronary events. N Engl J Med. 2007;357:2109–22. doi: 10.1056/NEJMoa0706628. [DOI] [PubMed] [Google Scholar]
- 14.Simon T, Boutouyrie P, Gompel A, Christin-Maitre S, Laurent S, Thuillez C CASHMERE investigators. Rationale, design and methods of the CASHMERE Study. Fundam Clin Pharmacol. 2004;18:131–138. doi: 10.1111/j.1472-8206.2003.00233.x. [DOI] [PubMed] [Google Scholar]
- 15.Taylor AJ, Sullenberger LE, Lee HJ, et al. Arterial Biology for the Investigation of the Treatment Effects of Reducing Cholesterol (ARBITER) 2: a double-blind, placebo-controlled study of extended-release niacin on atherosclerosis progression in secondary prevention patients treated with statins. Circulation. 2004;110:3512–17. doi: 10.1161/01.CIR.0000148955.19792.8D. [DOI] [PubMed] [Google Scholar]
- 16.Blankenhorn DH, Selzer RH, Crawford DW, Barth JD, Liu CR, Liu CH, Mack WJ, Alaupovic P. Beneficial effects of colestipol-niacin therapy on the common carotid artery. Two- and four-year reduction of intima-media thickness measured by ultrasound. Circulation. 1993;88:20–8. doi: 10.1161/01.cir.88.1.20. [DOI] [PubMed] [Google Scholar]