Abstract
The genetic basis of hypertension is well established, yet very few genes that cause common forms of hypertension are known. Quantitative trait locus (QTL) analyses in rodent models can guide the search for human hypertension genes, but the excellent genetic resources for mice have been underutilized in this regard. To address this issue, we surveyed blood pressure variation in mice from 37 inbred strains and generated 2,577 mice in eight intercross populations to perform QTL analyses of blood pressure. We identified 14 blood pressure QTL in these populations, including at least 7 regions of the mouse genome not previously linked to blood pressure. Many QTL were detected in multiple crosses, either within our study or in previously published studies, which facilitates the use of bioinformatics methods to narrow the QTL and focus the search for candidate genes. The regions of the human genome that correspond to all but one of the 14 blood pressure QTL in mice are linked to blood pressure in humans, suggesting that these regions contain causal genes with a conserved role in blood pressure control. These results greatly expand our knowledge of the genomic regions underlying blood pressure regulation in mice and support future studies to identify the causal genes within these QTL intervals.
Keywords: mouse, tail-cuff, blood pressure, quantitative trait locus, concordance
INTRODUCTION
Blood pressure is a highly heritable phenotype affected by multiple genes and environmental factors. The genetic basis of hypertension has been investigated extensively in humans through genome-wide and candidate-gene association studies, as well as genome-wide linkage analyses. Despite the substantial effort made to identify genes underlying polygenic hypertension (see Cowley (1) for review), few causal genes have been identified to date.
One alternative approach to studying the genetic basis of hypertension in humans is to identify genes affecting blood pressure in model organisms, mainly rodents, and then test those genes for a role in human blood pressure control. A common strategy for identifying genomic regions linked to a phenotype in rodent models is quantitative trait locus (QTL) analysis, and rodent blood pressure QTL often correspond to regions of the human genome containing genes affecting blood pressure (2;3). This finding suggests that the same genes may be linked to blood pressure control in humans and rodents. In fact, parallel studies in humans and rats successfully identified the genes encoding adducin (4) and 11β-hydroxylase (5) as important in blood pressure control. Recently, Chang et al. (6) combined human linkage analysis with published mouse linkage and haplotype analysis (7) to identify 9 candidate genes on human Chromosome (Chr) 1q that they tested for association with blood pressure in humans; two of the 3 genes significantly associated with blood pressure are within the mouse haplotype region. These findings support the approach of employing animal models to identify genes affecting blood pressure and then translating the findings to humans through association studies.
The resources available for genetic mapping in mice are exemplary, yet rats are the preferred rodent model for blood pressure QTL analysis. The rat genome database (www.rgd.mcw.edu) lists 292 blood pressure related QTL in rats, but only 13 QTL linked to blood pressure in mice. Therefore, we performed QTL analyses of blood pressure in eight mouse intercross populations to better understand the genetic regulation of blood pressure in mice and facilitate comparative genomic mapping between mice and humans.
METHODS
Breeding and Phenotyping Inbred Mice for the Strain Survey of Blood Pressure
Mice from 37 inbred strains were purchased from either The Jackson Laboratory (Bar Harbor, ME), Clea Japan (Tokyo, Japan), or Charles River Japan (Yokohama, Japan) and bred at the Laboratory Animal Resource Center, University of Tsukuba. Tail-cuff systolic blood pressures (SBP) were measured using a BP-98A blood pressure system (Softron, Tokyo, Japan; please see http://hyper.ahajournals.org for details). All blood pressure measurements were taken from 10-week-old, male mice in the morning, and the values from 100 successful readings (20 readings on each of five consecutive days) per mouse were used to calculate individual averages. Study protocols were approved by the University Animal Experimental Committee of the University of Tsukuba.
Breeding and Phenotyping F2 Populations
Mice from fourteen inbred strains were purchased from The Jackson Laboratory and bred at Novartis Pharmaceuticals Corp. to generate eight F2 populations for QTL analysis (summarized in Table 1). All of the F1 mice for each cross were generated in the same direction and intercrossed to produce the F2 progeny, meaning that maternal, imprinting, and mitochondrial effects were fixed within each F2 population. Tail-cuff blood pressure was measured in 8-week-old, male, F2 mice using a CODA-6 non-invasive blood pressure monitoring system (Kent Scientific, Torrington, CT). The accuracy of the CODA-6 system has been validated by comparison to simultaneous telemetry measurements (8), and we determined that a training week was not required for this system (Figure S1; please see http://hyper.ahajournals.org). All measurements were taken in the afternoon, and values from up to 100 measurement cycles (20/day × 5 days) were used to calculate average SBP and standard deviations (SD) for each mouse. Any reading greater than two SD from the mean for an individual mouse was discarded and final averages and SD were re-calculated. Only mice having a final average SBP calculated from at least 40 cycles, out of 100 cycles maximum, were used for the QTL analyses.
Table 1.
Characteristics of Eight F2 Populations for Blood Pressure QTL Analysis
| Grandmaternal Strain | Grandpaternal Strain | n | # of Markers | SBP Diff* | P value† |
|---|---|---|---|---|---|
| 129S1/SvImJ (129) | A/J (A) | 336 | 91 | 7.0 | 0.010 |
| 129S1/SvImJ (l29) | DBA/2 (DBA) | 324 | 90 | 5.9 | 0.019 |
| AKR/J (AKR) | NZW/LacJ (NZW) | 334 | 94 | 14.3 | <0.001 |
| BTBR T+ tf (BTBR) | SWR/J (SWR) | 336 | 93 | 25.7 | <0.001 |
| C3H/HeJ (C3H) | KK/HIJ (KK) | 335 | 91 | 11.3 | <0.001 |
| FVB/NJ (FVB) | RIIIS/J (RIII) | 252 | 90 | 5.3 | 0.020 |
| PL/J (PL) | CBA/J (CBA) | 324 | 90 | 13.4 | <0.001 |
| SJL/J (SJL) | RIIIS/J (RIII) | 336 | 91 | 14.7 | 0.002 |
Strain abbreviations used throughout the manuscript are shown in parentheses.
Difference in systolic blood pressures between the strains (mm Hg).
P value for blood pressure difference between inbred strains.
Genotyping
DNA was isolated by phenol:chloroform extraction from the tail of each F2 mouse and genotyped by KBiosciences (Herts, UK) with approximately 90 single nucleotide polymorphism (SNP) markers evenly spaced across the genome (9). This number of SNP markers provides similar power to detect and resolve QTL as an infinite number of markers (10).
QTL analyses
To minimize the influence of extreme phenotype values on the QTL analyses, SBP values were converted to van der Waerden's normal scores within each cross (11). A three-step analysis (12) was used to identify QTL linked to blood pressure. QTL mapping was performed in R/qtl (13). Because the SNP markers used for genotyping are mapped to physical positions in the genome, cM positions were approximated by dividing Mb positions by two for genetic mapping; we confirmed the validity of this approximation by comparison to the estimated cM positions based on the genotype data from each cross. Main effect QTL were identified by calculating logarithm of the odds (LOD) scores at 2 cM intervals across the genome and compared to genome-wide adjusted significance (P<0.05) thresholds calculated by permutation testing (12;14). Confidence intervals were determined as 95% of the area under of the posterior probability density curves. QTL from each cross were fit to a multiple regression model to assess their effects on blood pressure. Ultimately, all QTL were mapped to the physical mouse genome map.
Statistics
Tukey's Honestly Significant Differences test was used to test the significance of unplanned, pair-wise comparisons among the 37 inbred strains. Values for groups sorted by genotype are presented as mean ± SE and were compared by ANOVA followed by Bonferroni post-test using SigmaStat. P<0.05 was considered significant.
RESULTS
Survey of Systolic Blood Pressure in Inbred Mice
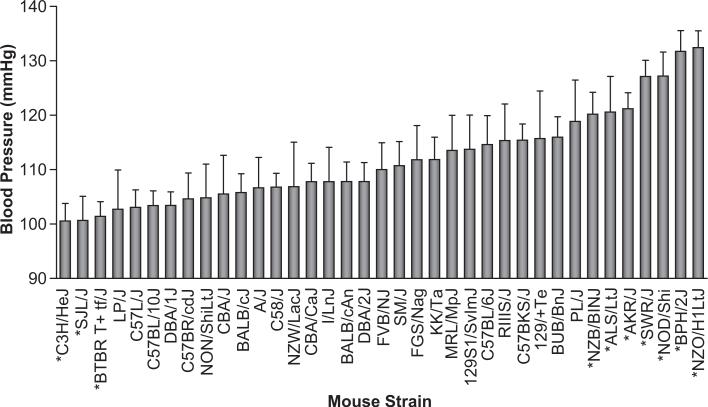
To evaluate SBP among inbred mice and identify strains useful for QTL analysis, we measured SBP in mice from 37 different inbred strains. The strain survey data, with individual values, is publicly available in the Mouse Phenome Database (http://www.jax.org/phenome). We found a wide variation in SBP between mice from different inbred strains, from C3H mice with SBP around 100 mmHg to NZO mice with SBP greater than 130 mmHg (Figure 1; please see Table S1, http://hyper.ahajournals.org).
Figure 1. Systolic blood pressures in mice from 37 inbred strains.
Strains marked with the same letter were intercrossed to produce F2 populations for linkage analysis. Bars represent tail-cuff blood pressures for mice from each strain given as mean ± SD. Strains marked with an asterisk are significantly different (P < 0.05 by Tukey's Honestly Significantly Differences test) from the median strain (i.e., FVB). Please see Table S1 (http://hyper.ahajournals.org) for a summary of all significant differences between the strains.
QTL Analyses of Systolic Blood Pressure in F2 Populations
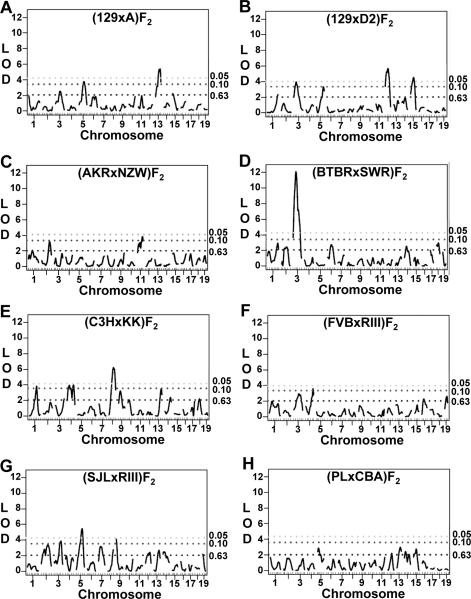
Based on the strain survey data and genetic diversity between inbred mouse strains, we chose mice from 12 inbred strains to generate eight F2 populations for QTL analyses. While none of the strains are considered hypertensive (SBP > 140mmHg), SBP was significantly different between each of the strain pairs used to generate the F2 populations (Table 1) and each F2 population displayed a wide blood pressure distribution (Figure S2; please see http://hyper.ahajournals.org). We performed QTL analysis on these eight F2 populations and detected significant, main effect QTL in all but one of the populations (Figures 2A-2H); the (PLxCBA)F2 population did not identify any QTL significantly linked to SBP. From the 7 analyses, 14 regions of the mouse genome were linked to SBP on 10 different Chrs (peak locations, confidence intervals, allele effects, LOD scores, and modes of inheritance are summarized in Table 2).
Figure 2. Genome-wide scans for blood pressure quantitative trait loci (QTL) in eight intercross populations.
Suggestive (P < 0.10) and significant (P < 0.05) logarithm of the odds ratios (LOD) scores, as determined by permutation testing, are shown as dotted lines.
Table 2.
Summary of Significant, Main-effect QTL Linked to Systolic Blood Pressure
| Chr | QTL Name | Cross | Peak (cM) | 95% CI (cM) | 95% CI (Mb) | LOD | High Allele | BP Effect (mmHg)* | Mode of Inheritance | Human QTL |
|---|---|---|---|---|---|---|---|---|---|---|
| 1 | Bpq24 | C3HxKK | 66.2 | 52.6 - 80.6 | 106.4 - 161.8 | 3.85 | ? | 3.3 | Over-Dom | 1q31, 2q34 |
| 3 | Bpq16 | 129xD2 | 21.8 | 3.8 - 40.6 | 7.5 - 80.5 | 3.96 | D2 | 9.4 | Rec | 3q24-26, 4q31 |
| Bpq20 | BTBRxSWR | 27.8 | 19.6 - 43.6 | 39.4 - 86.5 | 12.10 | SWR | 17.1 | Add | 3q24-26, 4q31 | |
| Bpq28 | SJLxRIIIS | 61.8 | 43.6 - 76.1 | 86.5 - 151.6 | 3.88 | RIII | 7.9 | Rec | 1p13 | |
| 4 | Bpq25 | C3HxKK | 57.6 | 3.6 - 69.1 | 7.7 - 139.8 | 3.98 | C3H | 9.0 | Dom | 1p33-34, 6q14 |
| Bpq27 | FVBxRIIIS | 65.2 | 44.5 - 69.1 | 90.9 - 139.8 | 3.59 | RIII | 7.6 | Rec | 1p33-34 | |
| 5 | Bpq14 | 129xA | 42.5 | 22.5 - 67.4 | 46.4 - 136.5 | 3.77 | A | 10.0 | Dom | 4p |
| Bpq29 | SJLxRIIIS | 54.2 | 40.1 - 73.5 | 88.7 - 148.3 | 5.46 | RIII | 11.3 | Dom | 4p | |
| 8 | Bpq26 | C3HxKK | 42.6 | 31.0 - 62.5 | 65.7 - 128.0 | 6.22 | KK | 12.9 | Add | 4q32, 16q12, 19p13 |
| 9 | Bpq30 | SJLxRIIIS | 6.7 | 6.7 - 18.9 | 13.2 - 37.4 | 4.13 | RIII | 11.2 | Add | 11q24, 19p13 |
| 11 | Bpq19 | AKRxNZW | 46.1 | 6.1 - 51.5 | 12.2 - 102.0 | 3.82 | AKR | 7.8 | Rec | 2p14, 5q34, 17p13 |
| 12 | Bpq17 | 129xD2 | 30.1 | 8.1 - 52.1 | 16.2 - 110.4 | 5.69 | 129 | 10.7 | Add | - |
| 13 | Bpq15 | 129xA | 44.9 | 23.9 - 51.0 | 48.2 - 105.6 | 5.39 | 129 | 12.7 | Rec | 5q33, 5q13 |
| 15 | Bpq18 | 129xD2 | 28.6 | 4.6 - 48.7 | 9.0 - 96.4 | 4.53 | 129 | 10.6 | Dom | 5p14, 8q24 |
QTL, quantitative trait locus; Chr, chromosome; CI, confidence interval; cM, centimorgan; Mb, megabase; LOD, logarithm of the odds ratio; BP, blood pressure; Rec, recessive; Add, additive; Dom, dominant.
BP effect is the maximum blood pressure difference between the three genotypes at the QTL
Chromosome 1
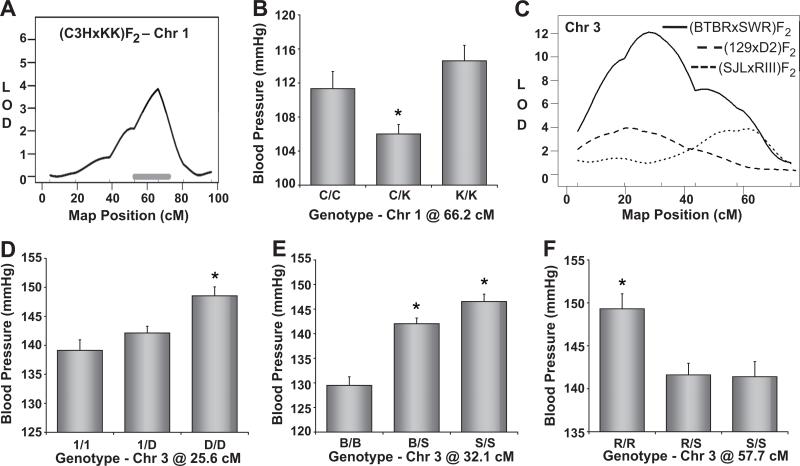
We detected a significant QTL on Chr 1 affecting SBP in the (C3HxKK)F2 population (Figure 3A). Mice that inherited either two C3H or KK alleles at this locus had significantly higher blood pressure than heterozygous mice, indicating an over-dominant pattern of inheritance (Figure 3B).
Figure 3. Mapping of blood pressure quantitative trait loci (QTL) on Chromosomes 1 and 3.
Mapping plot (A) and allelic effect plot (B) for the Chr 1 QTL in the (C3HxKK)F2 population. The solid, horizontal gray bar represents the Bayesian confidence interval. C. Mapping plots for the Chr 3 QTL detected in the (BTBRxSWR)F2, (129xD2)F2, and (SJLxRIII)F2 populations. The corresponding allelic effect plots of tail-cuff blood pressure are shown in panels D-F. Blood pressure values are expressed as means ± SEM.
*P < 0.05 vs all other genotypes.
Chromosome 3
Chr 3 was significantly linked to SBP in three of the F2 populations tested and the mapping plots suggest the presence of two blood pressure QTL on this chromosome (Figure 3C). Proximal Chr 3 was linked to SBP in the (129xD2)F2 and (BTBRxSWR)F2 populations. Whereas D2 mice contributed a recessive high blood pressure allele on Chr 3 (Figure 3D), SWR mice contributed an additive high blood pressure allele at this locus (Figure 3E). The confidence intervals for these QTL were proximal to 45 cM, but Chr 3 distal to 45 cM was linked to SBP in the (SJLxRIII)F2 population (Figure 3C). Mice that inherited two RIII alleles on distal Chr 3 showed significantly higher blood pressure values than those that inherited one or two SJL alleles (Figure 3F). The mapping plot of Chr 3 for the (BTBRxSWR)F2 cross indicated that Chr 3 distal to 45 cM may also be linked to SBP in this population (Figure 3C).
Chromosome 4
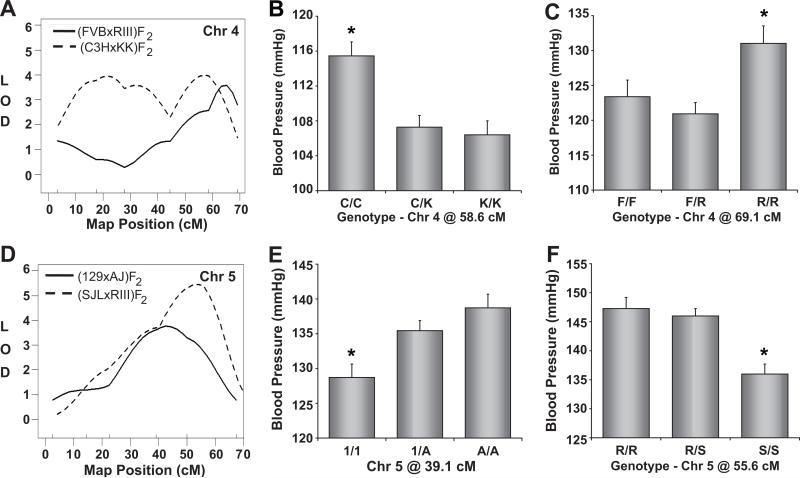
The (C3HxKK)F2 population identified a significant QTL affecting SBP that spanned Chr 4 (Figure 4A). C3H mice contributed a recessive high blood pressure allele at this QTL (Figure 4B). Distal Chr 4 (~45 – 60 cM) was also linked to SBP in the (FVBxRIII)F2 population, where a recessive high blood pressure allele was inherited from RIII mice (Figure 4C). The (C3HxKK)F2 mapping plot and distal Chr 4 QTL in the (FVBxRIII)F2 population suggest the presence of multiple blood pressure QTL on Chr 4.
Figure 4. Mapping of blood pressure quantitative trait loci (QTL) on Chromosomes 4 and 5.
Mapping plots for individual QTL are shown on the left and the corresponding allelic effect plots of tail-cuff blood pressure are shown on the right. The solid, horizontal gray bars in the mapping plots represent Bayesian confidence intervals. Blood pressure values are expressed as means ± SEM.
*P < 0.05 vs all other genotypes.
Chromosome 5
Chr 5 was significantly linked to SBP in both the (129xA)F2 and (SJLxRIII)F2 crosses (Figure 4D). 129 and SJL contributed recessive high blood pressure alleles in their respective populations (Figures 4E and 4F).
Chromosome 8
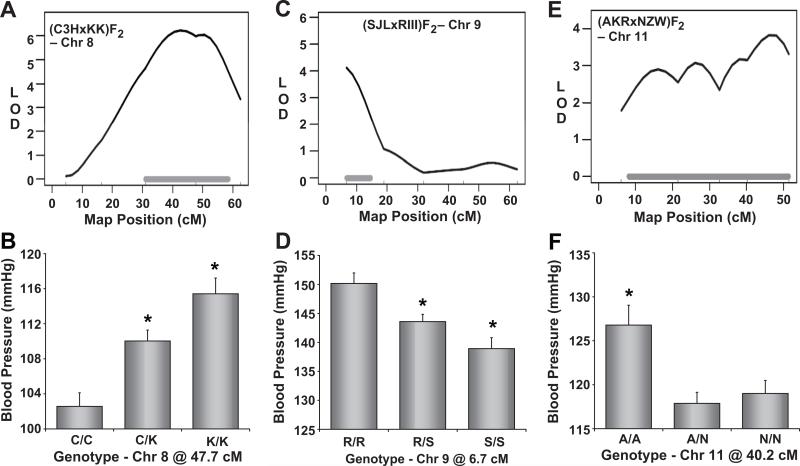
Distal Chr 8 contained a significant QTL underlying SBP in the (C3HxKK)F2 intercross (Figure 5A). At this locus, KK mice contributed an additive high blood pressure allele (Figure 5B).
Figure 5. Mapping of blood pressure quantitative trait loci (QTL) on Chromosomes 8, 9, and 11.
Mapping plots for individual QTL are shown on the left and the corresponding allelic effect plots of tail-cuff blood pressure are shown on the right. The solid, horizontal gray bars in the mapping plots represent Bayesian confidence intervals. Blood pressure values are expressed as means ± SEM.
*P < 0.05 vs all other genotypes.
Chromosome 9
A narrow interval of proximal Chr 9 was significantly linked to SBP in the (SJLxRIII)F2 population (Figure 5C). SJL mice contributed an additive low blood pressure allele at this locus (Figure 5D).
Chromosome 11
The Chr 11 mapping plot for the (AKRxNZW)F2 population shows a broad SBP QTL spanning from 6 to ~52 cM (Figure 5E). At this locus, AKR mice contributed a recessive high blood pressure allele (Figure 5F).
Chromosome 12
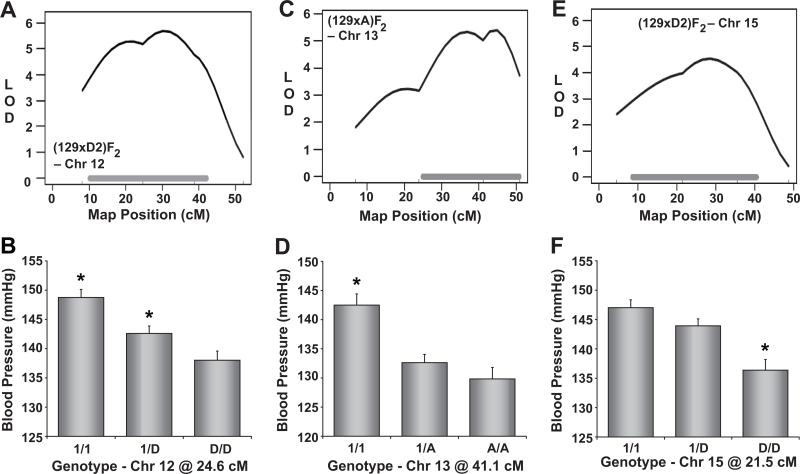
The middle of Chr 12 was significantly linked to SBP in the (129xD2)F2 population (Figure 6A), where 129 mice contributed an additive high blood pressure allele (Figure 6B).
Figure 6. Mapping of blood pressure quantitative trait loci (QTL) on Chromosomes 12, 13, and 15.
Mapping plots for individual QTL are shown on the left and the corresponding allelic effect plots of tail-cuff blood pressure are shown on the right. The solid, horizontal gray bars in the mapping plots represent Bayesian confidence intervals. Blood pressure values are expressed as means ± SEM.
*P < 0.05 vs all other genotypes.
Chromosome 13
Distal Chr 13 contained a significant SBP QTL in the (129xA)F2 intercross (Figure 6C). F2 mice that inherited two 129 alleles at this locus displayed significantly higher SBP than heterozygotes or A homozygotes (Figure 6D), indicating a recessive, 129 high blood pressure allele at this QTL.
Chromosome 15
The final SBP QTL detected in our analyses of 8 mouse intercross popualtions was on Chr 15 (Figure 6E). In the (129xD2)F2 population, this QTL was inherited as a recessive high blood pressure allele from D2 mice (Figure 6F).
DISCUSSION
Considering the limitations of available methods for blood-pressure measurement in mice, we chose to use tail-cuff manometry because QTL analyses require high-throughput blood-pressure phenotyping. We previously validated the accuracy of the CODA-6 tail-cuff system for measuring SBP by comparison to simultaneous radiotelemetry blood pressure measurements (8). Blood pressure can be greatly affected by environmental conditions and measurement technique; despite substantial environmental and methodological differences, results from the strain survey performed at the University of Tsukuba enabled us to produce seven effective mapping populations at Novartis. Within our QTL analyses, we carefully controlled time of measurement (afternoon only), ambient conditions (i.e. temperature and noise), and operator handling to limit measurement variability. To further reduce variability, we conducted five daily measurement sessions of 20 measurements each and calculated the average blood pressure from up to 100 discrete measurements selected to exclude outliers more than two SD from the initial mean. We believe that this experimental strategy provides an accurate measurement of blood pressure in each mouse, and this approach has been used previously for QTL analyses of blood pressure in mice (2;7;15).
In this study, we conducted QTL analyses of eight intercrosses generated with mice from 14 inbred strains. Although none of the fourteen inbred mouse strains used is considered hypertensive, each strain pair used to produce an F2 population had a significant difference in SBP (Table 1), and even strain pairs without significantly different SBP can be used to identify significant QTL affecting blood pressure. For example, Sugiyama et al. (15) identified significant, main-effect blood pressure QTL in a (BALBxCBA)F2 intercross. BALB and CBA each contributed one high blood pressure allele at the main-effect loci (15), which could account for the significant blood pressure QTL in the F2 population despite no difference in blood pressure between these inbred mice. In our crosses, we detected significant QTL in F2 populations generated from inbred mice with SBP differences as low as 5.3 mmHg. Overall, the number of QTL detected was not proportional to the phenotypic difference between the parental strains. Strain pairs with large SBP differences (BTBR vs SWR, 25.7 mmHg; PL vs CBA, 13.4 mmHg) produced F2 populations that identified only one significant QTL between them, whereas the (129xD2)F2 population identified three significant QTL despite the small SBP difference (5.9 mmHg) between the parental strains.
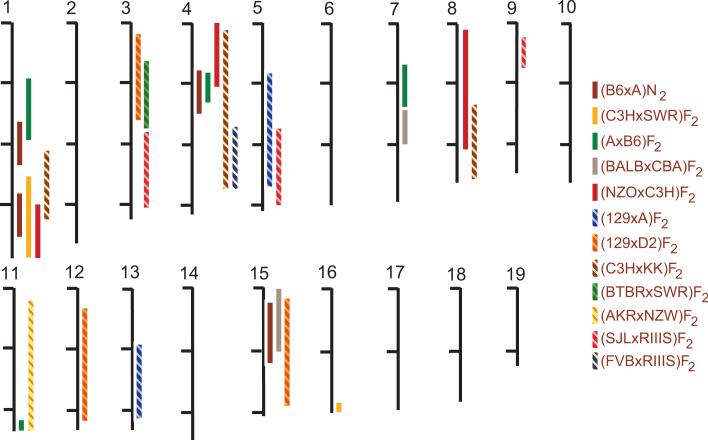
Some of the QTL identified in our intercrosses replicate blood pressure QTL previously detected in other mouse crosses (Figure 7). For example, we identified a significant QTL on Chr 15 in the (129xD2)F2 intercross that overlaps a QTL found previously in crosses between CBA and BALB mice (15), A and B6 mice (2), and BPH and BPL mice (16). The concordant regions of the rat and human genomes have also been linked to blood pressure (17-19). Other previously reported blood pressure QTL on distal Chr 1 (2;7;20), proximal Chr 4 (2;20;21), and Chr 8 (20) were replicated in our studies. In addition to these previously identified QTL, we also identified many novel blood pressure QTL in the eight intercross populations (Figure 7). Proximal Chr 3 was linked to SBP in (129xD2)F2 and (BTBRxSWR)F2 populations, whereas distal Chr 3 was linked in the (SJLxRIIIS)F2 population. Distal Chrs 4 and 5 also contained novel QTL detected in multiple crosses, whereas Chrs 12 and 13 were each linked to SBP in a single intercross population.
Figure 7. Summary of mouse blood pressure quantitative trait loci (QTL).
Solid bars represent blood pressure QTL intervals from published studies. Hatched bars indicate blood pressure QTL identified in the present study. Chromosomes are segmented in 50 Mb intervals indicated by horizontal tick marks.
Moreno et al. found that kidney weight to body weight ratio can serve as an intermediate phenotype for blood pressure QTL, based on correlation between the phenotypes and QTL concordance (22). However, only one blood pressure QTL corresponded to a kidney weight QTL in the same cross (Table S2; please see http://hyper.ahajournals.org), suggesting that kidney weight is not an intermediate phenotype for blood pressure QTL in mice.
Blood pressure QTL identified in both mice and rats are often concordant with human blood pressure QTL (2;3). The regions of the human genome corresponding to all but one of the QTL identified in the intercross populations that we analyzed contained blood pressure QTL (Table 2; see Cowley (1) for review of human hypertension QTL). This high degree of concordance between mouse and human blood pressure QTL suggests evolutionary conservation of genes affecting blood pressure.
PERSPECTIVES
The eight mouse populations examined in our study doubles the number of populations used for linkage analysis of blood pressure. The majority of QTL detected in our study have been replicated, either within these eight intercross populations or in published studies; however, several QTL were detected in only one cross, suggesting that future crosses may detect additional new blood pressure QTL. New QTL crosses investigating the genetic basis of blood pressure may also replicate these QTL and provide more information for interval-specific haplotype analysis (23). Future studies to fine map these QTL and identify the causal genes could elucidate novel pathways affecting blood pressure in both mice and humans.
Supplementary Material
Footnotes
FUNDING SOURCES: This work was supported by the Novartis Institutes for BioMedical Research.
DISCLOSURES: none
Publisher's Disclaimer: This is a PDF file of an unedited manuscript that has been accepted for publication. As a service to our customers we are providing this early version of the manuscript. The manuscript will undergo copyediting, typesetting, and review of the resulting proof before it is published in its final citable form. Please note that during the production process errors may be discovered which could affect the content, and all legal disclaimers that apply to the journal pertain.
REFERENCES
- 1.Cowley AW. The genetic dissection of essential hypertension. Nature Reviews Genetics. 2006;7:829–840. doi: 10.1038/nrg1967. [DOI] [PubMed] [Google Scholar]
- 2.Sugiyama F, Churchill GA, Higgins DC, Johns C, Makaritsis KP, Gavras H, Paigen B. Concordance of murine quantitative trait loci for salt-induced hypertension with rat and human loci. Genomics. 2001;71:70–77. doi: 10.1006/geno.2000.6401. [DOI] [PubMed] [Google Scholar]
- 3.Stoll M, Kwitek-Black AE, Cowley AW, Harris EL, Harrap SB, Krieger JE, Printz MP, Provoost AP, Sassard J, Jacob HJ. New target regions for human hypertension via comparative genomics. Genome Res. 2000;10:473–482. doi: 10.1101/gr.10.4.473. [DOI] [PMC free article] [PubMed] [Google Scholar]
- 4.Manunta P, Bianchi G. Pharmacogenomics and pharmacogenetics of hypertension: Update and perspectives - The adducin paradigm. J Am Soc Nephrol. 2006;17:S30–S35. doi: 10.1681/ASN.2005121346. [DOI] [PubMed] [Google Scholar]
- 5.Pravenec M, Kurtz TW. Molecular genetics of experimental hypertension and the metabolic syndrome - From gene pathways to new therapies. Hypertension. 2007;49:941–952. doi: 10.1161/HYPERTENSIONAHA.107.086900. [DOI] [PubMed] [Google Scholar]
- 6.Chang YPC, Liu X, Kim JDO, Ikeda MA, Layton MR, Weder AB, Cooper RS, Kardia SLR, Rao DC, Hunt SC, Luke A, Boerwinkle E, Chakravarti A. Multiple genes for essential-hypertension susceptibility on chromosome 1q. Am J Hum Genet. 2007;80:253–264. doi: 10.1086/510918. [DOI] [PMC free article] [PubMed] [Google Scholar]
- 7.DiPetrillo K, Tsaih SW, Sheehan S, Johns C, Kelmenson P, Gavras H, Churchill GA, Paigen B. Genetic analysis of blood pressure in C3H/HeJ and SWR/J mice. Physiological Genomics. 2004;17:215–220. doi: 10.1152/physiolgenomics.00212.2003. [DOI] [PubMed] [Google Scholar]
- 8.Feng MJ, Whitesall S, Zhang YY, Beibel M, D'Alecy L, DiPetrillo K. Validation of Volume-Pressure Recording Tail-Cuff Blood Pressure Measurements. Am J Hypertens. 2008;21:1288–1291. doi: 10.1038/ajh.2008.301. [DOI] [PubMed] [Google Scholar]
- 9.Petkov PM, Cassell MA, Sargent EE, Donnelly CJ, Robinson P, Crew V, Asquith S, Haar RV, Wiles MV. Development of a SNP genotyping panel for genetic monitoring of the laboratory mouse. Genomics. 2004;83:902–911. doi: 10.1016/j.ygeno.2003.11.007. [DOI] [PubMed] [Google Scholar]
- 10.Darvasi A, Weinreb A, Minke V, Weller JI, Soller M. Detecting Marker-Qtl Linkage and Estimating Qtl Gene Effect and Map Location Using A Saturated Genetic-Map. Genetics. 1993;134:943–951. doi: 10.1093/genetics/134.3.943. [DOI] [PMC free article] [PubMed] [Google Scholar]
- 11.Lehmannm EL, D'Abrera HJM. Nonparametrics: Statistical Methods Based on Ranks. McGraw-Hill; 1988. [Google Scholar]
- 12.Sen S, Churchill GA. A statistical framework for quantitative trait mapping. Genetics. 2001;159:371–387. doi: 10.1093/genetics/159.1.371. [DOI] [PMC free article] [PubMed] [Google Scholar]
- 13.Broman KW, Wu H, Sen S, Churchill GA. R/qtl: QTL mapping in experimental crosses. Bioinformatics. 2003;19:889–890. doi: 10.1093/bioinformatics/btg112. [DOI] [PubMed] [Google Scholar]
- 14.Churchill GA, Doerge RW. Empirical threshold values for quantitative trait mapping. Genetics. 1994;138:963–971. doi: 10.1093/genetics/138.3.963. [DOI] [PMC free article] [PubMed] [Google Scholar]
- 15.Sugiyama F, Churchill GA, Li R, Libby LJ, Carver T, Yagami K, John SW, Paigen B. QTL associated with blood pressure, heart rate, and heart weight in CBA/CaJ and BALB/cJ mice. Physiological Genomics. 2002;10:5–12. doi: 10.1152/physiolgenomics.00002.2002. [DOI] [PubMed] [Google Scholar]
- 16.Wright FA, O'Connor DT, Robert E, Kutey G, Berry CC, Yoneda LU, Timberlake D, Schlager G. Genome scan for blood pressure loci in mice. Hypertension. 1999;34:625–630. doi: 10.1161/01.hyp.34.4.625. [DOI] [PubMed] [Google Scholar]
- 17.Garrett MR, Dene H, Walder R, Zhang QY, Cicila GT, Assadnia S, Deng AY, Rapp JP. Genome scan and congenic strains for blood pressure QTL using Dahl salt-sensitive rats. Genome Res. 1998;8:711–723. doi: 10.1101/gr.8.7.711. [DOI] [PubMed] [Google Scholar]
- 18.Rice T, Rankinen T, Province MA, Chagnon YC, Perusse L, Borecki IB, Bouchard C, Rao DC. Genome-wide linkage analysis of systolic and diastolic blood pressure: the Quebec Family Study. Circulation. 2000;102:1956–1963. doi: 10.1161/01.cir.102.16.1956. [DOI] [PubMed] [Google Scholar]
- 19.Atwood LD, Samollow PB, Hixson JE, Stern MP, MacCluer JW. Genome-wide linkage analysis of blood pressure in Mexican Americans. Genet Epidemiol. 2001;20:373–382. doi: 10.1002/gepi.7. [DOI] [PubMed] [Google Scholar]
- 20.Nishihara E, Tsaih SW, Tsukahara C, Langley S, Sheehan S, DiPetrillo K, Kunita S, Yagami K, Churchill GA, Paigen B, Sugiyama F. Quantitative trait loci associated with blood pressure of metabolic syndrome in the progeny of NZO/HILtJxC3H/HeJ intercrosses. Mamm Genome. 2007;18:573–583. doi: 10.1007/s00335-007-9033-5. [DOI] [PubMed] [Google Scholar]
- 21.Woo DD, Kurtz I. Mapping blood pressure loci in (A/J × B6)F2 mice. Physiol Genomics. 2003;15:236–242. doi: 10.1152/physiolgenomics.00027.2003. [DOI] [PubMed] [Google Scholar]
- 22.Moreno C, Dumas P, Kaldunski ML, Tonellato PJ, Greene AS, Roman RJ, Cheng Q, Wang Z, Jacob HJ, Cowley AW., Jr Genomic map of cardiovascular phenotypes of hypertension in female Dahl S rats. Physiol Genomics. 2003;15:243–257. doi: 10.1152/physiolgenomics.00105.2003. [DOI] [PubMed] [Google Scholar]
- 23.DiPetrillo K, Wang X, Stylianou IM, Paigen B. Bioinformatics toolbox for narrowing rodent quantitative trait loci. Trends Genet. 2005;21:683–692. doi: 10.1016/j.tig.2005.09.008. [DOI] [PubMed] [Google Scholar]
Associated Data
This section collects any data citations, data availability statements, or supplementary materials included in this article.


