

Abstract
Hypoxia is a key determinant of tissue pathology during tumor development and organ ischemia. However, little is known regarding hypoxic regulation of genes that are directly involved in cell death or death resistance. Here we report the striking induction by severe hypoxia of the anti-apoptotic protein IAP-2. Hypoxic cells with IAP-2 up-regulation became resistant to apoptosis. IAP-2 was induced by hypoxia per se rather than by the secondary effects of hypoxia, including ATP depletion and cell injury. The inductive response did not relate to alterations of cellular redox status or arrest of mitochondrial respiration. On the other hand, IAP-2 induction was attenuated by actinomycin D, suggesting a role for gene transcription. In vitro nuclear run-on assays demonstrated specific increases in IAP-2 transcriptional activity after hypoxia exposure. HIF-1, the primary transcription factor that is responsible for multiple gene activation under hypoxia, does not have a role in IAP-2 expression. HIF-1 and IAP-2 were induced by different degrees of hypoxia; severe hypoxia or anoxia was required for IAP-2 induction. Moreover, cobalt chloride and desferrioxamine activated HIF-1 but not IAP-2. Finally, IAP-2 was induced by severe hypoxia in mouse embryonic stem cells that were deficient of HIF-1. Thus, this study not only provides the first demonstration of hypoxic regulation of an anti-apoptotic gene but also suggests the participation of novel hypoxia-responsive transcription mechanisms.
Lack of oxygen, i.e. hypoxia, plays a fundamental role in many pathologic processes. In ischemic diseases, including stroke, myocardial infarction, and acute renal failure, hypoxia leads to cell death and determines tissue pathology (1). In solid tumors, hypoxia selects death-resistant cells, which confer poor prognosis and contribute to cancer progression (2–4). Under hypoxia, some cells are irreversibly injured and die whereas others can adapt to the stressful environment and survive. The factors that determine the fate of individual cells under hypoxia are poorly understood. However, expression of specific genes within these cells appears to be a key (5).
In response to hypoxia, mammalian cells express a variety of gene products, including erythropoietin, vascular endothelial growth factor, glucose transporter, and glycolytic enzymes (5, 6). These proteins either increase oxygen delivery or enhance glycolysis to facilitate metabolic adaptation. In 1992, the critical transcription factor HIF-1,1 which is responsible for hypoxic activation of multiple genes, was identified (7). HIF-1 is a heterodimeric basic helix-loop-helix-per-aryl hydrocarbon receptor ARNT-sim (PAS) domain protein, consisting of α and β subunits (8). Although HIF-1β is constitutively expressed, HIF-1α is precisely regulated by cellular oxygen levels. Under hypoxia, HIF-1α is induced, dimerizes with β subunits, translocates to the nucleus, and initiates gene transcription (6). Originally identified by its regulation of erythropoietin, HIF-1 has now been shown to play a central role in hypoxic expression of a variety of genes and is considered to be a master transcription factor that governs adaptive gene expression under situations of oxygen deficiency (5, 9, 10).
Despite intense investigation of gene expression under hypoxia, little has been learned about hypoxic regulation of genes that are directly involved in cell death or death resistance (5). In the current study, we show that the cell death inhibitory protein IAP-2 is strikingly induced by severe hypoxia. IAP-2 is a member of the family of inhibitors of apoptosis (IAPs), which were originally discovered in baculoviruses and subsequently cloned from metazoans, including human (11–18). In baculovirus, IAPs halt the death of host cells and thereby preserve the microenvironment for virus proliferation (11, 12). In Drosophila, loss of function of IAPs leads to inappropriate cell deletion during development (19). In mammals, high levels of IAP expression are shown in neoplasia (20, 21), and genetic defects of neural IAPs are associated with the neurodegenerative disorder spinal muscular atrophy (15). These studies suggest a pivotal role for IAPs in maintenance of tissue homeostasis and protection against deleterious insults. Our results show that hypoxic cells overexpress IAP-2 and become resistant to apoptosis. IAP-2 up-regulation under hypoxia does not result from ATP depletion, cellular redox status alteration, or respiration arrest; rather, the key to the inductive response is lack of oxygen per se. IAP-2 induction involves gene transcription; however, HIF-1, the primary hypoxia-responsive transcription factor, is shown to be not involved. Thus, the results not only demonstrate the striking induction of an anti-apoptotic gene by hypoxia but also imply novel hypoxia-responsive transactivation mechanisms.
MATERIALS AND METHODS
Cells
Rat kidney proximal tubule cells (RPTC) were provided by U. Hopfer (Case Western Reserve University, Cleveland, OH). RPTC over-expressing Bcl-2 were obtained by stable transfection of a vector containing bcl-2 cDNA (22). The bcl-2 vector was a gift from J. Yuan (Massachusetts General Hospital, Boston, MA). Wild type and HIF-1α null mouse embryonic stem cells were generated as described previously (23). Primary cultures of human umbilical vein endothelial cells were kindly provided by N. Pinckard (University of Texas Health Science Center, San Antonio, TX). Other cells used in this study were purchased from ATCC. The cells were maintained following standard procedures.
Reagents
The monoclonal antibody to Bax was a gift from R. Youle (NINDS, National Institutes of Health, Bethesda, MD). The monoclonal antibody to HIF-1α was purchased from Novus Biologicals, Inc. (Littleton, CO). Polyclonal antibodies to Bcl-2, IAP-1, IAP-2, and XIAP were obtained from Santa Cruz Biotechnology Inc. (Santa Cruz, CA). We prepared two polyclonal IAP-2 antibodies recognizing different epitopes to verify the identity of IAP-2. VAD was from Enzyme Systems Products (Dublin, CA). Ebselen, MnTBAP, rotenone, antimycin A, myxothiazole, oligomycin, and carbonyl cyanide-m-chlorophenyl hydrazone (CCCP) were purchased from Calbiochem-Novabiochem Co. (San Diego, CA). Radioactive chemicals were purchased from PerkinElmer Life Sciences (Boston, MA). Other reagents were from Sigma Chemical Co. (St. Louis, MO).
Hypoxic Incubation
An in vitro model of hypoxia-reoxygenation has been described previously (22, 24) and was adopted in this study. Briefly, cells were washed with phosphate-buffered saline, transferred to an anaerobic chamber with 95% N2/5% CO2, and incubated in Krebs-Ringer bicarbonate buffer. This buffer was pre-equilibrated with 95% N2/5% CO2. EC Oxyrase, a biocatalytic oxygen-reducing agent, was added at 1.2 unit/ml to the incubation medium to consume residual O2 and maximize the degree of hypoxia. For reoxygenation, cells after hypoxic incubation were transferred back to full culture medium in 95% air/5% CO2.
Immunoblot Analysis
Cells were lysed with a buffer containing 2% SDS, 100 mM DTT, and 62.5 mM Tris-HCl (pH 6.8). Proteins (100 μg/lane) in whole-cell lysates were subjected to reducing SDS-polyacryl-amide (4–12%) gel electrophoresis. The resolved proteins were then electroblotted onto a polyvinylidene difluoride membrane. After 1 h of blocking in 2% bovine serum albumin, the membrane was incubated overnight with primary antibodies at 4 °C. By the next morning, the membrane was thoroughly washed and incubated with horseradish peroxidase-conjugated secondary antibodies. Antigens on the membranes were finally revealed by exposure to chemiluminescent substrates (Pierce, Rockford, IL).
Northern Hybridization
Total RNA was extracted from control or experimental cells with TRI reagent (Molecular Research Center, Cincinnati, OH). mRNA was subsequently purified with poly(A)Tract (Promega, Madison, MI). Northern hybridization was carried out with a NorthernMax kit purchased from Ambion (Austin, TX), following the manufacturer’s instruction. Briefly, mRNA (2 μg/lane) was electrophoresed on formaldehyde-containing agarose gels. Resolved mRNA was transferred to BrightStar-Plus positively charged nylon membranes by downward capillary transfer and cross-linked to the membranes using a UV cross-linker. Hybridization was carried out at 42 °C, using an iap-2-specific probe. The probe was generated by reverse transcription-polymerase chain reaction, using primers designed on the basis of the cDNA sequences of rat IAP-2,2 and was 32P-labeled with the Ready-To-Go random labeling beads (Amersham Pharmacia Biotech Inc., Piscataway, NJ). To assess variation in loading and transfer of RNA, the blots were stripped and reprobed with 32P-labeled glyceral-dehyde-3-phosphate dehydrogenase cDNA. Levels of gene-specific mRNA was revealed by autoradiography.
In Vitro Nuclear Run-on Analysis of Transcriptional Activity
Nuclei from control and experimental cells were isolated by a method modified from Spector et al. (25). Briefly, cells were collected by scraping and centrifuging at 500 g/5 min and lysed by 0.5% Nonidet P-40 in the homogenization buffer containing (in mM): 340 sucrose, 60 KCl, 15 NaCl, 2 EDTA, 0.5 EGTA, 1 DTT, 0.1 phenylmethylsulfonyl fluoride, 0.15 spermine, 0.5 spermidine, and 15 Tris-HCl, pH 7.5. Nuclei in cell lysates were purified by centrifugation at 800 g/5 min through a 25% glycerol cushion. Purified nuclei were resuspended in the nuclear storage buffer containing 40% glycerol, and kept frozen in liquid nitrogen. During isolation, nuclear morphology was monitored by phase contrast microscopy. For run-on reaction, ~75 × 106 nuclei were incubated for 30 min at 30 °C in the reaction buffer containing (in mM): 150 KCl, 5 MgCl2, 2.5 DTT, 30 Tris-HCl, pH 8.0, 0.5 ATP, 0.5 CTP, 0.5 GTP, 100 μCi of [α-32P]UTP, and 20% glycerol. RNase inhibitor at 20 units/reaction was included to prevent RNA degradation. The reaction was terminated by adding DNase I and proteinase K. RNA was extracted with TRI reagent LS (Molecular Research Center, Cincinnati, OH). Nascent 32P-uridine-labeled RNA species were hybridized to an excess of IAP-2 cDNA or β-actin cDNA (2 μg) that had been immobilized on Zeta-Probe GT membranes by a Bio-Dot SF Microfiltration apparatus (Bio-Rad, Hercules, CA). After 36 h of hybridization at 65 °C, blots were washed and subjected to autoradiography. Quantitation of the signal was performed by densitometry.
Analysis of Apoptosis
Apoptosis was assessed by cell morphology and caspase activity (22, 24). Typical morphological alterations used to characterize apoptosis included cellular shrinkage, nuclear condensation and fragmentation, and formation of apoptotic bodies (22). Five fields with ~200 cells/field in each 35-mm dish were monitored. The experiments were repeated for five times with duplicate dishes for each condition in every experiment. To biochemically analyze apoptosis, caspase activity was measured using the fluorogenic peptide substrate, carbobenzoxy-Asp-Glu-Val-Asp-7-amino-4-trifluoromethyl coumarin (DEVD.AFC) as described in our previous studies (24). Briefly, cells were extracted with 1% Triton X-100. The lysates (25 μg of protein) were added to the enzymatic reactions containing 50 μM DEVD.AFC. After 60 min of reaction at 37 °C, fluorescence was monitored at excitation 360 nm/emission 530 nm. For each measurement, a standard curve was constructed using free AFC. Based on the standard curve, the fluorescence reading from the enzymatic reactions was translated into the molar amount of liberated AFC to indicate caspase activity (24).
Chemical Analyses
Protein was quantitated with the bicinchoninic acid reagent purchased from Pierce Chemical Co., Rockford, IL. The concentration and purity of RNA were determined spectrophotometrically by absorbance readings at 260 and 280 nm. To measure ATP, cells were extracted with trichloroacetic acid. ATP in cell extracts was determined by luminometry of the luciferin firefly luciferase reaction using a kit purchased from Sigma Chemical Co. (22).
RESULTS
IAP-2 Induction by Hypoxia
We initially screened the expression of apoptosis regulatory genes by immunoblotting. For this purpose, RPTC cells were subjected to hypoxic incubation alone or hypoxia followed by reoxygenation. Whole cell lysates were extracted with a buffer containing 2% SDS and analyzed by immunoblotting. The results are shown in Fig. 1. No significant changes were detected in the expression of the anti-apoptotic protein Bcl-2 or its homologue, the pro-apoptotic protein Bax. Consistent with our previous observations, Bcl-2 was barely detectable in control cells and remained low throughout hypoxia and reoxygenation (Fig. 1A, lanes 1–7), whereas abundant Bcl-2 was shown in cells stably transfected with a bcl-2 vector (Fig. 1A, lane 8). Cellular levels of Bax were also stable (Fig. 1A), despite its translocation from cytosol to mitochondria during hypoxia (22). In sharp contrast, IAP-2, an apoptosis inhibitory protein was markedly induced by hypoxia. As shown in Fig. 1A, basal IAP-2 expression in control cells was quite limited (lane 1), whereas abundant IAP-2 was detected after hypoxic incubation (lanes 2–4). IAP-2 induction reached a maximum during 1 h of hypoxia exposure and, of interest, returned toward basal levels after reoxygenation (Fig. 1A, lane 5). The identity of IAP-2 was verified using three antibodies recognizing different epitopes (data not shown). The antibodies were prepared separately by Santa Cruz Biotechnology Inc. and by our laboratory.
Fig. 1. IAP-2 induction by hypoxia.
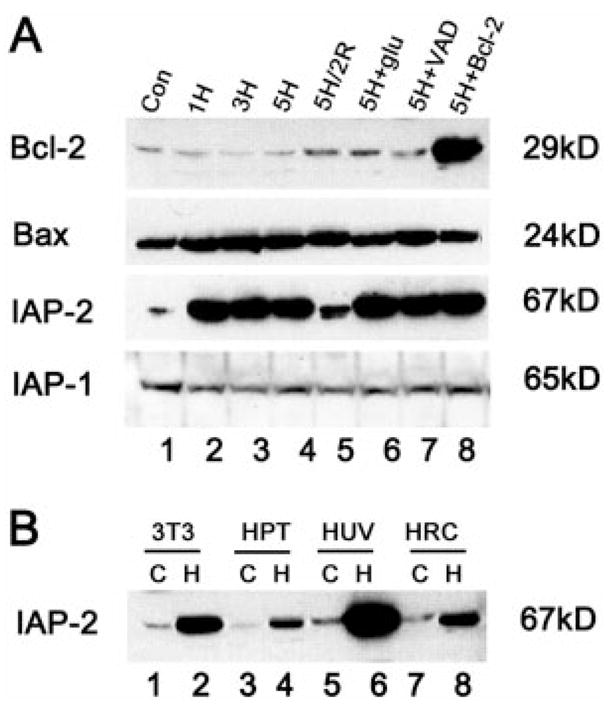
A, expression of apoptotic genes in RPTC cells. RPTC (Con: control) were subjected to 1, 3, or 5 h of hypoxic incubation (1H, 3H, 5H), or 5 h of hypoxia followed by 2 h of reoxygenation (5H/2R). 5H+Glu: 1 mg/ml glucose was provided during 5 h of hypoxia. 5H+VAD: 100 μM VAD was provided during 5 h of hypoxia. 5H+Bcl-2: 5 h of hypoxia was performed on cells overexpressing Bcl-2. Proteins in whole cell lysates (100 μg/lane) were analyzed for the expression of Bcl-2, Bax, IAP-2, or IAP-1 by immunoblotting. IAP-2 was shown to be markedly and specifically induced by hypoxia. Data not shown in this figure indicate that IAP-2 expression in control cells with normal O2 is not affected by glucose, VAD, or Bcl-2 transfection. B, induction of IAP-2 by hypoxia in various types of cells. 3T3 fibroblast cells (3T3), human kidney proximal tubule cells (HPT), human umbilical vein endothelial cells (HUV), and human renal carcinoma cells (HRC) were subjected to one hour of hypoxia. Proteins in whole cell lysates (100 μg/lane) were examined by immunoblot analysis. C, control; H, hypoxia.
The inductive response was rather specific for IAP-2, because no induction was detected in IAP-1 (Fig. 1A) or XIAP (data not shown). Hypoxic induction of IAP-2 was not suppressed by glucose, a glycolytic substrate that prevented declines of ATP in hypoxic cells, negating the involvement of ATP depletion in the inductive response (Fig. 1A, lane 6, Glu). Moreover, neither the caspase inhibitor VAD (carbobenzoxy-Val-Ala-Asp-flu-oromethyl ketone) nor Bcl-2 overexpression affected IAP-2 induction (Fig. 1A, lanes 7, 8). The results indicate that IAP-2 expression was not a result of cell injury/death, because VAD and Bcl-2 abolished apoptosis during hypoxia reoxygenation (22, 24).
Hypoxic expression of IAP-2 is not cell-type-specific, and was detected in 3T3 fibroblasts, human kidney proximal tubular epithelial cells and primary cultures of human umbilical vein endothelial cells (Fig. 1B, “C ” for control; “H ” for hypoxia). Similar induction was also shown for malignant human renal carcinoma cells (Fig. 1B, lanes 7, 8, HRC).
Oxygen Deficiency, Not ATP Depletion, Leads to IAP-2 Expression
Under hypoxia, cells are exposed to two kinds of immediate stress, i.e. lack of oxygen and declines of cellular ATP. Many pathologic processes are initiated during hypoxia by ATP depletion rather than by oxygen deprivation per se (1). Thus, to investigate the mechanisms responsible for IAP-2 induction, we first determined whether it is a result of ATP depletion. In our experimental model of hypoxia, progressive decreases of cellular ATP were demonstrated. After 5 h of hypoxic incubation in the absence of metabolic substrates, cell ATP declined to less than 1% of control. Provision of 1 mg/ml glucose, the glycolytic substrate, maintained cellular ATP to a substantial level, ~70% of control (22). The fact that glucose given during hypoxia did not mitigate IAP-2 expression (Fig. 1A, lane 6, Glu) suggests that the induction was not caused by ATP depletion. To substantiate this observation, we examined the effects of stepwise ATP declines. Cells were incubated under normal oxygen atmosphere in a medium containing the mitochondrial uncoupler CCCP, which abolishes ATP production by oxidative phosphorylation (26). Glucose, the glycolytic substrate, was provided at 0–0.5 mg/ml along with CCCP to achieve graded degrees of ATP depletion (Fig. 2A). As a positive control, one group of cells was subjected to 1 h of hypoxic incubation and showed striking IAP-2 induction (Fig. 2B, lane 2). In sharp contrast, IAP-2 expression remained minimal in cells incubated with CCCP in the presence of various amounts of glucose (Fig. 2B, lanes 3–10). Thus, ATP depletion, either severe or mild, did not activate this anti-apoptotic gene. The data imply that, independent of ATP depletion, oxygen deficiency plays a critical role in hypoxic induction of IAP-2.
Fig. 2. IAP-2 is induced by hypoxia per se and not by declines of cell ATP.
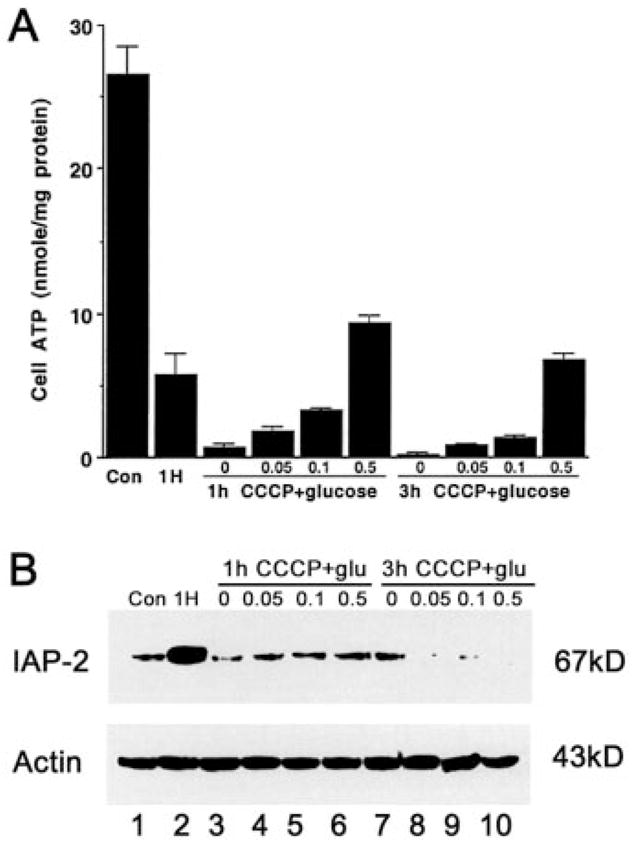
A, stepwise ATP depletion induced by CCCP ± glucose. RPTC were incubated for 1 or 3 h under normal oxygen tension (21% O2) with the mitochondrial inhibitor CCCP and 0–0.5 mg/ml glucose. Cellular ATP was measured by luminometry of the luciferin-firefly luciferase reaction. Results are means ± S.E. (n = 4). B, neither severe nor mild ATP depletion leads to IAP-2 expression. Cells (Con: control) were exposed to 1 h of hypoxia (1H), or 1–3 h of 15 μM CCCP with 0–0.5 mg/ml glucose. Proteins in whole cell lysates (100 μg/lane) were analyzed for IAP-2 by immunoblotting. To control sample loading and transfer, the blot was stripped and reprobed for β-actin.
Hypoxic Expression of IAP-2 Does Not Depend on Changes of Cellular Redox Status
Cellular redox status has been shown to affect gene expression under conditions of oxygen deficiency (27–30). To test whether it played an essential role in IAP-2 induction under hypoxia, we adjusted the redox status of the cells pharmacologically, using two classes of reagents. The first class of chemicals tested were antioxidant, including the ROS scavenger N-acetyl-cysteine (NAC), the cell permeant superoxide dismutase mimetic MnTBAP, and the glutathione peroxidase mimic Ebselen (31). The second class of chemicals tested included H2O2 and t-butylhydroperoxide (t-BHP), which by their nature should augment cellular oxidative status. The results are shown in Fig. 3. It is clear that, despite manipulation of cellular redox status, neither the anti-oxidants nor the pro-oxidants could induce IAP-2 expression (lanes 3–7) under normal oxygen tensions. On the contrary, this anti-apoptotic gene was activated by hypoxia in a remarkable manner (lane 2). Data not shown have also demonstrated that the anti-oxidant NAC was not able to ameliorate IAP-2 expression during hypoxia. Collectively, the results suggest that alterations of cellular redox status do not have a critical role in IAP-2 induction under hypoxia.
Fig. 3. Alterations of cellular redox status do not result in IAP-2 expression.

RPTC cells (Con: control) were exposed for 3 h to hypoxia (hypoxia), or to various chemicals that were able to modify cellular redox status. Concentrations of the chemicals used in this experiment were 10 mM NAC, 100 μM MnTBAP, 100 μM Ebselen, 5 mM H2O2, 1 mM and 5 mM t-BHP. Proteins in whole cell lysates (100 μg/lane) were analyzed for IAP-2 by immunoblotting. To control sample loading and transfer, the blot was stripped and reprobed for β-actin.
Mitochondrial Inhibition Does Not Lead to Apoptotic Gene Expression
We subsequently examined whether hypoxia up-regulated IAP-2 through its actions on the mitochondrial function. Electron transport in mitochondria is disrupted in cells under situations of oxygen deficiency. This is due to the lack of the terminal electron acceptor, molecular oxygen. Moreover, as depicted in Fig. 4A, hypoxia and its secondary effects, including ATP depletion can also damage the machinery responsible for respiration and oxidative phosphorylation (32). Key components of the respiratory chain have been postulated as the O2 sensors that signal gene expression in hypoxic cells (5, 33–35). To investigate the roles played by respiratory macromolecules in apoptotic gene expression, we examined the effects of respiration inhibitors. The rationale for this experiment was that, if hypoxic expression of IAP-2 was triggered by defects in electron transport, then a somewhat similar inductive response should be elicited by poisons targeting the key components of the respiratory chain. The inhibitors tested included the complex I inhibitor rotenone, complex III inhibitors antimycin and myxothiazole, complex IV inhibitor sodium azide, and potassium cyanide. Efficacy of the inhibitors to block respiration in RPTC cells was indicated by their ability to prevent mitochondrial ATP production (data not shown). In addition, we examined the effects of oligomycin, an F0-and F1-ATPase/synthase inhibitor, on IAP-2 expression. The results are shown in Fig. 4B. Clearly, none of the mitochondrial poisons could mimic hypoxia, with respect to inducing IAP-2. The data suggest that hypoxic expression of this anti-apoptotic gene does not result from respiration defects.
Fig. 4. Mitochondrial inhibition does not induce IAP-2.

A, schematic of the respiratory chain and the sites targeted by hypoxia and mitochondrial inhibitors. B, induction of IAP-2 by hypoxia and not by mitochondrial inhibition. RPTC (Con: control) were exposed for 3 h to hypoxia, or to mitochondrial inhibitors (10 μg/ml rotenone, 10 μM antimycin, 10 μ myxothiazole, 1 mM azide, 5 mM cyanide, or 10 μM oligomycin) in the presence of 1 mg/ml glucose. Proteins in whole cell lysates (100 μg/lane) were analyzed for IAP-2 by immunoblotting. To control sample loading and transfer, the blot was stripped and reprobed for β-actin.
Transcriptional Mechanisms Are Involved in IAP-2 Expression under Hypoxia
Our results presented so far have demonstrated hypoxic induction of IAP-2 at the protein level by immunoblotting. Accumulation of a protein could be the result of increased transcription, mRNA stabilization, or decreased protein turnover. To examine the role of transcription in IAP-2 expression, we initially tested the effects of actinomycin D (Act.D), a DNA-primed RNA polymerase inhibitor that blocks transcription. Cells were pretreated with Act.D for 1 h and then shifted to hypoxic incubation. The results are shown in Fig. 5A. Consistent with our previous observations, IAP-2 was barely detectable in control cells and was markedly induced after hypoxia exposure (lanes 1, 2). Of significance, the inductive response was suppressed by 10–100 μg/ml Act.D (lanes 5–8), suggesting a role for transcription. This observation was further supported by Northern analysis of mRNA, using 32P-labeled rat IAP-2-specific probes. As shown in Fig. 5B, Northern hybridization detected an IAP-2 transcript of ~3.5 kb. Sizes of the transcript agreed well with the full-length cDNA of rat IAP-2 that we have cloned.2 Moreover, expression of IAP-2 mRNA was significantly increased during hypoxia (Fig. 5B, lanes 2–4); this increase was again suppressed by the transcription inhibitor, Act.D (Fig. B, lane 5). Together, the results suggest that gene transcription plays an important role in IAP-2 induction under hypoxia.
Fig. 5. Actinomycin D suppresses IAP-2 expression under hypoxia.
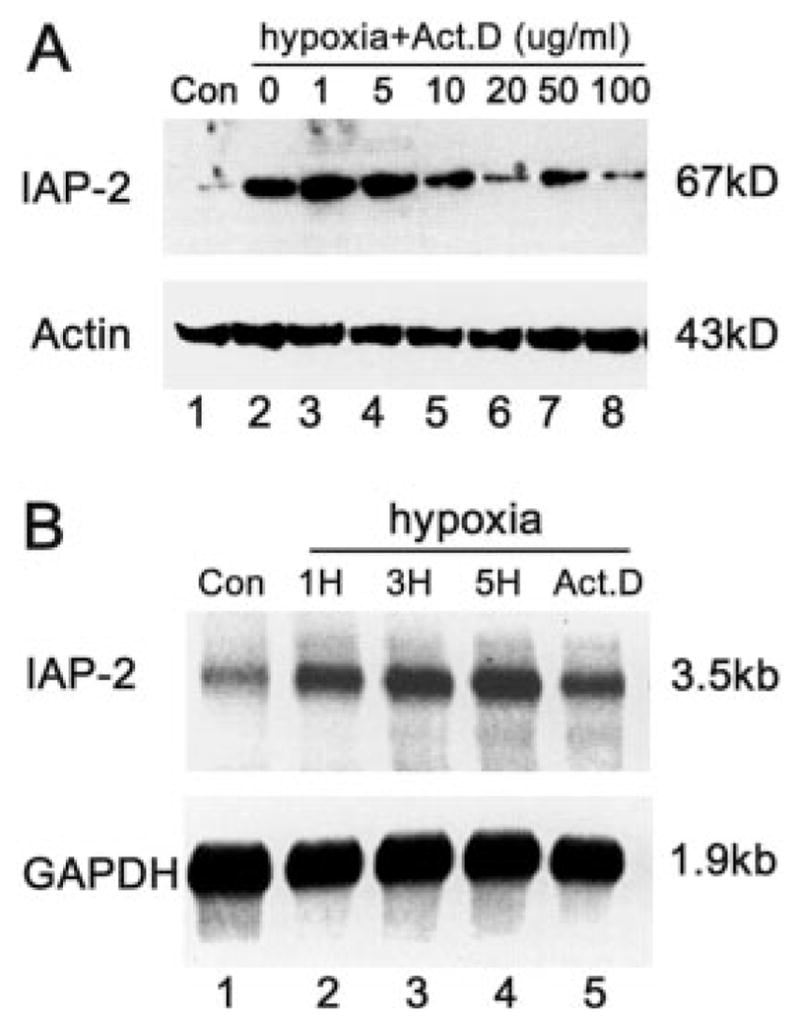
A, immunoblots. RPTC cells (Con: control) were preincubated for 1 h with 0–100 μg/ml actinomycin D, and subsequently transferred to hypoxia for 3 h. Proteins in whole cell lysates were analyzed for IAP-2 and β-actin by immunoblotting. B, Northern blots. RPTC cells (Con: control) were subjected to 1, 3, or 5 h of hypoxia (1H, 3H, 5H), or 5 h of hypoxia in the presence of 20 μg/ml actinomycin D (Act.D). Total RNA was extracted, and mRNA was purified and analyzed (2 μg/lane) for IAP-2 transcripts by Northern hybridization as described under “Materials and Methods.” To control sample loading and transfer, the blot was stripped and reprobed for glyceraldehyde-3-phosphate dehydrogenase mRNA. The results show that Act.D at 10–100 μg/ml suppressed IAP-2 expression under hypoxia.
Cellular Transcriptional Activity for IAP-2 Is Increased during Hypoxia: in Vitro Nuclear Run-on Assays
To further establish a role for transcription in IAP-2 induction, we measured the cellular transcriptional activity for this anti-apoptotic gene directly by in vitro nuclear run-on assays. Nuclei were isolated from control and hypoxic cells, and used for run-on reactions in the presence of [α-32P]UTP. Nascent 32P-labeled RNA species were extracted and hybridized to rat IAP-2 cDNA. Blots of a typical nuclear run-on experiment are shown in Fig. 6A, and the densitometric result is summarized in Fig. 6B. Exposure of cells to hypoxia led to significant increases in nuclear transcriptional activity for IAP-2. After 1 h of hypoxia, the IAP-2 transcriptional activity was 4.2-fold over control (Fig. 6B). Of interest, when hypoxia was prolonged, nuclear transcriptional activity for the anti-apoptotic gene decreased toward basal levels. Thus, at the end of 3 h of hypoxia, the IAP-2 transcriptional activity was ~3-fold over control (Fig. 6B). As an internal control, the nuclear transcription activity for β-actin remained largely unchanged or slightly decreased during 1–3 h of hypoxia exposure, indicating the specificity of IAP-2 gene trans-activation. These results, along with the inhibitory effects of actinomycin D (Fig. 5), demonstrate an important role for transcription in IAP-2 gene activation under severe hypoxia.
Fig. 6. Increase of nuclear transcriptional activity for IAP-2 after hypoxia exposure.
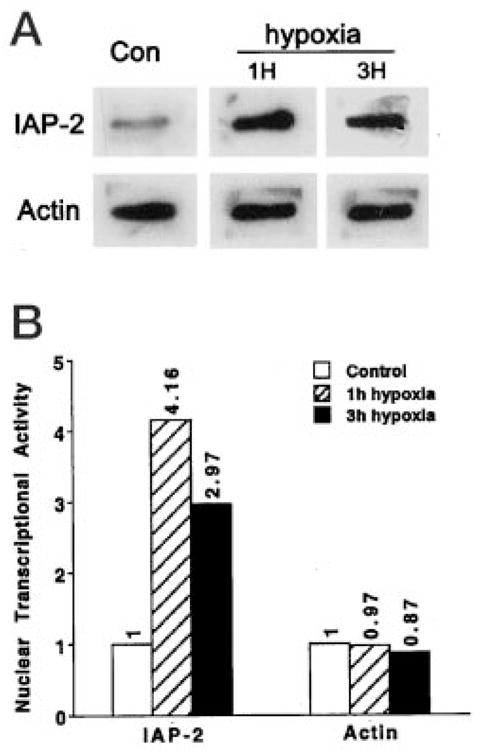
RPTC cells (Con: control) were subjected to 1 or 3 h of hypoxic incubation (1H, 3H). Nuclei were isolated for in vitro nuclear run-on transcription in the presence of [α-32P]UTP. RNA was subsequently extracted and hybridized to membranes containing pGEM-T-easy empty vector or pGEM-T-easy-IAP-2 cDNA. To control variations in nuclear run-on reactions and RNA extraction, the RNA samples were rehybridized to a membrane containing β-actin cDNA. A, representative blots from a nuclear run-on experiment. No specific binding was detected for blots immobilized with pGEM-T-easy empty vector (not shown). B, densitometric results summarized from three separate experiments. Intensity of control signals was arbitrarily set as 1, and the relative intensity of hypoxia samples was calculated. The results demonstrate specific increases in nuclear transcriptional activity for IAP-2 after hypoxia exposure.
HIF-1 Does Not Have an Essential Role in IAP-2 Induction under Hypoxia
To pursue the transcriptional mechanisms underlying IAP-2 expression, we initially examined the role of HIF-1, a ubiquitous transcription factor that is responsible for hypoxic activation of several classes of genes (5). HIF-1 is a heterodimer, consisting of α and β subunits. Although HIF-1β is constitutively expressed, HIF-1α is induced by hypoxia (maximal induction at 0.5–2% O2) and determines DNA binding and transcriptional activity (6). Thus, we first examined HIF-1α expression under the experimental conditions that activate apoptotic genes: near zero levels of O2. As shown in Fig. 7A, after 1 or 5 h of severe hypoxia, increases of HIF-1α were only modest (lanes 2, 3). On the contrary, IAP-2 was markedly induced. To further investigate the role of HIF-1, we analyzed IAP-2 expression in cells with up-regulated HIF-1. Cobalt chloride (CoCl2) and desferrioxamine (DFO) are two pharmacological inducers of HIF-1. Exposure of cells to CoCl2 or DFO has been shown to trigger HIF-1α expression, increases of DNA binding activity, and trans-activation of genes containing HIF-1 binding sites (36, 37). Consistent with these observations, HIF-1α was induced in RPTC cells by CoCl2 or DFO under normal oxygen tensions (Fig. 7A, lanes 4–9). Nevertheless, IAP-2 expression in these cells remained minimal, negating a role for HIF-1 in regulation of this anti-apoptotic gene. The results were further supported by our observation that HIF-1α, but not IAP-2, was dramatically induced by 2% O2 exposure (Fig. 7B, lanes 3–5). Thus, activation of HIF-1α and IAP-2 are triggered by different degrees of hypoxia; severe hypoxia or anoxia is required for IAP-2 induction. Finally, conclusive evidence to exclude the role of HIF-1 was obtained using HIF-1α-deficient cells (Fig. 7C). HIF-1α−/− mouse embryonic stem cells have been generated and characterized recently (23). Expression of HIF-1α in wild type but not in mutant cells was confirmed by immunoblot analysis (data not shown (23)). Both types of cells were subjected to control or hypoxia incubation, and whole cell lysates were analyzed for IAP-2. As shown in Fig. 7C, severe hypoxia induced IAP-2, in HIF-1α+/+ as well as HIF-1α−/− cells, indicating that not HIF-1 but other transcription factors are responsible for the inductive response. Together, the results do not support a role for HIF-1 in hypoxic expression of IAP-2; instead, novel transcriptional mechanisms that are responsive to severe hypoxia or anoxia may be involved.
Fig. 7. Dissociation of IAP-2 induction under hypoxia from HIF-1.
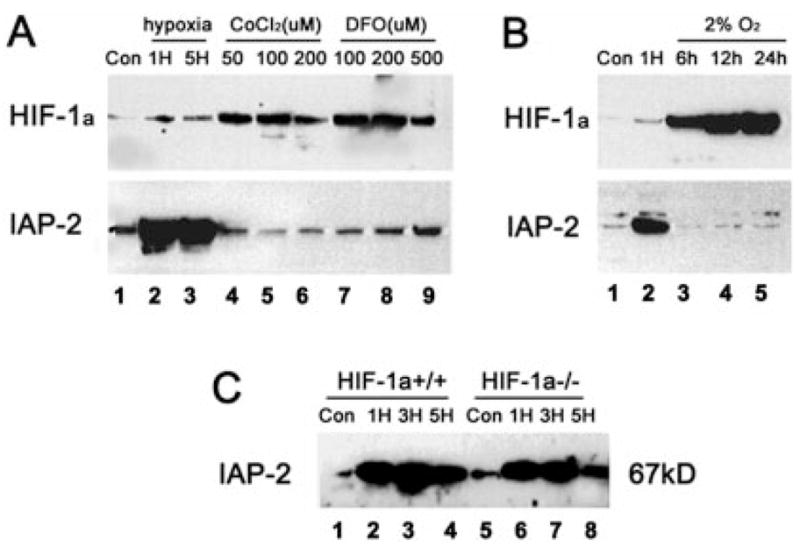
A, induction of HIF-1 but not IAP-2 by cobalt chloride (CoCl2) and desferrioxamine (DFO). RPTC cells (Con: control) were subjected to 1 or 5 h of hypoxia (1H, 5H), or incubated under normal oxygen tensions with 50–200 μM CoCl2 or 100–500 μM DFO. Proteins in whole cell lysates were analyzed for HIF-1 and IAP-2 by immunoblotting. Severe hypoxia induced strong expression of IAP-2 but not HIF-1; on the other hand, CoCl2 and DFO induced HIF-1 but not IAP-2. B, induction of HIF-1 and IAP-2 by different degrees of hypoxia. RPTC cells (Con: control) were subjected to 1 h of severe hypoxia (near zero levels of oxygen) or 6–24 h of 2% oxygen incubation. Proteins in whole cell lysates were analyzed for HIF-1 and IAP-2 by immunoblotting. Although abundant HIF-1 was expressed under 2% oxygen, induction of IAP-2 was only detected under severe hypoxia/anoxia. C, IAP-2 induction by severe hypoxia in HIF-1-deficient cells. Wild type (HIF-1 α+/+) and mutant (HIF-1α−/−) mouse embryonic stem cells were subjected to 1, 3, or 5 h of severe hypoxia. Expression of IAP-2 was analyzed by immunoblotting. IAP-2 was induced by hypoxia in HIF-1α+/+ cells as well as in HIF-1α−/− cells.
Hypoxic Cells Overexpressing IAP-2 Are More Resistant to Apoptosis
Our results have demonstrated IAP-2 induction under severe hypoxia by HIF-1-independent mechanisms. An intriguing question arose: what is the biological meaning of this inductive response? Given the recognized role of IAP-2 as an apoptosis suppressor, we determined whether cells with IAP-2 up-regulation became more resistant to apoptotic insults. To this end, we compared apoptosis induced by staurosporine in control, hypoxic, post-hypoxic, azide-treated, and post-azide cells. Staurosporine (STA) was chosen as the apoptotic trigger, because this broad-spectrum protein kinase inhibitor potently induces apoptosis in various kinds of cells and has been widely used in apoptosis research (38–42). The results are shown in Fig. 8A. Control cells after 5 h of incubation in physiological buffer showed ~5% apoptosis (condition “a”). Four hours of STA treatment following 1 h of control incubation led to apoptosis in ~40% cells (condition “b”). STA-induced apoptosis was completely blocked by the general caspase inhibitor VAD (condition “c”). Neither 1 h of azide preincubation nor continuous presence of azide prevented STA-induced apoptosis (conditions “e ” and “d”). Of significance, STA-induced apoptosis was inhibited to ~11%, when the cells were incubated continuously under severe hypoxia (condition “f”). On the other hand, if the cells were first exposed to 1 h of hypoxia and then returned to normal oxygen for 4 h of STA treatment, apoptosis developed in 38% cells (condition “g”). The results show that hypoxic cells and not post-hypoxic cells were more resistant to apoptosis. To substantiate the morphological observations, we measured caspase activity using the fluorogenic peptide substrate DEVD.AFC (24). Again, significant inhibition of STA-triggered caspase activation was shown for continuous hypoxia (condition “f ”), whereas azide and prior hypoxia were without effect. We subsequently determined IAP-2 expression under these experimental conditions (Fig. 8B). It is clear that only cells exposed to continuous hypoxia expressed high levels of IAP-2 (lane 6, condition “f”). No IAP-2 induction was shown for azide (lanes 4, 5; conditions “d ” and “e”). Consistent with previous results (Fig. 1), reoxygenation led to decreases of IAP-2 expression in post-hypoxic cells to basal levels (lane 7; condition “g”). Taken together, these results have provided compelling evidence that hypoxic cells overexpressing IAP-2 are indeed more resistant to apoptosis.
Fig. 8. Hypoxic cells with IAP-2 up-regulation are more resistant to apoptosis.
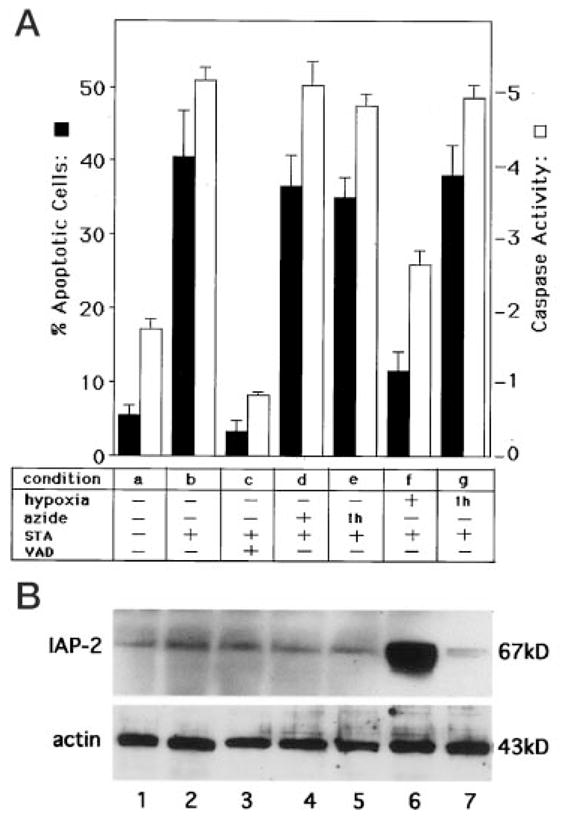
A, apoptosis and caspase activity. B, immunoblots of IAP-2 and actin. Experimental conditions were as follows. a, RPTC cells were incubated for 5 h in a physiological buffer. b, cells were first incubated for 1 h in a physiological buffer, then 1 μM staurosporine (STA) was added to incubate for another 4 h. c, cells were first incubated for 1 h in a physiological buffer, then 1 μM STA and 50 μM caspase inhibitor VAD were added to incubate for another 4 h. d, cells were first incubated for 1 h with 10 mM azide, then 1 μM STA was added to incubate for another 4 h. e, cells were first incubated for 1 h with 10 mM azide, then incubated with 1 μM STA in the absence of azide for another 4 h. f, cells were first incubated for 1 h under severe hypoxia, then 1 μM STA was added to incubate the cells under continuous hypoxia for another 4 h. g, cells were first incubated for 1 h under severe hypoxia, then returned to normal oxygen tension and incubated with 1 μM STA for another 4 h. Apoptotic cells with characteristic morphology were counted to assess the percentage of apoptosis, as described under “Materials and Methods.” Caspase activity was measured using the fluorogenic peptide substrate DEVD.AFC (24). The results in A are expressed as means ± S.E. (n = 5). Lanes 1–7 in B correspond, respectively, to conditions a–g of panel A. It is clear that hypoxic cells overexpressing IAP-2 are more resistant to apoptosis induced by staurosporine.
DISCUSSION
In response to hypoxia, mammalian cells activate and express multiple genes (5). Products of these genes can increase oxygen delivery in tissues via erythropoiesis (erythropoietin) and angiogenesis (vascular endothelial growth factor), facilitate metabolic adaptation via glycolysis (glycolytic enzymes and glucose transporters), and enhance cellular ability of survival (insulin-like growth factor 2) (6). Recent studies have documented hypoxic accumulation of p53, a potent trigger of apoptotic cell death (36, 43). Despite these important findings, hypoxic regulation of genes that are directly involved in cell death or death resistance remains largely unknown (5, 44). The current study has shown for the first time the hypoxic regulation of IAP-2, an anti-apoptotic gene. The regulation is specific for IAP-2, because neither Bcl-2/Bax nor IAP-1/XIAP was significantly induced in hypoxic cells. Moreover, the inductive response is unique for severe hypoxia or anoxia; mild or moderate decrease of oxygen tensions was not effective. On the other hand, up-regulation of IAP-2 by severe hypoxia appears to be a universal response, and has been detected in several cell types. IAP-2 induction does not result from secondary effects of hypoxia such as declines of cellular ATP, alterations of redox status, or mitochondrial inhibition. The key to the induction appears to be oxygen deficiency per se. Of significance, HIF-1, the primary transcription factor that mediates hypoxic activation of multiple genes, is not responsible for IAP-2 gene activation under severe hypoxia.
Strong evidence has been obtained to indicate that IAP-2 induction is not a result of cell injury. First, maximal IAP-2 expression was detected after 1 h of hypoxic incubation, a period during which cells remained viable and injurious processes, including cytochrome c translocation and caspase activation, had not yet occurred (22, 24). Second, the general caspase inhibitor VAD blocked caspase activation and progression of apoptosis but did not halt IAP-2 expression. Moreover, IAP-2 was induced by hypoxia in RPTC cells overexpressing Bcl-2, a powerful anti-death molecule that prevents injury and cell death in our experimental model of hypoxia reoxygenation (22). Finally, when glucose was provided during hypoxic incubation, cells generated ATP through anaerobic glycolysis. These cells were not injured by 1- to 5-h hypoxia and were able to recover fully after reoxygenation (data not shown). IAP-2 was induced in these cells as well. Collectively, these results have provided clear-cut evidence that IAP-2 up-regulation under hypoxia does not result from cell injury.
Despite its recognized role in gene regulation under hypoxia, IAP-2 induction appears to be independent of cellular redox status. The significance of cellular redox status in hypoxic gene expression has been suggested by recent studies (27–30). Based on these studies, two hypotheses have been formulated. One model proposes that the availability of molecular O2 determines the levels of reactive oxygen species (ROS) within cells. As such, less ROS is generated during hypoxic incubation. This allows the full expression of particular genes that are otherwise suppressed by ROS (30, 45). This model predicts that, with respect to gene regulation, inhibition of ROS production or scavenging of ROS would mimic the effects of hypoxia. Opposite to this model, Schumacker and his colleagues (10) have proposed that ROS generated by mitochondria signals gene expression under hypoxia. Their results show that cellular ROS production is increased under 1–5% O2 (46). Inhibition of ROS generation during hypoxia through either depletion of mitochondrial DNA or the use of scavengers is accompanied by suppression of hypoxic gene expression (27). Moreover, their recent studies have further demonstrated a role for ROS in stabilization of HIF-1 α, the primary hypoxia-responsive transcription factor (47). These two interesting and somewhat contradictory hypotheses prompted us to determine whether hypoxic expression of IAP-2 was dependent on cellular redox status. Our results show clearly that, despite manipulation of cellular redox status, neither the anti-oxidants nor the pro-oxidants could induce IAP-2 expression under normal oxygen tensions (Fig. 3). Moreover, inclusion of the anti-oxidant N-acetyl-cysteine during hypoxia was not able to ameliorate IAP-2 expression (data not shown). In addition, both respiration inhibitors and mitochondrial uncouplers failed to induce IAP-2 (Figs. 2 and 4), whereas these two classes of chemicals were expected to alter NADH/NAD+ ratio and, therefore, the redox status of the cells in the opposite directions. Together, these results suggest that changes of cellular redox status do not have an essential role in IAP-2 induction under hypoxia.
Our results have demonstrated a critical role for gene transcription in IAP-2 expression under severe hypoxia. IAP-2 was induced at the mRNA as well as the protein level. Both increases in mRNA and protein were suppressed by actinomycin D, the transcription inhibitor. In addition, in vitro nuclear run-on assays demonstrated marked increases in transcriptional activity for IAP-2 after hypoxia exposure. Thus, IAP-2 transcription is indeed activated by hypoxia. However, these results do not exclude potential IAP-2 regulation at post-transcriptional levels. As a matter of fact, actinomycin D could noticeably reduce but could not completely abolish IAP-2 expression under hypoxia (Fig. 5). Furthermore, the nuclear transcriptional activity for IAP-2 reached a maximal level at 1 h of hypoxia and declined thereafter (Fig. 6), whereas expression of IAP-2 mRNA as well as protein remained high during 3 or 5 h of hypoxic incubation (Figs. 1 and 5). The results suggest that transcription is responsible for the rapid phase of IAP-2 induction, whereas stabilization of mRNA and probably of protein may contribute to IAP-2 expression during prolonged hypoxia exposure. Post-transcriptional regulation of IAP-2 is also suggested by protein changes shown in our experiments. For example, incubation with mitochondrial inhibitors resulted in decreases of IAP-2 expression (Figs. 2 and 4). On the other hand, proteins cross-reactive with the IAP-2 antibody were detected in cells exposed to chemicals that modify cellular redox status (Fig. 3). The protein changes were apparently not due to variations of electrophoresis and immunoblotting, because similar amounts of actin were detected in each lane; rather, modifications that include proteolysis, degradation, cross-linking, phosphorylation, and dephosphorylation could be involved.
The critical factors responsible for IAP-2 up-regulation under hypoxia remain to be identified. Nevertheless, we have obtained compelling evidence against the involvement of HIF-1, a ubiquitous transcription factor that has been shown to mediate hypoxic activation of multiple genes. Our results show clearly that expression of IAP-2 and the activity of HIF-1 can be dissociated. These experiments focused on HIF-1α, because this subunit is the key component of HIF-1, expression of which determines the cellular HIF-1 activity. We first showed that, in our experimental model of severe hypoxia, IAP-2 was markedly induced, whereas expression of HIF-1α was modest. Subsequently, we found that, in cells where HIF-1 was activated pharmacologically by cobalt or desferrioxamine, IAP-2 expression was not enhanced. Moreover, our results demonstrated that HIF-1 and the IAP-2 gene were activated by different degrees of hypoxia. Although HIF-1 was strongly activated by 2% oxygen, activation of the IAP-2 gene required more severe hypoxia or anoxia. Finally, IAP-2 was induced by severe hypoxia in mouse embryonic stem cells that were devoid of HIF-1. Together, these results have provided conclusive evidence to exclude a role for HIF-1 in hypoxic activation of the apoptosis inhibitory gene IAP-2. In addition to HIF-1, several other related or unrelated transcription factors have been shown to participate in hypoxic gene activation (5, 6). For example, recent studies using transgenic mice have demonstrated an important role for egr-1 in gene regulation under situations of in vivo hypoxia or ischemia (48). However, regulation by these transcription factors appears to be gene- and cell-type-specific (49–51). Of note, an intriguing aspect of IAP-2 gene activation is the requirement of complete absence of oxygen or anoxia. Thus, many of the transcription factors that respond to mild or moderate hypoxia may not qualify as the key elements mediating IAP-2 induction. Ongoing studies in our laboratory include the analysis of IAP-2 gene promoter to identify the critical severe hypoxia/anoxia responsive elements.
A classical biological function of IAPs is to suppress cell death (52, 53). The first IAP genes were identified in baculovirus through their ability to substitute p35 in prevention of host cell apoptosis (11, 12). IAPs may antagonize cell death at multiple levels, and the critical targets include caspases, a family of cysteine proteases that mediate the disassembly of apoptotic cells (54–56). Thus, an apparent role played by the induced IAP-2 under severe hypoxia could be to protect cells from injury/death and facilitate cell survival in the highly stressful environment. We have compared the apoptotic sensitivity of cells incubated under normal oxygen and severe hypoxia. The results show clearly that hypoxic cells expressed high levels of IAP-2 and became more resistant to apoptosis (Fig. 8). Although apoptosis was specifically induced by staurosporine in this experiment, a general increase of apoptotic threshold would be expected for the hypoxic cells, because up-regulated IAP-2 in these cells would antagonize apoptosis at several levels, including caspases (54–56). In this context, IAP-2 induction can be considered as an important mechanism of cellular adaptation. Such adaptive response has been demonstrated for the neuronal-specific IAP under in vivo situations of severe hypoxia or ischemia (57). During forebrain ischemia, neuronal-specific IAP is induced in specific populations of cells that are injury/death resistant. In addition to cytoprotection, recent studies have documented at least two distinct functions for IAPs. Survivin, a unique baculovirus IAP repeat with a single BIR and no RING domains, localizes to the mitotic spindle microtubules and regulates cytokinesis (58). On the other hand, ubiquitin protein ligase activity has been shown for several IAPs, which requires the integrity of the RING domain and may determine proteasome-mediated degradation of IAPs as well as other key molecules involved in cell death or survival (59). Therefore, in addition to its cytoprotective potential, IAP-2 induced by severe hypoxia or anoxia may regulate other important biological processes as well.
Acknowledgments
We thank Drs. Junying Yuan (Massachusetts General Hospital, Boston, MA), Richard Youle (NINDS, National Institutes of Health, Bethesda, MD), Ulrich Hopfer (Case Western Reserve University, Cleveland, OH), and Neal Pinckard (University of Texas Health Science Center, San Antonio, TX) for providing plasmids, antibodies, and cells. The technical assistance of Qiu Zong in some of the experiments is highly appreciated.
Footnotes
The abbreviations used are: HIF-1, hypoxia-inducible factor-1; Act.D, actinomycin D; CCCP, carbonyl cyanide-m-chlorophenyl hydra-zone; DEVD. AFC, carbobenzoxy-Asp-Glu-Val-Asp-7-amino-4-triflu-oromethyl coumarin; IAP, inhibitor of apoptosis protein; NAC, N-acetyl-cysteine; ROS, reactive oxygen species; RPTC, rat kidney proximal tubule cells; STA, staurosporine; t-BHP, t-butylhydroperoxide; VAD, carbobenzoxy-Val-Ala-Asp-fluoromethyl ketone; DTT, dithiothreitol; kb, kilobase(s); DFO, desferrioxamine; MnTBAP, Mn(111) tetrakis (4-benzoic acid) porphyrin chloride; PAS, per-aryl hydrocarbon receptor ARNT-sim.
Z. Dong, J. Nishiyama, and M. A. Venkatachalam, unpublished data. The IAP-2 shown in this article is the rat homolog of human IAP-2, mouse IAP-2, and cellular IAP-1 (cIAP-1).
This work was supported by grants from the American Heart Association, the Texas Advanced Research Program, and the National Institutes of Health.
References
- 1.Cotran RS, Kumar V, Collins T. Robbins Pathologic Basis of Disease. In: Cotran RS, Kumar V, Collins T, editors. Cell Injury and Cellular Death. 6. W. B. Saunders Co; Philadelphia, PA: 1998. pp. 1–29. [Google Scholar]
- 2.Brown JM. Cancer Res. 1999;59:5863–5870. [PubMed] [Google Scholar]
- 3.Sutherland RM. Acta Oncol. 1998;37:567–574. doi: 10.1080/028418698430278. [DOI] [PubMed] [Google Scholar]
- 4.Semenza GL. Crit Rev Biochem Mol Biol. 2000;35:71–103. doi: 10.1080/10409230091169186. [DOI] [PubMed] [Google Scholar]
- 5.Bunn HF, Poyton RO. Physiol Rev. 1996;76:839–885. doi: 10.1152/physrev.1996.76.3.839. [DOI] [PubMed] [Google Scholar]
- 6.Semenza GL. Annu Rev Cell Dev Biol. 1999;15:551–578. doi: 10.1146/annurev.cellbio.15.1.551. [DOI] [PubMed] [Google Scholar]
- 7.Semenza GL, Wang GL. Mol Cell Biol. 1992;12:5447–5454. doi: 10.1128/mcb.12.12.5447. [DOI] [PMC free article] [PubMed] [Google Scholar]
- 8.Wang GL, Semenza GL. J Biol Chem. 1995;270:1230–1237. doi: 10.1074/jbc.270.3.1230. [DOI] [PubMed] [Google Scholar]
- 9.Semenza GL. J Appl Physiol. 2000;88:1474–1480. doi: 10.1152/jappl.2000.88.4.1474. [DOI] [PubMed] [Google Scholar]
- 10.Chandel NS, Schumacker PT. J Appl Physiol. 2000;88:1880–1889. doi: 10.1152/jappl.2000.88.5.1880. [DOI] [PubMed] [Google Scholar]
- 11.Crook NE, Clem RJ, Miller LK. J Virol. 1993;67:2168–2174. doi: 10.1128/jvi.67.4.2168-2174.1993. [DOI] [PMC free article] [PubMed] [Google Scholar]
- 12.Clem RJ, Miller LK. Mol Cell Biol. 1994;14:5212–5222. doi: 10.1128/mcb.14.8.5212. [DOI] [PMC free article] [PubMed] [Google Scholar]
- 13.Hay BA, Wassarman DA, Rubin GM. Cell. 1995;83:1253–1262. doi: 10.1016/0092-8674(95)90150-7. [DOI] [PubMed] [Google Scholar]
- 14.Rothe M, Pan MG, Henzel WJ, Ayres TM, Goeddel DV. Cell. 1995;83:1243–1252. doi: 10.1016/0092-8674(95)90149-3. [DOI] [PubMed] [Google Scholar]
- 15.Roy N, Mahadevan MS, McLean M, Shutler G, Yaraghi Z, Farahani R, Baird S, Besner-Johnston A, Lefebvre C, Kang X, et al. Cell. 1995;80:167–178. doi: 10.1016/0092-8674(95)90461-1. [DOI] [PubMed] [Google Scholar]
- 16.Duckett CS, Nava VE, Gedrich RW, Clem RJ, Van Dongen JL, Gilfillan MC, Shiels H, Hardwick JM, Thompson CB. EMBO J. 1996;15:2685–2694. [PMC free article] [PubMed] [Google Scholar]
- 17.Liston P, Roy N, Tamai K, Lefebvre C, Baird S, Cherton-Horvat G, Farahani R, McLean M, Ikeda JE, MacKenzie A, Korneluk RG. Nature. 1996;379:349–353. doi: 10.1038/379349a0. [DOI] [PubMed] [Google Scholar]
- 18.Uren AG, Pakusch M, Hawkins CJ, Puls KL, Vaux DL. Proc Natl Acad Sci U S A. 1996;93:4974–4978. doi: 10.1073/pnas.93.10.4974. [DOI] [PMC free article] [PubMed] [Google Scholar]
- 19.Wang SL, Hawkins CJ, Yoo SJ, Muller HA, Hay BA. Cell. 1999;98:453–463. doi: 10.1016/s0092-8674(00)81974-1. [DOI] [PubMed] [Google Scholar]
- 20.Ambrosini G, Adida C, Altieri DC. Nat Med. 1997;3:917–921. doi: 10.1038/nm0897-917. [DOI] [PubMed] [Google Scholar]
- 21.Vucic D, Stennicke HR, Pisabarro MT, Salvesen GS, Dixit VM. Curr Biol. 2000;10:1359–1366. doi: 10.1016/s0960-9822(00)00781-8. [DOI] [PubMed] [Google Scholar]
- 22.Saikumar P, Dong Z, Patel Y, Hall K, Hopfer U, Weinberg JM, Venkatachalam MA. Oncogene. 1998;17:3401–3415. doi: 10.1038/sj.onc.1202590. [DOI] [PubMed] [Google Scholar]
- 23.Iyer NV, Kotch LE, Agani F, Leung SW, Laughner E, Wenger RH, Gassmann M, Gearhart JD, Lawler AM, Yu AY, Semenza GL. Genes Dev. 1998;12:149–162. doi: 10.1101/gad.12.2.149. [DOI] [PMC free article] [PubMed] [Google Scholar]
- 24.Dong Z, Saikumar P, Patel Y, Weinberg JM, Venkatachalam MA. Biochem J. 2000;347:669–677. [PMC free article] [PubMed] [Google Scholar]
- 25.Spector DL, Goldman RD, Leinwand LA. Nuclear Run-on Analysis. Cold Spring Harbor Laboratory Press; Cold Spring Harbor, NY: 1998. Cells: A Laboratory Manual; pp. 25.4–25.15. [Google Scholar]
- 26.Dong Z, Patel Y, Saikumar P, Weinberg JM, Venkatachalam MA. Lab Invest. 1998;78:657–668. [PubMed] [Google Scholar]
- 27.Chandel NS, Maltepe E, Goldwasser E, Mathieu CE, Simon MC, Schumacker PT. Proc Natl Acad Sci U S A. 1998;95:11715–11720. doi: 10.1073/pnas.95.20.11715. [DOI] [PMC free article] [PubMed] [Google Scholar]
- 28.Ehleben W, Bolling B, Merten E, Porwol T, Strohmaier AR, Acker H. Respir Physiol. 1998;114:25–36. doi: 10.1016/s0034-5687(98)00078-4. [DOI] [PubMed] [Google Scholar]
- 29.Morel Y, Barouki R. Biochem J. 1999;342:481–496. [PMC free article] [PubMed] [Google Scholar]
- 30.Neumcke I, Schneider B, Fandrey J, Pagel H. Endocrinology. 1999;140:641–645. doi: 10.1210/endo.140.2.6529. [DOI] [PubMed] [Google Scholar]
- 31.Saikumar P, Dong Z, Weinberg JM, Venkatachalam MA. Oncogene. 1998;17:3341–3349. doi: 10.1038/sj.onc.1202579. [DOI] [PubMed] [Google Scholar]
- 32.Piper HM, Noll T, Siegmund B. Cardiovasc Res. 1994;28:1–15. doi: 10.1093/cvr/28.1.1. [DOI] [PubMed] [Google Scholar]
- 33.Acker H. Ann N Y Acad Sci. 1994;718:3–10. doi: 10.1111/j.1749-6632.1994.tb55698.x. [DOI] [PubMed] [Google Scholar]
- 34.Chandel NS, Budinger GR, Choe SH, Schumacker PT. J Biol Chem. 1997;272:18808–18816. doi: 10.1074/jbc.272.30.18808. [DOI] [PubMed] [Google Scholar]
- 35.Semenza GL. Cell. 1999;98:281–284. doi: 10.1016/s0092-8674(00)81957-1. [DOI] [PubMed] [Google Scholar]
- 36.An WG, Kanekal M, Simon MC, Maltepe E, Blagosklonny MV, Neckers LM. Nature. 1998;392:405–408. doi: 10.1038/32925. [DOI] [PubMed] [Google Scholar]
- 37.Jiang BH, Zheng JZ, Leung SW, Roe R, Semenza GL. J Biol Chem. 1997;272:19253–19260. doi: 10.1074/jbc.272.31.19253. [DOI] [PubMed] [Google Scholar]
- 38.Yang J, Liu X, Bhalla K, Kim CN, Ibrado AM, Cai J, Peng TI, Jones DP, Wang X. Science. 1997;275:1129–1132. doi: 10.1126/science.275.5303.1129. [DOI] [PubMed] [Google Scholar]
- 39.Bossy-Wetzel E, Newmeyer DD, Green DR. EMBO J. 1998;17:37–49. doi: 10.1093/emboj/17.1.37. [DOI] [PMC free article] [PubMed] [Google Scholar]
- 40.Samali A, Cai J, Zhivotovsky B, Jones DP, Orrenius S. EMBO J. 1999;18:2040–2048. doi: 10.1093/emboj/18.8.2040. [DOI] [PMC free article] [PubMed] [Google Scholar]
- 41.Nakagawa T, Zhu H, Morishima N, Li E, Xu J, Yankner BA, Yuan J. Nature. 2000;403:98–103. doi: 10.1038/47513. [DOI] [PubMed] [Google Scholar]
- 42.Matsuyama S, Llopis J, Deveraux QL, Tsien RY, Reed JC. Nat Cell Biol. 2000;2:318–325. doi: 10.1038/35014006. [DOI] [PubMed] [Google Scholar]
- 43.Graeber TG, Osmanian C, Jacks T, Housman DE, Koch CJ, Lowe SW, Giaccia AJ. Nature. 1996;379:88–91. doi: 10.1038/379088a0. [DOI] [PubMed] [Google Scholar]
- 44.Khan S, Cleveland RP, Koch CJ, Schelling JR. Lab Invest. 1999;79:1089–1099. [PubMed] [Google Scholar]
- 45.Porwol T, Ehleben W, Zierold K, Fandrey J, Acker H. Eur J Biochem. 1998;256:16–23. doi: 10.1046/j.1432-1327.1998.2560016.x. [DOI] [PubMed] [Google Scholar]
- 46.Duranteau J, Chandel NS, Kulisz A, Shao Z, Schumacker PT. J Biol Chem. 1998;273:11619–11624. doi: 10.1074/jbc.273.19.11619. [DOI] [PubMed] [Google Scholar]
- 47.Chandel NS, McClintock DS, Feliciano CE, Wood TM, Melendez JA, Rodriguez AM, Schumacker PT. J Biol Chem. 2000;275:25130–25138. doi: 10.1074/jbc.M001914200. [DOI] [PubMed] [Google Scholar]
- 48.Yan SF, Fujita T, Lu J, Okada K, Shan Zou Y, Mackman N, Pinsky DJ, Stern DM. Nat Med. 2000;6:1355–1361. doi: 10.1038/82168. [DOI] [PubMed] [Google Scholar]
- 49.Ema M, Taya S, Yokotani N, Sogawa K, Matsuda Y, Fujii-Kuriyama Y. Proc Natl Acad Sci U S A. 1997;94:4273–4278. doi: 10.1073/pnas.94.9.4273. [DOI] [PMC free article] [PubMed] [Google Scholar]
- 50.Tian H, McKnight SL, Russell DW. Genes Dev. 1997;11:72–82. doi: 10.1101/gad.11.1.72. [DOI] [PubMed] [Google Scholar]
- 51.Yan SF, Zou YS, Gao Y, Zhai C, Mackman N, Lee SL, Milbrandt J, Pinsky D, Kisiel W, Stern D. Proc Natl Acad Sci U S A. 1998;95:8298–8303. doi: 10.1073/pnas.95.14.8298. [DOI] [PMC free article] [PubMed] [Google Scholar]
- 52.LaCasse EC, Baird S, Korneluk RG, MacKenzie AE. Oncogene. 1998;17:3247–3259. doi: 10.1038/sj.onc.1202569. [DOI] [PubMed] [Google Scholar]
- 53.Deveraux QL, Reed JC. Genes Dev. 1999;13:239–252. doi: 10.1101/gad.13.3.239. [DOI] [PubMed] [Google Scholar]
- 54.Deveraux QL, Takahashi R, Salvesen GS, Reed JC. Nature. 1997;388:300–304. doi: 10.1038/40901. [DOI] [PubMed] [Google Scholar]
- 55.Deveraux QL, Roy N, Stennicke HR, Van Arsdale T, Zhou Q, Srinivasula SM, Alnemri ES, Salvesen GS, Reed JC. EMBO J. 1998;17:2215–2223. doi: 10.1093/emboj/17.8.2215. [DOI] [PMC free article] [PubMed] [Google Scholar]
- 56.Roy N, Deveraux QL, Takahashi R, Salvesen GS, Reed JC. EMBO J. 1997;16:6914–6925. doi: 10.1093/emboj/16.23.6914. [DOI] [PMC free article] [PubMed] [Google Scholar]
- 57.Xu DG, Crocker SJ, Doucet JP, St-Jean M, Tamai K, Hakim AM, Ikeda JE, Liston P, Thompson CS, Korneluk RG, MacKenzie A, Robertson GS. Nat Med. 1997;3:997–1004. doi: 10.1038/nm0997-997. [DOI] [PubMed] [Google Scholar]
- 58.Li F, Ambrosini G, Chu EY, Plescia J, Tognin S, Marchisio PC, Altieri DC. Nature. 1998;396:580–584. doi: 10.1038/25141. [DOI] [PubMed] [Google Scholar]
- 59.Yang Y, Fang S, Jensen JP, Weissman AM, Ashwell JD. Science. 2000;288:874–877. doi: 10.1126/science.288.5467.874. [DOI] [PubMed] [Google Scholar]