Abstract
This study illustrates the utility of tetraplex stable isotope coded tags in mass spectrometric glycomics using three carbohydrate classes. The teteraplex tags allow for the direct comparison of glycan compositions within four samples using capillary scale hydrophilic interaction chromatography with on-line mass spectrometry. In addition, the ability to discern glycan structural isomers is shown based on the tandem mass spectra of each composition using nanospray ionization. Results are shown for chondroitin sulfate proteoglycans, low molecular weight heparins, full length heparins, and N-glycans from α-1-acid glycoproteins from four mammalian species. The data demonstrate the value of the tetraplex stable isotope tagging approach for producing high quality glycomics compositional profiling and fine structural analysis.
2 Introduction
The majority of nuclear, cytosolic, membrane bound and secreted proteins are glycosylated.1 Glycans are integral to many biological processes ranging from structure 2, protein stability 3, cell growth4, 5 and recognition6, 7. In depth analysis of the roles of specific glycan structures within biological systems remains a difficult task, as the non template-driven biosynthesis and heterogeneous expression does not allow for facile overproduction. Small sample quantities and contributions of biological matrix contaminants require methods that provide sensitive and reproducible results. As such mass spectrometry is widely used to determine the carbohydrate components within a biological system.8-14
The discovery of disease biomarkers and development of carbohydrate derived and glycoprotein pharmaceuticals, requires robust analytical methods to minimize the error introduced by instrumental or environmental (matrix) variations to ensure that pharmaceutical preparations are sufficiently safe and to reduce the occurrence of false positive (or false negative) biomarker screens. However, the potential for reductions in signal that can be observed from impurities and other matrix components that cause suppression of ionization should be addressed. Stable isotope labeling enables simultaneous analysis of multiple samples, thus equalizing matrix effects while increasing the throughput of sample analysis. The use of stable isotope labels based on reductive amination chemistry for carbohydrate analysis has been increasing in recent years 15-21; however, in all but one case22, duplex analysis has been demonstrated. Quantification of isobaric labeling has been used for comparison of glycan classes amenable to permethylation chemistry. 23-25
The use of glycosylated proteins as therapeutic agents requires strict adherence of the quantity and type of glycan structures during the manufacturing of the agents, in order to comply with FDA and patent regulations. Similarly, the potential for the use of changes in glycosylation as biomarkers for specific disease states requires an analytically robust method of determining changes on the typically small sample quantities available. In addition, accurate quantification of glycoconjugate glycans among biological variant samples will facilitate basic science understanding of human disease processes related to glycoconjugate expression.
Our previous work described synthesis of the tetraplex tags and use with static infusion MS. This work demonstrates the utility of tetraplex stable isotope labeled reductive amination tags for quantitative glycomics. Examples are shown for chondroitin sulfate (CS) proteoglycans, pharmaceutical heparins, and N-glycans from glycoproteins. The compositional profiling data provide precise comparison of glycan compositions as a function of biological sample variation. We show the applicability of the tags to an online LC/MS platform and demonstrate use of tandem mass spectrometry for comparison of the isomeric glycan fine structures in different biological samples. The tetraplex reductive amination tags thus provide a highly effective means of producing precise compositional profiling and fine structural comparisons combined with a multiplexing benefit in terms of increased sample throughput.
3 Experimental Section
3.1 Reagents
Chondroitin sulfate (CS) type A ((GlcAβ3GalNAc4Sulfateβ4)n), CS type B (CSB) ((IdoAα3GalNAc4sulfateβ4)n) CS type C (CSC) ((GlcAβ3GalNAc6sulfate)n), and chondroitinases ABC, B and AC1 were obtained from Seikagaku America/Associates of Cape Cod (Falmouth, MA). Heparin lyases I, II, and III were purchased from Ibex Technologies, Inc. (Montreal, Quebec, Canada). Peptide-N-Glycosidase F (PNGase F) was purchased from ProZyme, (San Leandro, CA.) Aggrecan, biglycan, decorin; cartilage extract, porcine mucosal heparin, and a-1-acid glycoprotein from ovine, bovine, human, and baboon were purchased from Sigma (St. Louis, MO). Lovenox (enoxaparin) was purchased as a prefilled syringe pharmaceutical preparation from Aventis Pharmaceuticals, Inc. (Bridgewater, NJ). Fragmin (dalteparin) was purchased as a prefilled syringe pharmaceutical preparation from the joint manufacturing of Pfizer Inc. (New York, NY) and Vetter Pharma-Fertigung, GmbH & Co. KG (Ravensburg, Germany). Purified Δ-disaccharide standards were purchased from V-labs (Covington, LA). 2-Aminoacridone was purchased from Fluka Chemical (Buchs, Switzerland). Acetonitrile, acetic acid, DMSO, and sodium cyanoborohydride was from Aldrich Chemicals Co (St. Louis, MO). Cellulose packing material Micro Spin Columns were purchased from Harvard Apparatus (Holliston, MA). Porous graphitized carbon columns (SuperSil) were purchased from Thermo Fisher Scientific (Waltham, MA). C18 Macrospin columns were purchased from the Nest Group (Southborough, MA).
3.2 Tag synthesis and labeling procedure
A stable isotope-labeled tag in four forms (+0,+4,+8,+12) was synthesized for the pur ose of labeling the reducing end of glycans, as previously described.22 The tag utilizes well documented26 and mild reductive amination27, 28 protocols for the addition, in high yields, of isotopic content into the glycan structure.
3.3 Chondroitin sulfate proteoglycan sample preparation
Chondroitin sulfate chains were released, in two sets of triplicates, from 10 μg samples of each proteoglycan by β-elimination, as previously described.17 The sample was partially depolymerized (30%) using chondroitinase ABC, chondroitinase B, and chondroitinase AC1, for use in MS Studies, as previously described.15, 22 Samples were normalized by the quantity of protein present in the sample as determined by the BCA assay, as determinations by weight may vary based on salt content of the highly sulfated GAG chains.
3.6 Heparin sample preparation
Samples of porcine mucosa heparin (Sigma), Lovenox (enoxaprin), and Fragmin (dalteparin) (100 μg) were prepared in triplicate in 50 mM Tris buffer pH 7.4. Heparin samples were exhaustively digested by the action of heparin lyases I (60 mU), II (60 mU), and III (60 mU), added in two portions 3 hours apart, with a total reaction time of 16 hours. The resulting samples were desalted using a G50 size-exclusion resin in a spin-column format (Nest group).
3.7 Heparin labeling and workup
The desalted oligosaccharide containing fractions were labeled with isotope- coded tags as described above. The Δ- unsaturated disaccharides and the lyase resistant oligosaccharides were labeled with stable isotope-containing tags (d0-heparin, d4-Lovenox, d8-Fragmin, and d12-heparin, and in reverse order) by reductive amination and the resulting tagged GAGs were combined, followed by cellulose clean-up, then fractionated by SEC-HPLC with a Superdex Peptide 3.2/30 column (Amersham Biosciences, Piscataway, NJ) using a mobile phase of 50 mM ammonium formate/ 10% acetonitrile at a rate of 40 μl/min while the profile was monitored at 232 nm,
3.8 α-1 acid glycoprotein release and workup
The N-Linked glycans of human, ovine, bovine, and baboon α-1-acid glycoprotein (Sigma, St Louis, MO) were released, in triplicate experiments of 500 pmol (20 μg) glycoprotein, from their proteins by the action of N-Glycanase® (Peptide-N-Glycosidase F, PROzyme, San Leandro, CA) according to the manufacturer's protocol. Glycan release was confirmed by SDS-PAGE. Excess detergent, buffer salts, and the core proteins were removed by porous graphitized carbon chromatography (SuperSil, Thermo Fisher Scientific, Waltham, MA). The glycan containing fractions were derivatized with d0-, d4-, d8- or d12-custom tags using the previously described method. The intent of the experiment was to compare abundances of N-glycans among samples from four species. The N-glycan signals were therefore normalized to the protein quantity as determined using the BCA assay.
3.9 Normal-phase capillary LC-MS
On-line LC-MS was performed using a capillary (250μm × 10 cm) packed with Amide −80 resin (5 μm, Tosoh Biosciences, South San Francisco, CA). Samples were eluted with a linear gradient (5% A-60% A). Solvent A: 50mM ammonium formate (pH 4.4) containing 10% ACN; Solvent B: 95 % ACN containing 5% 50mM ammonium formate (pH 4.4) over 60 minutes at a flow rate of 1 μl/min. The eluant was introduced into a quadrupole orthogonal time-of-flight (Q-oTOF) mass spectrometer (Applied Biosystems/MDS Sciex Qstar/Pulsar i) using a coated PicoTip™ emitter (SilicaTip™) (New Objective, Inc., Woburn, MA ) 50 μm needle tapering to a 15 μm orifice in the negative mode (ISV = − 4000 V).
3.10 Nanospray mass spectrometry
Oligosaccharides were analyzed using a quadrupole orthogonal time-of-flight (Q-oTOF) mass spectrometer (Applied Biosystems/MDS Sciex Qstar/Pulsar I, Toronto, Cananda) using nanospray29 ionization. Samples were dissolved in water, then diluted in an isopropanol:water (1:9) solution at a final concentration of 1 pmol/μl Fragmentation of the resultant tagged glycans was attained using collision energy (CAD=2, CE = −20 for CS analysis; CE= −8 to −15 for heparin analysis; CE= −25 - −40 for N-linked glycans), to determine the fragmentation patterns of the tag incorporated glycans. Tandem mass spectra were collected for heparin samples from the m/z corresponding to the highest charge state possible, generally equal to one negative charge per acidic group. By modifying the isolation parameters for Q1 isolation it was possible to isolate all four isotopic variants in one ion package, thereby allowing fragmentation of each elemental composition and a direct comparison of the ion fragmentations of constitutional isomers within each sample.
3.11 Description of data workup
The isotopic distribution of each envelope was calculated from the determined composition of the d0 component using the isotope distribution calculator function in the Analyst software package. Component masses containing varying amounts of deuterium (4, 8, 12) were calculated from the d0 value, correcting for the increased presence of deuterium and reduced presence of hydrogen. These calculated isotopic envelopes were then used to correct for the isotopic overlap occurring due to overlapping envelopes between differentially labeled glycans and fragment ions. In addition a small isotopic deficiency (ca. 1.5%), was corrected for each alanine unit in the labeled analyte. All tandem MS data is presented in terms of relative abundances of each parent MS ion, to reflect the differences in fragmentation between sample sources. For illustrative representations see supplementary information (Figures S1 and S2).
4. Results and Discussion
Glycosaminoglycans are linear biopolymers that are too large and heterogeneous to analyze intact, therefore they were enzymatically depolymerized into smaller chain lengths for analysis. The digestion mechanism incorporates an unsaturation at the non-reducing end of the product and allows for the monitoring of the reaction at a wavelength of 232 nm. This chromophore also allowed for the quantitative comparison of native and labeled glycosaminoglycans.
The Chondroitin sulfate class consists of repeating disaccharide units of N-acetyl-galactosamine and hexuronic acids, they exist primarily in three forms CSA, 4-sulfated on N-acetyl-galactosamine (-GlcA-GalNAc4S-) , CSB is a C5 hexuronic acid epimer of CSA (-IdoA-GalNAc4S-), and CSC, 6-sulfated on N-acetyl-galactosamine (-GlcA-GalNAc6S-). Three proteoglycans of bovine articular cartilage (aggrecan, biglycan, and decorin) were chosen for analysis due to their varied structures and biological significance. Aggrecan is a large (3.5 MDa) proteoglycan consisting of a 300 kDa core, decorated with up to 30 KS (keratin sulfate) chains and up to 100 CS chains. Over the course of life, the aggrecan molecules have been shown to have a reduction in the amount of CS present and a shift to increasing CSC-like composition.30 Biglycan and decorin are comparatively smaller CSPGs containing two and one CS/DS chains, respectively. The relatively high DS content of the GAG chains in decorin and biglycan enable binding of growth factors, including FGF-2 and FGF-7.31 Decorin and biglycan play roles in collagen fibrillogenesis, contributing to the structural stability of cartilage.32
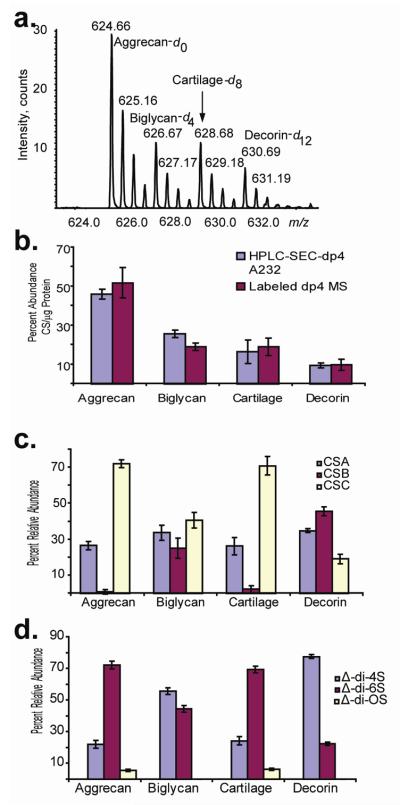
Relative quantities of depolymerization products were determined using two methods. After partial (30%) depolymerization a series of SEC-HPLC experiments, with UV detection at 232 nm, were used to determine the relative abundances of degree of polymerization (dp)4 products present in each proteoglycan mixture. A second series was labeled with tetraplex tags and the dp4 fraction from SEC-HPLC was analyzed by nanospray mass spectrometry (Figure 1.) Analytes reductively aminated with stable isotope tags were quantified in the MS mode. Additionally, using tandem mass spectrometric dissociation, the relative contributions of each glycoform present (CSA, CSB, CSC) in the samples were determined, adapting methods shown previously. 15, 22, 33-36 Using tetraplex stable-isotope labeled oligosaccharides and tandem mass spectrometry as the method of analysis (Figure 1c), values were determined to be closely related to those obtained from the capillary electrophoresis with laser-induced fluorescence detection (CE-LIF) disaccharide analysis (Figure 1d). For the tandem MS data in Figure 1c, the blue bar corresponds to CSA-like (Δ-UA-GalNAc4S -GlcA-GalNAc4S) repeats, the maroon bar to CSB-like (Δ-UA-GalNAc4S-IdoA-GalNAc4S) repeats, and the white bar to CSC-like (μ-UA-GalNAc6S -GlcA-GalNAc6S) repeats. In the CE-LIF disaccharide analysis results (Figure 1d), there is loss of information on the uronic acid epimerization caused by the complete depolymerization to disaccharides using the lyase enzymes. Thus, the abundance of Δ-di-4S in Figure 1d reflects the sum of CSA and CSB abundances from Figure 1c.
Figure 1.
a. Nanospray mass spectrum of tetraplex labeled dp4 SEC-HPLC fraction corresponding to [1,1,2,2,2] [Δ-UA, UA, GalN, Sulfate, Acetyl] . b. Relative quantities per μg protein of the dp4 fraction of three proteoglycans and cartilage extract determined using: nanospray mass spectrometry of stable isotope coded samples; and SEC-HPLC of unlabeled samples at an absorbance of 232 nm. c. Relative glycoform quantities as determined by: nanospray tandem mass spectrometry of tetraplex labeled dp4 samples; d. CE-LIF disaccharide analysis of exhaustively digested chondroitin chains.
CSPG aggrecan was 75% CSC, 25% CSA, 0% CSB. Biglycan and decorin possess CSB-like domains that have been speculated to have more protein-binding biological activity due to the relatively flexible IdoA residues allow for more interactions with protein binding partners.37 By mass spectrometric analysis, biglycan contained 34% CSA-like; 25% CSB-like; and 40% CSC-like composition, consistent with the ratios observed in CE-LIF (55% CSA+CSB; 45% CSC). Similarly, decorin samples contained 35% CSA-like; 46% CSB-like; and 19% CSC-like composition, also consistent with the values obtained from CE-LIF analysis (78% CSA+CSB; 22% CSC) (Figure 1d). These data for disaccharide analysis provided results consistent with those obtained by other groups38; slight variations in compositions were likely to result from differences in labeling protocols utilized. Relative quantities of disaccharide observed from aggrecan were also consistent with an LC-MS method using porous graphitized carbon (PGC) chromatography39.
Having demonstrated the use of our tetraplex labeling strategy on CS from proteoglycan samples, we applied it to the more complex heparin class of glycosaminoglycans. The highly sulfated heparin affects the coagulation pathway primarily by binding and inhibiting the serpin antithrombin III (ATIII). This activitiy is mediated by the presence of a pentasaccharide sequence GlcNS/Ac-GlcA-GlcNS3S6S-IdoA2S-GlcNS6S in approximately one in three heparin chains. Full length heparins exhibit poor pharmacokinetics upon subcutaneous injection and have clinical side effects resulting from undesirable protein binding. LMWHs are partially depolymerized heparin preparations that were developed to circumvent some of the limitations of heparin. LWMHs are less polydisperse, more bioavailable40 on subcutaneous injection, show better pharmacokinetics, and therefore clinical safety.41
Multiple sources of pharmaceutical-grade heparin preparations are available. Here we report a side by side comparison between compositions and fragment ions from two such preparations, as well as reagent grade heparin. The chemical and biological properties of LMWH depend on the depolymerization methods used. As a result, individual LMWH products are not therapeutically interchangeable.42, 43 LMWH may be produced by a variety of physical, chemical, and enzymatic depolymerization methods. These methods include gamma irradiation, alkaline hydrolysis, and heparin lyase digestion. Each of these methods gives rise to a distinct structural change in the newly cleaved glycosidic bonds. Of critical importance to the pharmaceutical industry is the ability to measure the glycan variation that composes all or part of the therapeutic agents. This serves two goals, one to maintain efficacy of the treatment, the second to provide the information necessary to protect the intellectual property via patent descriptions. One major point of investigation was to generate a better comparative technique for pharmaceutical preparations for the purposes of determining lot-to-lot variabilities, as well as comparisons for the development of generic versions of the LMWT heparin drugs.44
Exhaustive digestion with heparin lyase enzymes (I,II,III) produces ΔHexA2SGlcNS6S as the primary disaccharide products with ΔHexAGlcNS6S and ΔHexA2SGlcNS in lower abundances. A portion of the ATIII binding pentasaccharide resists digestion and results in the formation of ΔHexAGlcNAc6SGlcAGlcNS3S6S (dp4).45 The abundances of this tetramer has been used to measure the abundance of ATIII sequences in LMWH preparations.46
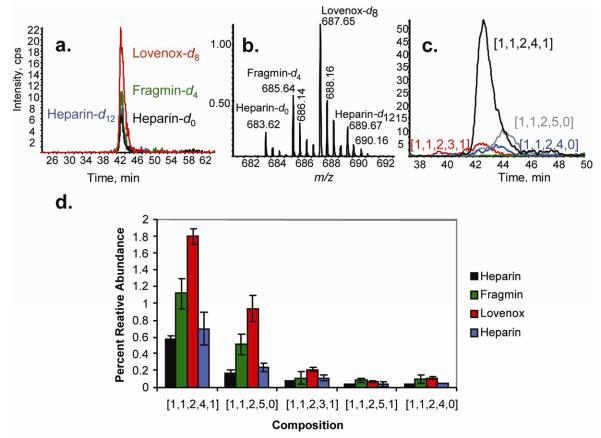
Heparin samples were digested exhaustively using heparin lyases I, II and III. The tetraplex tagging strategy allows for the quantification of differences in ion abundances between heparin, dalteparin, enoxaparin, and heparin by LC-MS. The differences in the quantities of lyase resistant tetramers containing a reducing end are shown in Figure 2. The normal phase chromatographic conditions and elution profiles are typical of those observed for heparin tetrasaccharides when using a 60 minute gradient. Composition [1,1,2,4,1] was the most prevalent composition in each heparin source, followed by [1,1,2,5,0]. The LC-MS data provided results consistent with those obtained by static nanospray, in terms of the relative quantities of each labeled composition present in the system. The use of an on-line separation system allowed for the facile compositional profiling of a set of samples with no observed chromatographic separation of tagged glycans containing varying quantities of deuterium, a complication observed in C18 chromatography of deuterium-labeled peptides47 and zwitterionic interaction chromatography (ZIC).48 This was likely due to the high helical propensity of alanine residues that composed the tag, where three consecutive alanines and an anthranillic acid were capable of completing one helical turn, thereby minimizing the deuterium isotope effect. The ability to separate the labeled dp4 compositions from compositions with reducing end modification generated by pharmaceutical preparations, anhydromannitol and 1,6-N-glucosamine acetal, led to an approximately 10-fold increase in the observed relative ion abundances of these compounds over that observed in nanospray conditions (Figure S 3). The likely cause was competing nanospray ionization that favored the more hydrophobic tagged structures over the reduced reducing end structures. Additionally, LC-MS allowed for the determination of the amount of sulfate loss during ionization, as indicated in Figure 2, composition [1,1,2,4,1] was observed with < 10 % loss of sulfate, and the more highly sulfated [1,1,2,5,0] with an approximate 20% loss.
Figure 2.
a. Normal phase LC/MS extracted ion chromatograms from heparin dp4 corresponding to [1,1,2,4,1] (m/z 683-6912-) tagged with d0-heparin (black), d4 (fragmin (green), d8 (Lovenox (red), d12 (Heparin (blue)). See the Experimental Section for chromatographic conditions. b. Summed mass spectrum for the 40-44 min range in (a), showing the m/z range of 683-691 (2- charge state of [1,1,2,4,1] (heparin, fragmin, lovenox, heparin, d0:d4:d8;d12). c. Extracted ion chromatograms of : black [1,1,2,4,1], red [1,1,2,3,1], grey [1,1,2,5,0], blue [1,1,2,4,0], green [1,1,2,5,1]. d. Percentage relative abundances of isotope-coded labeled lyase-resistant dp4 fractions derived from LC-MS. Relative abundance of compositions observed containing reducing end modified structures due to the depolymerization process of pharmaceutical preparation
The detected [1,1,2,4,1] composition likely contained a mixture of structural isomers that included the lyase resistant portion of the ATIII binding sequence that contains the critical GlcNS3S6S residue necessary for binding. Tandem MS was therefore used to compare the abundances of different isomeric structures among heparin preparations. Product ions containing the tag provided a measure of the relative abundances of different glycoforms among the four samples. Due to the solvent system used, ion charge states were too low for production of abundant product ions from glycosidic bond cleavage.49 Therefore, off-line nanospray ionization was used to obtain the higher charge states necessary for abundant dissociation by glycosidic bond cleavage.
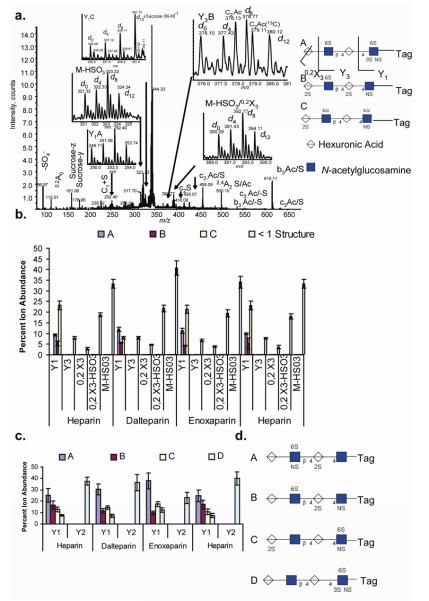
The tandem mass spectrum of composition [1,1,2,4,1] (Figure 3a.) showed Y1 product ions corresponding to three compositions: GlcNS3S6S-Tag (Y1A in the figure) , GlcNS-Tag (Y1B), and GlcNS6S-Tag (Y1C). The relative abundances were 9:5:23 for heparin; 11.7:5.5:7.9 for dalteparin; and 11:4:21 for enoxaparin as shown graphically in Figure 3b. Note that sucrose, present in the lyase enzyme formulation, was co-isolated with the precursor ion. The d12 isotope of the Y1C ion was isobaric with the sucrose, and thus it has an increased abundance. Because the Y1C ion was present at a 2- charge state, it was possible to correct its abundance from the contribution of the singly charge sucrose ion using the abundance of the Y1C A+1 ion. For the Y3, [M-SO3], and 0,2X ions, it was not possible to determine the locations of the sulfate groups. The structures of the three isomeric [1,1,2,4,1] compositions were therefore deduced from the compositions of the Y1 ions, corroborated by the presence of the complementary B- and C-type ions within the tandem mass spectrum. Figure 3b compares the abundances of product ions containing the tag for the four samples. To provide additional structural certainty, each of the four deuterated forms of the precursor ions were isolated separately using an isolation window of 1u and dissociated, yielding the same interpretation (Figure S 4). The tandem mass spectrum of composition [1,1,2,3,1] (Figure 3c.) showed Y1 and Y2 product ions corresponding to four isomers. Again, isolation and dissociation of each deuterated precursor ion form separately confirmed the interpretation of the complementary B- and C-type ions.
Figure 3.
a.).Tandem MS of lyase resistant tetrasaccharide [1,1,2,4,1] by nanospray ionization. The insets show expansions of m/z regions showing the four deuterated forms corresponding to the product ions indicated. The Y ions in the insets are labeled with a letter that corresponds to a structure shown to the right. ; b.) distribution of isotopically labeled product ions from the lyase resistant tetrasaccharide of composition [1,1,2,4,1]4-; c.) distribution of isotopically labeled product ions from the lyase resistant tetrasaccharide of composition [1,1,2,3,1]4-; d.) representations of structures present in [1,1,2,3,1] tandem mass spectrum.
Care was taken to minimize loss of equivalents of SO3 from precursor ions during tandem MS process by selecting precursor ions with high charge states. To accomplish this, collision energies were set to reduce the parent ion abundance by only 10%. The use of tetraplex labels for fragmentation studies provided a normalizing effect due to the fact that all components were subjected to the same conditions, thus providing a level comparison. It was significant that each heparin source produced a unique tandem mass spectral ion abundance pattern, as well as different oligosaccharide compositional profiles. The data therefore showed potential for comparison of the abundances of isomeric mixtures without need for purification of each component.
In a final demonstration of the utility of multiplex reductive amination tagging, the N-linked glycans released from α-1-acid glycoprotein from four species were examined. The mass spectrometric data were normalized relative to the quantity of core protein present in each sample. The glycosylation structure of α-1-acid glycoprotein has been reported to change resulting from inflammation caused by factors such as bacterial infections and wound healing. 50
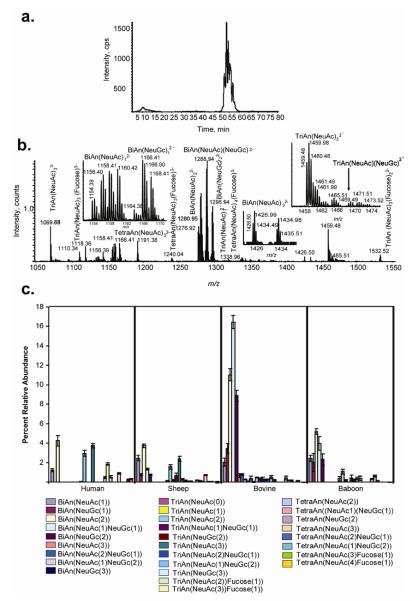
α-1-Acid glycoprotein N-glycans from human, ovine, bovine, and baboon sources were used to demonstrate the utility of the tetraplex reductive amination tags for profiling of N-glycans as shown in Figure 4. The extracted ion chromatogram (a) showed the elution of N-glycans in the m/z 1000-1600 range. The summed mass spectrum (b) showed the distribution of N-glycan compositions, each of which were present as four deuterated tagged variants. The inserts show the d0, d4, d8 and d12 isotope distributions for four N-glycan compositions. The distribution of BiAn(NeuAc)1 isotopic forms shows that human α-1-acid glycoprotein has the lowest abundance of this composition. Human BiAn(NeuGc)1 (d0 form) is absent, as expected since humans do not express the enzyme function for producing NeuGc. TriAn(NeuAc)2 is abundant in humans. TriAn(NeuAc)1(NeuGc)1 is absent from humans, as expected. These trends are shown in detail in (c), reconstructed from the integrated LC/MS peak areas for each species.
Figure 4.
Compositional analysis glycoprotein glycan compositions released by PNGase F treatment . a. EIC of labeled N-glycans (m/z 1000-1600). b.) Mass spectrum of tetraplex labeled α-1- acid glycoprotein glycans (d0: human; d4: sheep; d8: bovine; d12: baboon) showing inserts for four N-glycan compositions. c.) Percent relative abundances per μg protein of reducing end labeled compositions. N-Glycan structure are listed using the following abbreviations: BiAn, Hex5HexNAc4; TriAn, Hex7HexNAc5; TetraAn, Hex9,HexNAc6.
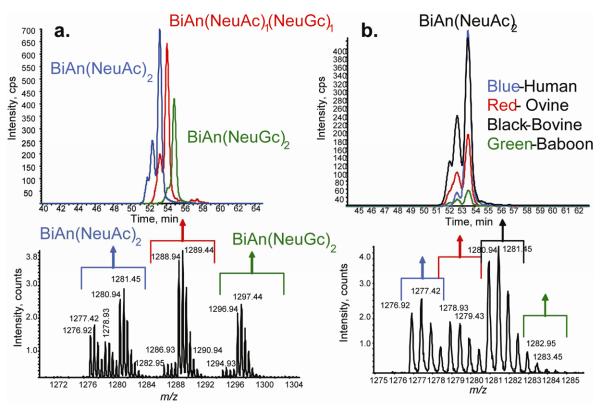
Figure 5 demonstrates the ability to use amide-HILIC separation for N-linked glycans based on the composition of each glycan and, in many cases, multiple peaks indicate isomers present within the composition. The on-line separation system allows comparison of the extracted ion chromatograms among the different species. The separation of glycans based on the N-glycolyl-neuraminic acid content is also observed. The compositions determined by MS analysis are consistent with those observed by Nakano et al. where greater quantities of tetra- and tri- antennary glycans are observed in human samples, whereas bovine samples contain larger quantities of biantenery glycans including a large amount of N-glycolyl-neuramininc acid.51 Baboon samples have the lowest glycan content per μg of protein as compared to the other species, with a distribution of bi-, tri-, and tetra- antennary structures. Abbreviations are used for these structures, as defined in the Figure 4 legend. Sheep α-1 glycoprotein glycans have a relatively even distribution of glycan size and functionalization across the observed compositions, as well. The addition of fucose to the glycans of α-1-acid glycoprotein occured only in humans, exclusively on the TriAn(NeuAc2), TriAn(NeuAc3), TetraAn(NeuAc3), and TetraAn(NeuAc4). Although it is possible for incorporation of NeuGc into human glycoproteins due to the dietary consumption of animal products, no such glycans were detected in the human α-1-acid glycoprotein samples. The data demonstrated, however, the potential for this approach for profiling NeuGc incorporation as a function of biological variation. Such an approach would be expected to prove useful for profiling changes in incorporation of NeuGc observed in glycoproteins associated with tumors.52 Because the tetraplex tagging protocol allowed for the direct comparison of each composition from each species the precise data lent confidence in the assignment of subtle differences in glycan compositions among α-1-acid glycoprotein from the four species.
Figure 5.
a.) Extracted ion chromatograms of: BiAn(NeuAc2) 2- (m/z 1277-1283); (BiAn(NeuAc1NeuGc1)2- (m/z 1286-1291); (Bian(NeuGc2)2- (m/z 1294-1299) d0-human, d4-ovine, d8 bovine, d12 baboon. b.) LC-MS summing all peaks for BiAn(NeuAc2)2- (human:ovine:bovine:baboon, d0:d4:d8;d12). N-Glycan abbreviations are defined in the Figure 4 caption.
Tandem mass spectrometry showed that different patterns of dissociation exist among a given N-glycan composition from the different species. The most abundant product ions corresponded to untagged non-reducing end fragments and losses of NeuAc groups. Nonetheless, the species-specific product ion abundance profiles indicated that positional isomers exist. In the case of BiAn(NeuAc2) 3-, labeled reducing end fragments showed an abundant Z1 ion, relative to the Y6 ion, while the other species showed significantly different ratios for this pair. This indicated that the NeuAc linkage from the human samples were significantly less susceptible to dissociation than that from the other species, thereby causing an abundant Z1 ion. Similarly, TriAn(NeuAc3)4- ions from human showed a more abundant Z1 ion and ion from loss of NeuAc (y6) relative to the other species. TriAn(NeuAc1) 2 shows a pattern similar to BiAn(NeuAc2) 3- with significantly more abundant Z1 ions than Z6 ions for human samples.
Tandem mass spectrometry of N-linked glycans requires a higher collision energy than that of the sulfated GAG class previously analyzed. As such, it was determined that collision energies exceeding −45 V induced the loss and/or fragmentation of the tag, creating a potential limitation on the information available from a labeled glycan. However, this can be overcome via isolation and fragmentation of each isotopically enriched tag variant individually.
5. Conclusions
Glycans released from purified glycoconjugates contain a distribution of glycoforms. A given composition from such a mixture typically contains a mixture of isomers. The tetraplex stable isotope reductive amination tags are shown here to facilitate precise LC/MS compositional profiling of glycosaminoglycans and N-glycans. These results are significant in that the high data quality enables comparatively subtle changes in glycan composition to be visualized. A given glycan composition typically reflects the presence of a distribution of structural isomers. Tandem MS of the tetraplex tagged glycans enables comparison of the fine structures present in each biological sample. It is expected that this capability will be useful for correlating glycan structure with observed biological function. The ability to assign product ion profiles associated with an observed biological phenotype, or a desired pharmaceutical endproduct, is expected to be useful for directing glycan purification for the purpose of informing chemical synthesis efforts.
Supplementary Material
Figure 6.
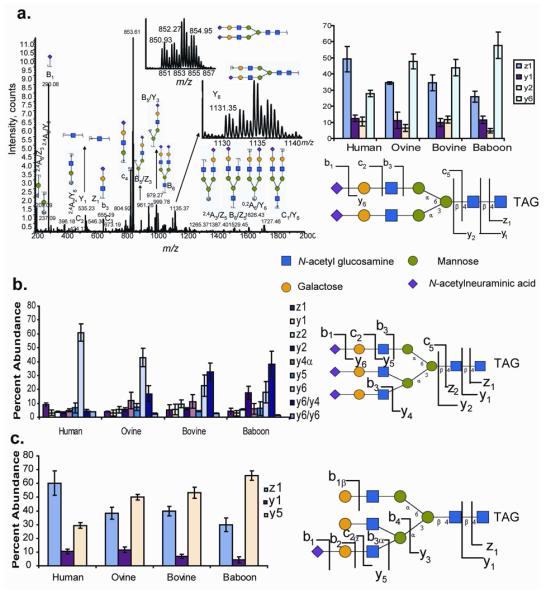
a.) Tandem mass spectrum of α-1-acid glycans corresponding to compositions: a.) BiAn(NeuAc2) 3- and the relative quantification of product ions. b.) relative quantification of product ions from TriAn(NeuAc3)4- c.) relative quantification of product ions from TriAn(NeuAc1) 2 The location of the sialic acid in the representative structure is for illustrative purposes, as the sialic acid position was not determined. N-Glycan abbreviations are given in the Figure 4 legend.
6. Acknowledgements
Support was provided by NIH grants P41RR10888, R01HL74197.
7. References
- 1.Apweiler R, Hermjakob H, Sharon N. Biochim Biophys Acta. 1999;1473:4–8. doi: 10.1016/s0304-4165(99)00165-8. [DOI] [PubMed] [Google Scholar]
- 2.Iozzo RV. Annu Rev Biochem. 1998;67:609–652. doi: 10.1146/annurev.biochem.67.1.609. [DOI] [PubMed] [Google Scholar]
- 3.Helenius A. Philos Trans R Soc Lond B Biol Sci. 2001;356:147–150. doi: 10.1098/rstb.2000.0759. [DOI] [PMC free article] [PubMed] [Google Scholar]
- 4.Conrad HE. Heparin Binding Proteins. Academic Press; New York: 1998. [Google Scholar]
- 5.Varki A, Cummings R, Esko J, Freeze H, Hart G, Marth G. Essentials of Glycobiology. Cold Spring Harbor Laboratory Press; Cold Spring Harbor, NY: 1999. [PubMed] [Google Scholar]
- 6.Smith AE, Helenius A. Science. 2004;304:237–242. doi: 10.1126/science.1094823. [DOI] [PubMed] [Google Scholar]
- 7.Marsh M, Helenius A. Cell. 2006;124:729–740. doi: 10.1016/j.cell.2006.02.007. [DOI] [PMC free article] [PubMed] [Google Scholar]
- 8.Haslam SM, Gems D, Morris HR, Dell A. Biochem Soc Symp. 2002:117–134. [PubMed] [Google Scholar]
- 9.Dwek MV, Brooks SA. Curr Cancer Drug Targets. 2004;4:425–442. doi: 10.2174/1568009043332899. [DOI] [PubMed] [Google Scholar]
- 10.Harvey DJ. Expert Rev Proteomics. 2005;2:87–101. doi: 10.1586/14789450.2.1.87. [DOI] [PubMed] [Google Scholar]
- 11.Yu Y, Sweeney MD, Saad OM, Crown SE, Hsu AR, Handel TM, Leary JA. J Biol Chem. 2005;280:32200–32208. doi: 10.1074/jbc.M505738200. [DOI] [PubMed] [Google Scholar]
- 12.Saad OM, Ebel H, Uchimura K, Rosen SD, Bertozzi CR, Leary JA. Glycobiology. 2005;15:818–826. doi: 10.1093/glycob/cwi064. [DOI] [PubMed] [Google Scholar]
- 13.Zhang J, Xie Y, Hedrick JL, Lebrilla CB. Anal Biochem. 2004;334:20–35. doi: 10.1016/j.ab.2004.07.012. [DOI] [PubMed] [Google Scholar]
- 14.Madera M, Mechref Y, Klouckova I, Novotny MV. J Chromatogr B Analyt Technol Biomed Life Sci. 2007;845:121–137. doi: 10.1016/j.jchromb.2006.07.067. [DOI] [PubMed] [Google Scholar]
- 15.Hitchcock AM, Costello CE, Zaia J. Biochemistry. 2006;45:2350–2361. doi: 10.1021/bi052100t. [DOI] [PMC free article] [PubMed] [Google Scholar]
- 16.Ridlova G, Mortimer JC, Maslen SL, Dupree P, Stephens E. Rapid Commun Mass Spectrom. 2008;22:2723–2730. doi: 10.1002/rcm.3665. [DOI] [PubMed] [Google Scholar]
- 17.Hitchcock AM, Yates KE, Costello CE, Zaia J. Proteomics. 2008;8:1384–1397. doi: 10.1002/pmic.200700787. [DOI] [PMC free article] [PubMed] [Google Scholar]
- 18.Lawrence R, Olson SK, Steele RE, Wang L, Warrior R, Cummings RD, Esko JD. J Biol Chem. 2008;283:33674–33684. doi: 10.1074/jbc.M804288200. [DOI] [PMC free article] [PubMed] [Google Scholar]
- 19.Yuan J, Hashii N, Kawasaki N, Itoh S, Kawanishi T, Hayakawa T. J Chromatogr A. 2005;1067:145–152. doi: 10.1016/j.chroma.2004.11.070. [DOI] [PubMed] [Google Scholar]
- 20.Hsu J, Chang SJ, Franz AH. J Am Soc Mass Spectrom. 2006;17:194–204. doi: 10.1016/j.jasms.2005.10.010. [DOI] [PubMed] [Google Scholar]
- 21.Xia B, Feasley CL, Sachdev GP, Smith DF, Cummings RD. Analytical biochemistry. 2009;387:162–170. doi: 10.1016/j.ab.2009.01.028. [DOI] [PMC free article] [PubMed] [Google Scholar]
- 22.Bowman MJ, Zaia J. Anal Chem. 2007;79:5777–5784. doi: 10.1021/ac070581b. [DOI] [PMC free article] [PubMed] [Google Scholar]
- 23.Botelho JC, Atwood JA, Cheng L, Alvarez-Manilla G, York WS, Orlando R. International Journal of Mass Spectrometry. 2008;278:137–142. [Google Scholar]
- 24.Atwood JA, 3rd, Cheng L, Alvarez-Manilla G, Warren NL, York WS, Orlando R. J Proteome Res. 2008;7:367–374. doi: 10.1021/pr070476i. [DOI] [PubMed] [Google Scholar]
- 25.Kang P, Mechref Y, Kyselova Z, Goetz JA, Novotny MV. Analytical Chemistry. 2007;79:6064–6073. doi: 10.1021/ac062098r. [DOI] [PubMed] [Google Scholar]
- 26.Bigge JC, Patel TP, Bruce JA, Goulding PN, Charles SM, Parekh RB. Anal Biochem. 1995;230:229–238. doi: 10.1006/abio.1995.1468. [DOI] [PubMed] [Google Scholar]
- 27.Anumula KR. Anal Biochem. 2000;283:17–26. doi: 10.1006/abio.2000.4645. [DOI] [PubMed] [Google Scholar]
- 28.Anumula KR. Anal Biochem. 2006;350:1–23. doi: 10.1016/j.ab.2005.09.037. [DOI] [PubMed] [Google Scholar]
- 29.Wilm MS, Mann M. Int J Mass Spectrom Ion Processes. 1994;136:167–180. [Google Scholar]
- 30.Dudhia J. Cell Mol Life Sci. 2005;62:2241–2256. doi: 10.1007/s00018-005-5217-x. [DOI] [PMC free article] [PubMed] [Google Scholar]
- 31.Taylor KR, Rudisill JA, Gallo RL. J Biol Chem. 2005;280:5300–5306. doi: 10.1074/jbc.M410412200. [DOI] [PubMed] [Google Scholar]
- 32.Ruhland C, Schonherr E, Robenek H, Hansen U, Iozzo RV, Bruckner P, Seidler DG. Febs J. 2007 doi: 10.1111/j.1742-4658.2007.05951.x. [DOI] [PubMed] [Google Scholar]
- 33.Hitchcock AM, Bowman MJ, Staples GO, Zaia J. Electrophoresis. 2008;29:4538–4548. doi: 10.1002/elps.200800335. [DOI] [PMC free article] [PubMed] [Google Scholar]
- 34.Desaire H, Leary JA. J Am Soc Mass Spectrom. 2000;11:916–920. doi: 10.1016/S1044-0305(00)00168-9. [DOI] [PubMed] [Google Scholar]
- 35.Saad OM, Leary JA. Anal Chem. 2003;75:2985–2995. doi: 10.1021/ac0340455. [DOI] [PubMed] [Google Scholar]
- 36.Miller MJ, Costello CE, Malmstrom A, Zaia J. Glycobiology. 2006;16:502–513. doi: 10.1093/glycob/cwj093. [DOI] [PMC free article] [PubMed] [Google Scholar]
- 37.Casu B, Petitou M, Provasoli M, Sinay P. Trends Biochem Sci. 1988;13:221–225. doi: 10.1016/0968-0004(88)90088-6. [DOI] [PubMed] [Google Scholar]
- 38.Matsuno YK, Yamada K, Tanabe A, Kinoshita M, Maruyama SZ, Osaka YS, Masuko T, Kakehi K. Anal Biochem. 2007;362:245–257. doi: 10.1016/j.ab.2006.12.027. [DOI] [PubMed] [Google Scholar]
- 39.Estrella RP, Whitelock JM, Packer NH, Karlsson NG. Anal Chem. 2007;79:3597–3606. doi: 10.1021/ac0622227. [DOI] [PubMed] [Google Scholar]
- 40.Armstrong EP. Formulary. 1999;34:144–148. [Google Scholar]
- 41.Samama MM. Seminars in Thrombosis & Hemostasis. 2000;26:31–38. doi: 10.1055/s-2000-9497. [DOI] [PubMed] [Google Scholar]
- 42.Merli GJ, Vanscoy GJ, Rihn TL, Groce JB, 3rd, McCormick W. J Thromb Thrombolysis. 2001;11:247–259. doi: 10.1023/a:1011969005756. [DOI] [PubMed] [Google Scholar]
- 43.Nightingale SL. JAMA. 1993;270:1672. doi: 10.1001/jama.270.14.1672. [DOI] [PubMed] [Google Scholar]
- 44.Fareed J, Leong WL, Hoppensteadt DA, Jeske WP, Walenga J, Wahi R, Bick RL. Semin Thromb Hemost. 2004;30:703–713. doi: 10.1055/s-2004-861513. [DOI] [PubMed] [Google Scholar]
- 45.Shriver Z, Sundaram M, Venkataraman G, Fareed J, Linhardt R, Biemann K, Sasisekharan R. Proc Natl Acad Sci U S A. 2000;97:10365–10370. doi: 10.1073/pnas.97.19.10365. [DOI] [PMC free article] [PubMed] [Google Scholar]
- 46.Sundaram M, Qi Y, Shriver Z, Liu D, Zhao G, Venkataraman G, Langer R, Sasisekharan R. Proc Natl Acad Sci U S A. 2003;100:651–656. doi: 10.1073/pnas.252643299. [DOI] [PMC free article] [PubMed] [Google Scholar]
- 47.Zhang R, Sioma CS, Wang S, Regnier FE. Anal Chem. 2001;73:5142–5149. doi: 10.1021/ac010583a. [DOI] [PubMed] [Google Scholar]
- 48.Takegawa Y, Hato M, Deguchi K, Nakagawa H, Nishimura S. J Sep Sci. 2008;31:1594–1597. doi: 10.1002/jssc.200700659. [DOI] [PubMed] [Google Scholar]
- 49.Zaia J, Costello CE. Analytical Chemistry. 2003;75:2445–2455. doi: 10.1021/ac0263418. [DOI] [PubMed] [Google Scholar]
- 50.Higai K, Aoki Y, Azuma Y, Matsumoto K. Biochim Biophys Acta. 2005;1725:128–135. doi: 10.1016/j.bbagen.2005.03.012. [DOI] [PubMed] [Google Scholar]
- 51.Nakano M, Kakehi K, Tsai MH, Lee YC. Glycobiology. 2004;14:431–441. doi: 10.1093/glycob/cwh034. [DOI] [PubMed] [Google Scholar]
- 52.Varki NM, Varki A. Lab Invest. 2007;87:851–857. doi: 10.1038/labinvest.3700656. [DOI] [PMC free article] [PubMed] [Google Scholar]
Associated Data
This section collects any data citations, data availability statements, or supplementary materials included in this article.


