Abstract
Although alterations in the gross mechanical properties of dynamic and compliant tissues have a major impact on human health and morbidity, there are no well-established techniques to characterize the micromechanical properties of tissues such as blood vessels and lungs. We have used nanoindentation to spatially map the micromechanical properties of 5-μm-thick sections of ferret aorta and vena cava and to relate these mechanical properties to the histological distribution of fluorescent elastic fibers. To decouple the effect of the glass substrate on our analysis of the nanoindentation data, we have used the extended Oliver and Pharr method. The elastic modulus of the aorta decreased progressively from 35 MPa in the adventitial (outermost) layer to 8 MPa at the intimal (innermost) layer. In contrast, the vena cava was relatively stiff, with an elastic modulus >30 MPa in both the extracellular matrix-rich adventitial and intimal regions of the vessel. The central, highly cellularized, medial layer of the vena cava, however, had an invariant elastic modulus of ~20 MPa. In extracellular matrix-rich regions of the tissue, the elastic modulus, as determined by nanoindentation, was inversely correlated with elastic fiber density. Thus, we show it is possible to distinguish and spatially resolve differences in the micromechanical properties of large arteries and veins, which are related to the tissue microstructure.
I. INTRODUCTION
The need to develop reliable methods for the assessment of tissue elasticity at the microscopic scale is underlined by the impact of cardiovascular and pulmonary disorders on the aging population.1,2 In general, compliant tissues, such as blood vessels, lungs, and skin, become stiffer with age.3 These changes in gross mechanical properties have a profound effect on tissue function and hence morbidity and mortality. In the case of large blood vessels it is now well established that gross arterial stiffness, measured in vivo, increases both with age and, separately and excessively, with increased cardiovascular risk factors, including hypertension, diabetes mellitus, and end-stage renal failure.1,4-7
Large arteries, such as the aorta, use their elastic properties to buffer variations in blood pressure. Assuming a heart rate of 75 beats per minute8 and a life expectancy greater than seventy,9 the major arteries will undergo more than 3 × 10⁹ extension and relaxation cycles during a human lifetime. As a consequence of these physiological demands, these arteries are enriched in highly compliant elastin, which endows connective tissues with the ability to deform and passively recoil. Elastin may comprise up to 22% of the dry weight of normotensive human thoracic aortae.10 Elastic fibers are an important microstructural component of connective tissues and are a composite biomaterial composed of both elastin and fibrillin microfibrils, which are thought to reinforce the fiber.11 The structure and mechanical function of these microfibrils have been shown to be compromised in aged tissues.12 There remains, however, a fundamental gap in our ability to determine the mechanical properties of tissue structures, such as cells, collagen fibrils, and elastic fibers at the micron (microscopic) scale, which may be bridged by the application of the modified nanoindentation analysis techniques presented in this study.
Nanoindentation has been used extensively over the past decade to measure the elastic properties of calcified biological tissues at the micron-length scale and these data may be correlated with histological features within the specimen.13-19 However, for compliant biological tissues, the application of this technique has proved to be much more challenging. Unlike calcified tissues, soft tissue specimens cannot be polished to provide a flat surface for testing. The resulting high surface roughness, in combination with a low elastic modulus, poses significant problems in data interpretation when using conventional nanoindentation testing methodologies that use a Berkovich indenter. With the sharp triangular pyramid of the Berkovich indenter, the local stiffness on initial contact with soft tissue samples is low and significant surface penetration can occur before the contact area is sufficiently great to register contact. To overcome the contact stiffness problem with ultralow modulus samples, flat punch and relatively large radius spherical indenters have been used20 and analyses extended beyond the widely adopted elastic models of Oliver and Pharr.21,22
Ebenstein and Pruitt23 presented a study of the indentation of gelatine and agarose gels with some comparative data on vascular tissue. They concluded that the most reproducible results were obtained using conospherical indenters with a tip radius of 100 μm. However, as the contact radius of the indenter tip increases, the achievable spatial resolution decreases because, at a given indentation depth, a larger radius tip generates a larger contact radius. Individual elastic fibers typically have a diameter of 2-3 μm24 while fibroblasts, the main spindle-shaped synthetic cells responsible for the deposition of extracellular matrix (ECM), have a long axis of less than 40 μm and a short axis of less than 10 μm.25 Thus, large conospherical tips will measure the average mechanical properties of tissues rather than the micromechanical properties of individual micro-structural components.
It is possible to overcome some of the problems associated with indenting soft tissues by probing 5-10-μm-thick tissue sections, which are prepared by routine histological methods and are mounted onto glass microscope slides. In addition to facilitating the collection of micromechanical data, the use of thin tissue sections permits the detailed correlation of micromechanical data with tissue microarchitecture, as determined by powerful and well-established histochemical and immunohistochemical techniques. However, it is well known that the presence of a substrate strongly affects the indentation response of thin surface coating specimens.26 Thus, for the thinnest histological sections, which provide the best surface for nanoindentation, the stiffness will be dominated by the presence of the rigid glass slide. To overcome these limitations, this work demonstrates how the extended Oliver–Pharr method for thin coating analysis27 can be used to obtain valuable micromechanical data for soft tissue, following nanoindentation of thin tissue sections with a conventional methodology. An earlier version of this work was presented at the 2008 MRS Spring meeting, San Francisco28; here we report a more complete analysis of the correlation between histology and mechanical properties.
II. OVERVIEW OF THE OLIVER–PHARR METHOD FOR THIN COATINGS
It is well established that the classical Oliver and Pharr method, which is an approach based on the monolithic elastic half-space model, and is used to determine the elastic modulus from nanoindentation experiments29 cannot be directly applied to layered materials and small structures.30 Thus, this method needs to be corrected when applied to thin layers of material, such as biological tissue sections, mounted on a much stiffer glass substrate. Bolshakov et al.31 introduced the concept of the “effective indenter shape” and this was later refined by providing a detailed procedure for the analysis of indentation unloading curves.32 On the basis of this concept, previous work has derived a closed-form solution for the mechanical contact of an indenter, with the general shape of a solid of revolution, on a solid surface and on a thin coating on a substrate.27 In subsequent studies a variety of applications for this method of analysis have been presented.33-37 By combining this extended Hertzian theory27 and the solution for an arbitrary contact problem on layered materials,38 it is possible to construct a method based on the Oliver and Pharr approach for coated or otherwise layered half spaces. Although the resulting formulae are complex, the approach is readily accessible via an automated software package,39 FilmDoctor (Saxonian Institute of Mechanics, Ummanz, Germany). In this study, this extension to the Oliver–Pharr method has been used to determine the Young’s modulus of thin sections of anatomically distinct vascular tissue, and the resulting values have been correlated with tissue histology.
The procedure used is simple, because it follows the classic Oliver and Pharr methodology and is laid out as follows:
An effective indenter is fitted to the unloading curve. For reasons of simplicity and because they are generally available, the Oliver and Pharr results can be used as starting parameters.
The Young’s modulus of the sample or layer in question is fitted to the indentation unloading curve, taking into account the effective indenter and the geometry of the system (specimen thickness, possible additional layers, etc). As with all indentation-based methods, an effective or contact modulus is obtained, hence to determine Young’s modulu; Poisson’s ratio has to be estimated. A value of 0.5 was used for the soft tissue calculations.40
This extended Oliver and Pharr method can determine the yield strength for many material configurations. Independent of the experimental setup other critical parameters can be obtained from the effective elastic field at the initiation of unloading.27,33-37
Note that the approach outlined here, which is embodied in FilmDoctor, is a completely analytic methodology that is not based on a finite element or other numerical approach. Therefore, this methodology gives a high accuracy and resolution, which is determined solely by experimental factors.
III. EXPERIMENTAL PROCEDURE
A. Sample preparation
Cross sections of adult ferret descending aorta and vena cava were prepared from unfixed optimal cutting temperature (OCT) compound (Tissue-Tek Sakura Finetek, The Netherlands) embedded tissue samples. The samples were frozen in supercooled isopentane by submersion in liquid N2 and stored at −80 °C pending cryosectioning. These frozen specimens were secured to cryostat chucks with OCT and sectioned to a nominal thickness of 5 μm using a microtome (Bright OTF: Bright Instrument Company Ltd., Huntingdon, UK). The samples were mounted on glass slides with known mechanical properties (Surgipath Europe Ltd., Peterborough, UK).
B. Fluorescence microscopy
For fluorescence microscopy, serial sections were fixed in a 4% paraformaldehyde solution for 10 min and subsequently stained with hematoxylin and eosin (H&E) following a standard procedure, and mounted in DePex Mounting Medium (Electron Microscopy Sciences, Fort Washington, PA). The sections were then visualized with 10× or 20× objective by fluorescence microscopy using a Nikon Eclipse 50i fluorescence microscope controlled by Lucia software (version 4.82, Laboratory Imaging, Prague, Czech Republic), using green [420/530-nm wavelength fluorescein isothiocyanate (FITC)] and red [530/600-nm wavelength tetramethylrhodamine isothiocyanate (TRITC)] filters. Unstained sections were also viewed with the fluorescence microscope using the FITC filter.
C. Nanoindentation
Nanoindentation experiments were conducted using a TriboScope nanoindenter (Hysitron, Minneapolis, MN) mounted on an atomic force microscope (AFM) (Explorer: Veeco, Santa Barbara, CA) in place of the AFM tip. The AFM was controlled with a Veeco APEM-1000 Autoprobe Electronics Module (AEM). A conospherical diamond tip of 10-μm radius was used for the indentation experiments, with the sample loaded to a maximum force of 10 mN. All nanoindentation experiments were carried out on unfixed and unstained tissue sections.
To determine the variation in mechanical properties across a blood vessel wall, we carried out a series of indentations from the outer adventitial layer to the innermost lumen region, using a high-precision X-Y stage with a 10-μm resolution (LINOS Photonics GmbH, Goettingen, Germany) to move the sample relative to the indenter tip. Indent locations were selected manually from the 100 μm × 100 μm AFM image window, with each indent situated 15-μm apart. Three indents were made in each vertical plane, also separated by 15 μm [Fig. 1(a)]. The drift rate was set to 0.1 nm/s and the loading rate was 200 μN/s. A 10 s hold period was applied to each indent after loading.
FIG. 1.
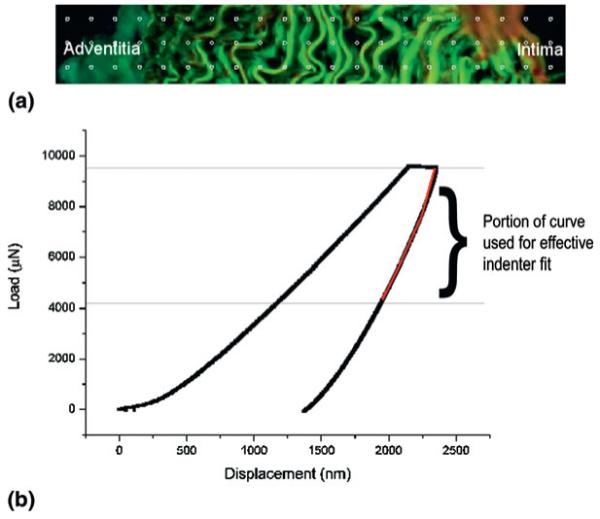
(a) Typical indent separations are represented by the grid. The distance between the points is 15 μm. (b) Typical load-displacement curve with the portion of the unloading curve used for the effective indenter fit indicated on the plot.
To decouple the effect of the glass substrate from the tissue properties, the nanoindentation data were subsequently analyzed using FilmDoctor software. The properties of the glass substrate (Young’s modulus, E = 70 GPa and Poisson’s ratio, ν = 0.23) were defined for a single layer system (i.e., single coating on a glass substrate) of 5-μm thickness. Poisson’s ratio for the tissue was assumed to be 0.5 for all tissue samples. An effective spherical indenter was fitted to the unloading curve using the equivalent half-space value for E, determined from the classical Oliver–Pharr method, as the initial value for the fitting procedure. A value for the radius of curvature of the effective sphere fitting the unloading curve was selected manually for each indent, until the best fit was achieved [Fig. 1(b)]. E was subsequently determined from the upper portion of the unloading curve using this effective sphere radius. The measurements from each set of vertical indents were averaged to provide a mean estimate of Young’s modulus for that particular section of the tissue.
IV. RESULTS AND DISCUSSION
Although venous and arterial blood vessels are composed of similar cellular and extracellular components, the differential mechanical function of blood vessels depends on the relative abundance, distribution, and molecular structure of these components within the tissue. A nanoindentation methodology, as described in this study, which is able to characterize the distribution of micromechanical properties within different tissues, should be of immense value in quantifying and localizing changes in the micromechanical properties of aging and diseased tissues.
Aorta and vena cava elastic modulus profiles, plotted as a function of position from the adventitia (outermost region of the blood vessel) to the intima (innermost region) are presented in Fig. 2. Within the aorta there was an approximately linear decrease in elastic modulus from the adventitial (~30 MPa) to intimal (~8 MPa) surfaces [Fig. 2(a)]. The modulus profile for the vena cava, however, was clearly nonlinear [Fig. 2(b)] and the elastic modulus was highest in the ECM-rich adventitial and intimal layers (~35 MPa) and lowest in the highly cellularized medial layer (~20 MPa).
FIG. 2.
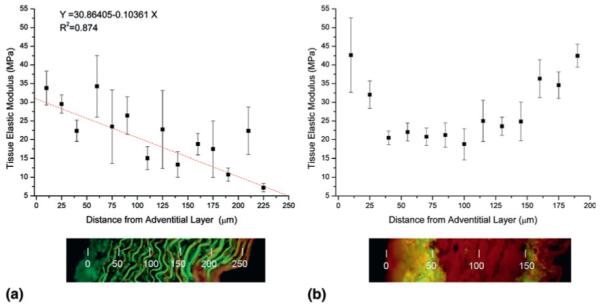
Elastic modulus, determined by nanoindentation, and histological tissue organization visualized by fluorescence microscopy of H&E stained (a) ferret aorta and (b) vena cava. The surface of the adventitia (outermost) region of the vessels is located at position zero. Error bars represent standard deviation.
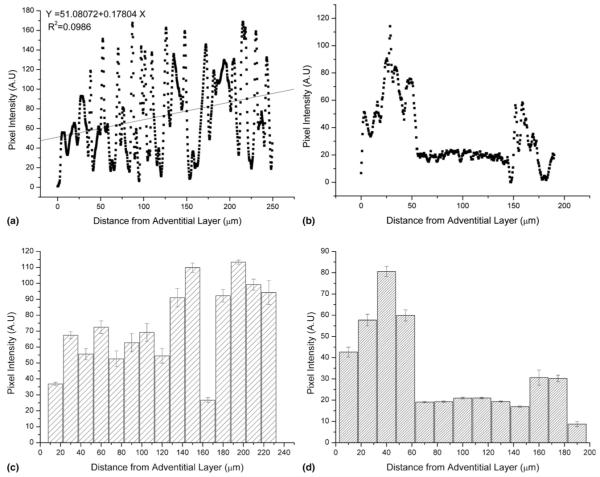
Although elastin autofluorescence may be used to visualize elastic fibers in unstained tissue sections41 the fluorescent signal is considerably enhanced by the eosin in H&E stained sections42 (Fig. 3). Therefore, this routine staining method coupled with fluorescence is comparable to differential staining methods, such as Weigert’s stain, that are used to locate elastic fiber components in tissue.43 The elastic fibers appear green with a dark background, whereas the smooth muscle cells that are situated between the fibers are not visible. The red and green fluorescence filters provide identical images as reported by de Carvalho and Tabago,42 except that the red fluorescence is less intense. Within the aorta, the elastic fiber distribution, quantified from fluorescence microscopy images of H&E stained sections [Fig. 4(a)], was inversely correlated with the linear regression obtained for the elastic modulus data [Fig. 2(a)]. In the vena cava, both the elastic modulus and the elastic fiber density were raised in the adventitial and intimal layers compared with the highly cellularized medial layer [Figs. 2(b) and 4(b)]. Large veins, such as the vena cava, are composed of the same cellular (principally endothelial cells and smooth muscle cells) and extracellular (fibrillar collagens, elastin and fibrillin) constituents as large arteries, such as the aorta. The relative abundance and distribution of these components within the vessels however, reflects the different mechanical environments experienced by arteries and veins in vivo. In the vena cava the ECM components, including elastic fibers, were found to be concentrated mainly in the adventitial and intimal layers while the central medial layer was composed predominantly of smooth muscle cells. This is evident in Fig. 3(b) where the medial layer appears much darker than the surrounding adventitia and intima. In addition, the mean elastic modulus for the vena cava (28.1 ± 8.5 MPa) was higher than the mean elastic modulus for the aorta (21.3 ± 8.0 MPa). A differential stiffness between large arteries and veins has also been identified at the whole tissue length scale.44 In their study Snowhill and co-workers suggest that the reduced compliance of the vena cava compared with the aorta is a consequence of the different physiological role required of a vessel which does not experience large pressure variations with each heart beat.
FIG. 3.
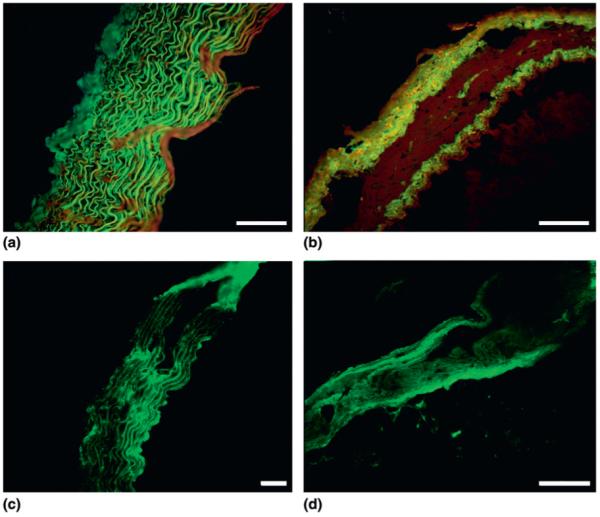
Fluorescent images showing (a) H&E stained ferret aorta section. (b) H&E stained ferret vena cava section. (c) Unstained ferret aorta section showing elastic fiber distribution due to elastin autofluorescence. (d) Unstained ferret vena cava section showing elastic fiber distribution due to elastin autofluorescence. Note the darker region in the central portion of the vena cava images, which indicates the presence of little elastin. Scale marker represents 100 μm in each image. The adventitial layer is leftmost in each image with the intimal layer rightmost.
FIG. 4.
Typical line profile showing elastic fiber fluorescence in (a) H&E stained ferret aorta section and (b) H&E stained ferret vena cava. Maximal pixel intensity was observed at the intimal surface (linear regression analysis is shown with the red line) for the aorta sample whereas for the vena cava pixel intensity was greatest at the adventitial and intimal surfaces. Mean pixel intensity binned at 15-μm intervals for (c) aorta and (d) vena cava tissue sections. Error bars indicate standard error of the mean.
The relationship between elastic modulus and fluorescence intensity is demonstrated further in Fig. 5, which correlates the elastic modulus data with the mean binned fluorescence intensity data across 15 μm [Figs. 4(c) and 4(d)]. There was a linear relationship between elastic modulus and elastic fiber density in the ECM-rich aorta and adventitial and intimal regions of the vena cava. This relationship was absent for the highly cellularized and therefore elastic fiber-poor medial layer of the vena cava. Analysis of variance (ANOVA) analysis of the slopes and intercepts of the aorta and vena cava (adventitial and intima) data adds further support to the observation that elastic modulus is inversely related to elastin fluorescence (Table I). Elastin, with an estimated in vitro elastic modulus of approximately 1.1 MPa,45 is thought to be highly compliant as compared with fibrillar collagen, for which the elastic modulus has been reported from 1.245 to 5.4 GPa.46 Our data from the aorta therefore supports the hypothesis that elastin-rich structures promote tissue compliance in situ.
FIG. 5.
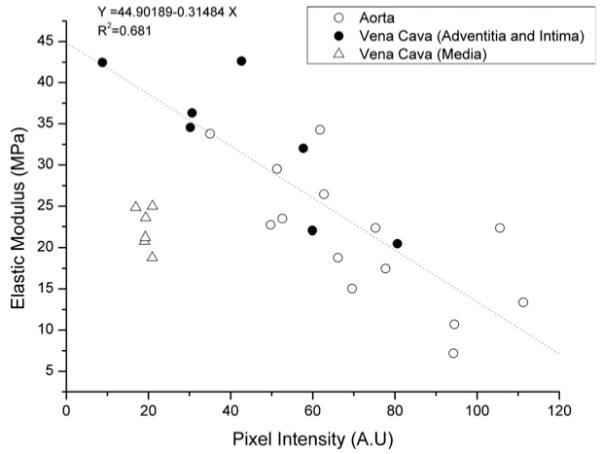
Correlation between pixel intensity and elastic modulus. Note that the elastin-rich adventitial and intimal layers of the vena cava fit the regression line, whereas the cellularized medial layer has a lower elastic modulus and elastic fiber density (fluorescence signal).
TABLE I.
Summary of regression analysis data (elastic modulus versus fluorescence intensity) for the aorta and vena cava (adventitial and intimal regions only)
| Individual regression details | |
|---|---|
| Summary | R 2 |
| Aorta | 0.510 |
| Vena cava | 0.697 |
| Slope coefficient | |
| Aorta | −0.258 |
| Vena cava | −0.312 |
| Intercept coefficient | |
| Aorta | 39.803 |
| Vena cava | 46.773 |
| Slope comparison: ANOVA | |
| F | Probability |
| 0.197 | 0.663 |
| Common slope = −0.276 | |
| Intercept comparison: ANOVA | |
| F | Probability |
| 1.788 | 0.198 |
| Common intercept = 42.478 | |
ANOVA analysis was used to test whether the two datasets shared a common slope and intercept. A common slope and intercept were calculated as the ANOVA analysis showed P > 0.05 for both the slope and intercept and therefore the null hypothesis was not rejected.
This study has demonstrated that the substrate effect on the stiffness of thin histological sections can be corrected when standard nanoindentation data are subsequently analyzed with the extended Oliver–Pharr method, accessible via the FilmDoctor software package. However, there are two issues that may have led to an overestimation of the elastic modulus values reported in this study, and these will be addressed in further work. First, the histological sections were tested using a conventional nanoindentation setup and thus it was not possible to keep the sections hydrated throughout the duration of the test. Dehydration stiffens blood vessels and affects the properties of elastin, e.g., see Ref. 47. Second, a nominal thickness of 5 μm was used for the purposes of the elastic modulus calculations. This was based on the sectioning thickness of the microtome. We have found that by using a lower thickness for the calculations, the elastic modulus values are significantly lower, e.g., for an indent for which we determine an elastic modulus of 40 MPa assuming a 5-μm section thickness, we obtain a value of 25 MPa if the section thickness is taken as 4 μm. The general trends and correlation with histology remain, however, and future studies will investigate hydrated tissue sections and also look at methods of independent thickness verification. With the use of absolute thickness values, there may be a greater correlation between the elastic modulus and pixel intensity (Fig. 5). Although published studies on the effects of freezing on the mechanical properties of blood vessels have yet to reach a consensus,48,49 steps were taken in this study to minimize the possibility of post-cryopreservation artifacts by immersion in supercooled isopentane. In addition, indentation experiments were performed on dehydrated tissue samples, thereby further reducing the effects of freezing on tissue mechanics.
OCT compound, which was used to prepare the tissue sections, is composed of water-soluble glycols and resins and was used only to support the tissue for sectioning. It is a noninfiltrating supporting media and when the tissue is sectioned it is not present on the tissue surface. Thus, it is not thought to affect the mechanical properties of the tissue in any way.
We are not aware of any other studies that report the mechanical properties of vascular tissue at the resolution given in this study. In general, measured elastic moduli decrease with increasing length scale (Fig. 6). With the exception of elastin for example, microfibrillar fibrillin and fibrillar collagen have moduli of ~70-90 MPa and >1000 MPa, respectively, at the molecular level.11,45 Macroscopic tissue sections of aorta, however, have an elastic modulus of ~0.17-4 MPa.50,51 Our results suggest that at an intermediate microscopic length scale, the aorta has a modulus in the region of 10-30 MPa. Further investigations using more precise thickness measurements and hydrated specimens may help to define the elastic modulus of vascular tissues with greater accuracy. Our current work has not related the micromechanical properties of the tissue sections to its in vivo properties. We hope to address this in future studies by investigating the relationship between the mechanical properties determined using histological sections with ex vivo techniques, such as wire myography.52 Wire myography is commonly used by clinicians to provide a measure of arterial stiffness. We will thereby be able to determine how reflective the nanoindentation data are on in vivo properties of the blood vessels.
FIG. 6.
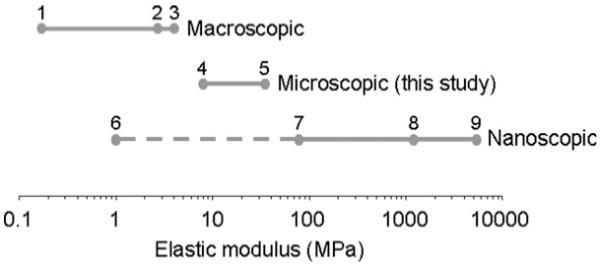
Elastic moduli of aorta and ECM components estimated at macroscopic, microscopic, and nanoscopic (molecular) length scales. With the exception of elastin, the component ECM molecules are stiffer than the microscopic tissue structures tested in this study. These microscopic structures are, in turn, stiffer than macroscopic regions of the whole tissue. The references for the values in this figure are taken from: 1. Gozna et al.,50 2. Reddy.,51 3. Laurent et al.,55 4 and 5. values from this study, 6. Gosline45 (elastin), 7. Sherratt et al.11 (fibrillin microfibrils), 8. Gosline et al.45 (fibrillar collagen), and 9. Yang et al.46 (single collagen fibrils).
The extended Oliver and Pharr method has been validated for cases such as a hard coating on a softer substrate35 and for a soft coating on a harder substrate.53,54 We intend to conduct further calibration experiments by indenting extremely low stiffness materials such as hydrogels where the elastic modulus obtained from bulk (thick) hydrogel samples will be compared to that obtained from spin-coated thin layers of the same hydrogel following analysis with the extended Oliver and Pharr method.
Nanoindentation of thin tissue sections is therefore a promising technique for the determination of localized micromechanical properties within tissues, which overcomes many of the difficulties of indenting thick (bulk) tissue sections. Working with histological sections has the added advantage that micromechanical data can be correlated with data obtained with a range of histology techniques, e.g., the same unstained section can be used for elastin detection by fluorescence microscopy as well as for indentation. The application of such approaches has the potential to not only shed light on the function of individual components within healthy tissues but also to characterize the differential loss of elasticity within aged and diseased tissues.
IV. CONCLUSIONS
The elastic modulus of thin histological sections of tissue can be determined with a standard nanoindentation methodology coupled with subsequent analysis with the extended Oliver and Pharr method, which uses the effective indenter concept. The micromechanical-property data have been correlated with tissue histology. For the aorta and ECM-rich regions of the vena cava a decrease in elastic modulus was inversely correlated with elastic fiber density, whereas in the cellular medial layer of the vena cava, the modulus remained relatively constant.
ACKNOWLEDGMENTS
The authors are grateful to Nick Bierwisch, Marcus Fuchs, and Lars Geidel of SIO for their technical assistance. H.K. Graham is supported by a British Heart Foundation project grant. M.J. Sherratt is a Research into Ageing Senior Research Fellow. The authors thank EPSRC for funding this study through Grant References EP/E015549/1 and EP/F028431/1.
Contributor Information
R. Akhtar, School of Materials, University of Manchester, Manchester M1 7HS, United Kingdom.
N. Schwarzer, Saxonian Institute of Surface Mechanics (SIO), Ummanz 18569, Germany
M.J. Sherratt, Tissue Injury and Repair Group, Faculty of Medical and Human Sciences, University of Manchester, Manchester M13 9PT, United Kingdom
R.E.B. Watson, Dermatological Sciences Research Group, Faculty of Medical and Human Sciences, University of Manchester, Manchester M13 9PT, United Kingdom
H.K. Graham, Unit of Cardiac Physiology, Division of Cardiovascular and Endocrine Sciences, University of Manchester, Manchester M13 9NT, United Kingdom
A.W. Trafford, Unit of Cardiac Physiology, Division of Cardiovascular and Endocrine Sciences, University of Manchester, Manchester M13 9NT, United Kingdom
P.M. Mummery, School of Materials, University of Manchester, Manchester M1 7HS, United Kingdom
B. Derby, School of Materials, University of Manchester, Manchester M1 7HS, United Kingdom
REFERENCES
- 1.Glasser SP, Arnett DK, McVeigh GE, Finkelstein SM, Bank AJ, Morgan DJ, Cohn JN. Vascular compliance and cardiovascular disease: A risk factor or a marker? Amer. J. Hyper. 1997;10:1175. doi: 10.1016/s0895-7061(97)00311-7. [DOI] [PubMed] [Google Scholar]
- 2.Escolar JD, Tejero C, Escolar MA, Montalvo F, Garisa R. Architecture, elastic fiber, and collagen in the distal air portion of the lung of the 18-month-old rat. Anat. Rec. 1997;248:63. doi: 10.1002/(sici)1097-0185(199705)248:1<63::aid-ar7>3.3.co;2-s. [DOI] [PubMed] [Google Scholar]
- 3.Bailey AJ. Molecular mechanisms of aging in connective tissues. Mech. Ageing Dev. 2001;122:735. doi: 10.1016/s0047-6374(01)00225-1. [DOI] [PubMed] [Google Scholar]
- 4.Aoun S, Blacher J, Safar ME, Mourad JJ. Diabetes mellitus and renal failure: Effects on large artery stiffness. J. Hum. Hyper. 2001;15:693. doi: 10.1038/sj.jhh.1001253. [DOI] [PubMed] [Google Scholar]
- 5.Boutouyrie P, Tropeano AI, Asmar R, Gautier I, Benetos A, Lacolley P, Laurent S. Aortic stiffness is an independent predictor of primary coronary events in hypertensive patients: A longitudinal study. Hypertension. 2002;39:10. doi: 10.1161/hy0102.099031. [DOI] [PubMed] [Google Scholar]
- 6.Cruickshank K, Riste L, Anderson SG, Wright JS, Dunn G. Aortic pulse-wave velocity and its relationship to mortality in diabetes and glucose intolerance: An integrated index of vascular function? Circulation. 2002;106:2085. doi: 10.1161/01.cir.0000033824.02722.f7. [DOI] [PubMed] [Google Scholar]
- 7.Kimoto E, Shoji T, Shinohara K, Hatsuda S, Mori K, Fukumoto S, Koyama H, Emoto M, Okuno Y, Nishizawa Y. Regional arterial stiffness in patients with type 2 diabetes and chronic kidney disease. J. Am. Soc. Nephrol. 2006;17:2245. doi: 10.1681/ASN.2005101038. [DOI] [PubMed] [Google Scholar]
- 8.Ashley EA, Niebauer J. Cardiology Explained. Remedica, UK: 2003. p. 22. [PubMed] [Google Scholar]
- 9.World Health Organization . The World Health Report 2006—Working Together for Health. WHO; Geneva, Switzerland: 2006. [Accessed July 27, 2008]. Available at: http://www.who.int/whr/2006/en. [Google Scholar]
- 10.Cattell MA, Anderson JC, Hasleton PS. Age-related changes in amounts and concentrations of collagen and elastin in normotensive human thoracic aorta. Clin. Chim. Acta. 1996;245:73. doi: 10.1016/0009-8981(95)06174-6. [DOI] [PubMed] [Google Scholar]
- 11.Sherratt MJ, Baldock C, Haston JL, Holmes DF, Jones CJP, Shuttleworth CA, Wess TJ, Kielty CM. Fibrillin microfibrils are stiff reinforcing fibres in compliant tissues. J. Mol. Biol. 2003;332:183. doi: 10.1016/s0022-2836(03)00829-5. [DOI] [PubMed] [Google Scholar]
- 12.Sherratt MJ, Bastrilles JY, Bowden JJ, Watson REB, Griffiths CEM. Age-related deterioration in the mechanical function of human dermal fibrillin microfibrils. Brit. J. Derm. 2006;155:240. [Google Scholar]
- 13.Rho J-Y, Roy ME, Tsui TY, Pharr GM. Elastic properties of microstructural components of human bone as measured by nanoindentation. J. Biomed. Mater. Res. 1999;A45:48. doi: 10.1002/(sici)1097-4636(199904)45:1<48::aid-jbm7>3.0.co;2-5. [DOI] [PubMed] [Google Scholar]
- 14.Rho J-Y, Zioupos P, Currey JD, Pharr GM. Variations in the individual thick lamellar properties within osteons by nanoindentation. Bone. 1999;25:295. doi: 10.1016/s8756-3282(99)00163-5. [DOI] [PubMed] [Google Scholar]
- 15.Rho J-Y, Pharr GM. Effects of drying on the mechanical properties of bovine femur measured by nanoindentation. J. Mater. Sci. Mater. Med. 1999;10:485. doi: 10.1023/a:1008901109705. [DOI] [PubMed] [Google Scholar]
- 16.Rho J-Y, Zioupos P, Currey JD, Pharr GM. Microstructural elasticity and regional heterogeneity in human femoral bone of various ages examined by nano-indentation. J. Biomech. 2002;35:189. doi: 10.1016/s0021-9290(01)00199-3. [DOI] [PubMed] [Google Scholar]
- 17.Bushby AJ, Ferguson VL, Boyde A. Nanoindentation of bone: Comparison of specimens tested in liquid and embedded in polymethylmethacrylate. J. Mater. Res. 2004;19:249. [Google Scholar]
- 18.Bembey AK, Oyen ML, Bushby AJ, Boyde A. Viscoelastic properties of bone as a function of hydration state determined by nanoindentation. Philos. Mag. 2006;86:5691. [Google Scholar]
- 19.Oyen ML. Poroelastic nanoindentation responses of hydrated bone. J. Mater. Res. 2008;23:1307. [Google Scholar]
- 20.VanLandingham MR, Villarrubia JS, Guthrie WF, William F, Meyers GF. Nanoindentation of polymers: An overview. Macromol. Symp. 2001;167:15. [Google Scholar]
- 21.Gupta S, Carrillo F, Balooch M, Pruitt L, Puttlitz C. Simulated soft tissue nanoindentation: A finite element study. J. Mater. Res. 2005;20:1979. [Google Scholar]
- 22.Carrillo F, Gupta S, Balooch M, Marshall SJ, Marshall GW, Pruitt L, Puttlitz CM. Nanoindentation of polydimethylsiloxane elastomers: Effect of crosslinking, work of adhesion, and fluid environment on elastic modulus. J. Mater. Res. 2005;20:2820. [Google Scholar]
- 23.Ebenstein DM, Pruitt LA. Nanoindentation of soft hydrated materials for application to vascular tissues. J. Biomed. Mater. Res. A. 2004;69:222. doi: 10.1002/jbm.a.20096. [DOI] [PubMed] [Google Scholar]
- 24.Sherratt MJ, Wess TJ, Baldock C, Ashworth JL, Purslow PP, Shuttleworth CA, Kielty CM. Fibrillin-rich microfibrils of the extracellular matrix: Ultrastructure and assembly. Micron. 2001;32:185. doi: 10.1016/s0968-4328(99)00082-7. [DOI] [PubMed] [Google Scholar]
- 25.Alberts B, Johnson A, Lewis J, Raff M, Roberts K, Walter P. Molecular Biology of the Cell. 4th ed. Garland Publishing; New York: 2002. [Google Scholar]
- 26.Tsui TY, Pharr GM. Substrate effects on nanoindentation mechanical property measurement of soft films on hard substrates. J. Mater. Res. 1999;14:292. [Google Scholar]
- 27.Schwarzer N. Elastic surface deformation due to indenters with arbitrary symmetry of revolution. J. Phys. D: Appl. Phys. 2004;37:2761. [Google Scholar]
- 28.Akhtar R, Sherratt MJ, Bierwisch N, Derby B, Mummery PM, Watson REB, Schwarzer N. Nanoindentation of histological specimens using an extension of the Oliver and Pharr method. In: Checa AG, Popoola OO, Rekow ED, Zhou J, editors. Mechanical Behavior of Biological Materials and Biomaterials; Mater. Res. Soc. Symp. Proc.; Warrendale, PA. 2008; 1097E, GG01. [Google Scholar]
- 29.Oliver WC, Pharr GM. An improved technique for determining hardness and elastic modulus using load and displacement sensing indentation experiments. J. Mater. Res. 1992;7:1564. [Google Scholar]
- 30.Chudoba T, Herrmann K. Methods for the determination of the real tip shape of Vickers and Berkovich indenters. Härtereitechnische Mitteilungen, HTM. 2001;56:258. [Google Scholar]
- 31.Bolshakov A, Oliver WC, Pharr GM. An explanation for the shape of nanoindentation unloading curves based on finite element simulation. In: Baker SP, Ross CA, Townsend PH, Volkert CA, Borgesen P, editors. Thin Films: Stresses and Mechanical Properties V; Mater. Res. Soc. Symp. Proc.; Pittsburgh, PA. 1995; p. 75. 356. [Google Scholar]
- 32.Pharr GM, Bolshakov A. Understanding nanoindentation unloading curves. J. Mater. Res. 2002;17:2660. [Google Scholar]
- 33.Schwarzer N, Pharr GM. On the evaluation of stresses during nanoindentation with sharp indenters. Thin Solid Films. 2004;469-470:194. [Google Scholar]
- 34.Schwarzer N, Chudoba T, Pharr GM. On the evaluation of stresses in coated materials during nanoindentation with sharp indenters. Surf. Coat. Technol. 2006;200:4220. [Google Scholar]
- 35.Schwarzer N, Chudoba T, Richter F. Investigation of ultra thin coatings using nanoindentation. Surf. Coat. Technol. 2006;200:5566. [Google Scholar]
- 36.Schwarzer N. Analysing nanoindentation unloading curves using Pharr’s concept of the effective indenter shape. Thin Solid Films. 2006;494:168. [Google Scholar]
- 37.Schwarzer N. The extended Hertzian theory and its uses in analyzing indentation experiments. Philos. Mag. 2006;86:5179. [Google Scholar]
- 38.Schwarzer N. Arbitrary load distribution on a layered half space. ASME J. Triol. 2000;122:672. [Google Scholar]
- 39.The Oliver and Pharr method for coatings, software demonstration package. [Accessed July 28, 2008]. Available at: www.siomec.de/O&PfC-DEMO.
- 40.Jorgensen CS, Knauss D, Hager H, Briggs GAD. Sonography and quantitative measurements. IEEE Eng. Med. Biol. Mag. 1996;15:35. [Google Scholar]
- 41.Blomfield J, Farrar JF. Fluorescence spectra of arterial elastin. Biochem. Biophys. Res. Commun. 1967;28:346. doi: 10.1016/0006-291x(67)90316-6. [DOI] [PubMed] [Google Scholar]
- 42.de Carvalho HF, Taboga SR. Fluorescence and confocal laser scanning microscopy imaging of elastic fibers in hematoxylin-eosin stained sections. Histochem. Cell Biol. 1996;106:587. doi: 10.1007/BF02473274. [DOI] [PubMed] [Google Scholar]
- 43.Deeb S, Nesr KH, Mahdy E, Badawey M, Badei M. Autofluorescence of routinely hematoxylin and eosin- stained sections without exogenous markers. Afr. J. Biotechnol. 2008;7:504. [Google Scholar]
- 44.Snowhill PB, Silver FH. A mechanical model of porcine vascular tissues—Part II: Stress–strain and mechanical properties of juvenile porcine blood vessels. Cardiovasc. Eng. 2005;5:157. [Google Scholar]
- 45.Gosline J, Lillie M, Carrington E, Guerette P, Ortlepp C, Savage K. Elastic proteins: Biological roles and mechanical properties. Philos. Trans. R. Soc. London, Ser. B: Biol. Sci. 2002;357:121. doi: 10.1098/rstb.2001.1022. [DOI] [PMC free article] [PubMed] [Google Scholar]
- 46.Yang L, van der Werf KO, Koopman BFJM, Subramaniam V, Bennink ML, Dijkstra PJ, Feijen J. Micromechanical bending of single collagen fibrils using atomic force microscopy. J. Biomed. Mater. Res. A. 2007;82:160. doi: 10.1002/jbm.a.31127. [DOI] [PubMed] [Google Scholar]
- 47.Lillie MA, Gosline JM. The effects of hydration on the dynamic mechanical properties of elastin. Biopolymers. 1990;29:1147. doi: 10.1002/bip.360290805. [DOI] [PubMed] [Google Scholar]
- 48.Venkatasubramanian RT, Grassl ED, Barocas VH, Victor H, Lafontaine D, Bischof JC. Effects of freezing and cryopreservation on the mechanical properties of arteries. Ann. Biomed. Eng. 2006;34:823. doi: 10.1007/s10439-005-9044-x. [DOI] [PubMed] [Google Scholar]
- 49.Adham M, Gournier JP, Favre JP, De La Roche E, Ducerf C, Baulieux J, Barral X, Pouyet M. Mechanical characteristics of fresh and frozen human descending thoracic aorta. J. Surg. Res. 1996;64:32. doi: 10.1006/jsre.1996.0302. [DOI] [PubMed] [Google Scholar]
- 50.Gozna ER, Marble AE, Shaw AJ, Winter DA. Mechanical properties of the ascending thoracic aorta of man. Cardiovasc. Res. 1973;7:261. doi: 10.1093/cvr/7.2.261. [DOI] [PubMed] [Google Scholar]
- 51.Reddy GK. Age-related cross-linking of collagen is associated with aortic wall matrix stiffness in the pathogenesis of drug-induced diabetes in rats. Microvasc. Res. 2004;68:132. doi: 10.1016/j.mvr.2004.04.002. [DOI] [PubMed] [Google Scholar]
- 52.Kelly CJG, Speirs A, Gould GW, Petrie JR, Lyall H, Connell JMC. Altered vascular function in young women with polycystic ovary syndrome. J. Clin. Endocrinol. Metab. 2002;87:742. doi: 10.1210/jcem.87.2.8199. [DOI] [PubMed] [Google Scholar]
- 53.Kohl JG, Singer IL, Schwarzer N, Yu VY. Effect of bond coat modulus on the durability of silicone duplex coatings. Prog. Org. Coat. 2006;56:220. [Google Scholar]
- 54.Herrmann M, Schwarzer N, Richter F, Frühauf S, Schulz SE. Determination of Young’s modulus and yield stress of porous low-k materials by nanoindentation. Surf. Coat. Technol. 2006;201:4305. [Google Scholar]
- 55.Laurent S, Girerd X, Mourad JJ, Lacolley P, Beck L, Boutouyrie P, Mignot JP, Safar M. Elastic modulus of the radial artery wall material is not increased in patients with essential hypertension. Arterioscler Thromb. 1994;14:1223. doi: 10.1161/01.atv.14.7.1223. [DOI] [PubMed] [Google Scholar]


