Abstract
In this paper, we propose a novel automated pipeline for extraction of sulcal fundi from triangulated cortical surfaces. This method consists of four consecutive steps. Firstly, we adopt a finite difference method to estimate principal curvatures, principal directions and curvature derivatives, along the principal directions, for each vertex. Then, we detect the sulcal fundi segment in each triangle of the cortical surface based on curvatures and curvature derivatives. Afterwards, we link the sulcal fundi segments into continuous curves. Finally, we connect breaking sulcal fundi and smooth bumping sulcal fundi by using the fast marching method on the cortical surface. The proposed method can find the accurate sulcal fundi using curvatures and curvature derivatives without any manual interaction. The method was applied to ten normal brain MR images on inner cortical surfaces. We quantitatively evaluated the accuracy of the sulcal fundi extraction method using manually labeled sulcal fundi by experts. The average difference between automatically extracted major sulcal fundi and the expert labeled results is consistently around 1.0 mm on ten subject images, indicating the good performance of the proposed method.
Keywords: sulcal fundi extraction, cortical surface, geodesic path, fast marching on manifold, maximum principal curvature
1 Introduction
The human cerebral cortex is a highly convoluted and complex structure consisting of sulci and gyri, corresponding to valleys and ridges on the cortical surface respectively. Although the underlying mechanisms of forming sulci and gyri still remains unclear, it is believed that many factors are involved in the cortex folding development, including neuronal proliferation, migration and differentiation, glial cell proliferation, programmed cell death, axon development and so on. Several major cortical sulci and gyri, which are formed early in neurodevelopment, are common anatomical landmarks in human brains, even though the cortical folding pattern of sulci and gyri geometry varies greatly across individuals (Ono et al., 1990). Thus, major sulci have been extensively used for serving as landmarks in deformable registration of MR brain images (Thompson and Toga, 1996; Davatzikos, 1997; Collins et al., 1998; Vaillant and Davatzikos, 1999; Hellier and Barillot, 2003) and analyzing the variation of healthy human brain (Mangin et al., 2004a, 2004b; Fillard et al., 2007; Lohmann et al., 2008; Durrleman et al., 2007; Sun et al., 2007) as well as finding out the difference between normal brains and diseased ones (Ashburner et al., 2003).
Since it is extremely time consuming to precisely manually label sulci, even for experienced neuroanatomists, automatic sulci extraction has received increasing attention as a research goal in recent years. A wide variety of methods have been proposed for extraction of sulci or sulcal fundi, which are 3D curves along the bottom of sulcal regions of cortical surface, either on MR volumetric images (Vaillant and Davatzikos, 1997; Lohmann, 1998; Le Goualher et al., 1999; Zhou et al., 1999; Zeng et al., 1999; Lohmann and von Cramon, 2000; Tu et al., 2007) or reconstructed cortical surfaces (Khaneja et al., 1998; Renault et al., 2000; Bartesaghi and Sapiro, 2001; Tao et al., 2002; Cachia et al., 2003a; Lui et al., 2006; Kao et al., 2007; Shi et al., 2008; Li et al., 2008; Li et al., 2009; Shattuck et al., 2009). Since this paper concentrates on the sulcal fundi extraction, a few of the existing methods for sulcal fundi extraction are summarized here. Skeletonization based methods and curve tracking based methods are among the most commonly used techniques for sulcal fundi extraction. In skeletonization based methods on volumetric images, people usually use 3D thinning method on gray matter (GM) and cerebro-spinal fluid (CSF) tissue maps to extract sulcal medial surface (Lohmann, 1998; Le Goualher et al., 1999; Zhou et al., 1999; Rivière et al., 2002), and then find the deepest boundary away from the outer hull of the cortical surface as sulcal fundi (Lohmann, 1998; Le Goualher et al., 1999). On cortical surfaces, people typically firstly distinguish surfaces between sulcal regions and gyral regions using thresholding (Kao et al., 2007), deformable surface model (Rettmann, et al., 2002) or graph cut (Shi et al., 2008) methods on the mean curvature map (Shi et al., 2008) or sulcal depth map (Rettmann, et al., 2002; Kao et al., 2007), and then adopt erosion-like method to iteratively remove points to extract the skeleton of sulcal region as sulcal fundi. However, skeletonization based methods strongly rely on sulcal region segmentation results, thus this kind of methods are inherently sensitive to small noise and tiny change on segmented sulcal regions might affect the final skeletonization results significantly. In addition, skeletonization based methods assume that the sulcal regions are symmetric around sulcal fundi. However, this assumption may not always hold. Embedding curvature or sulcal depth information in the procedure of skeletonization might help achieve more accurate results. In curve tracking based methods, people typically adopt dynamic programming (Khaneja et al., 1998; Shattuck, et al., 2009), fast marching on triangulated meshes (Bartesaghi and Sapiro, 2001; Tao et al., 2001, 2002) or tracking along the principal directions (Renault et al., 2000; Lui et al., 2006;) to generate the minimal weighted geodesic path between start, intermediate and end points as the extracted sulcal fundi. The weight at each point is set based on curvature, convexity and sulcal depth information such that the geodesic path favors passing through the sulcal fundi points. However, the users have to very accurately manually position some points at the desired sulcal fundi position, thus this category of methods subject to inter-rater variation. Some of above mentioned two categories of methods require computing the sulcal depth away from the outer hull or level 0 of the cortex, which is sometimes difficult to accurately define because the cortex can be concave even though it is normally obtained by morphological closing (Lohmann and von Cramon, 2000; Rivière et al., 2002; Kao et al., 2007) or deformable surface model (Rettmann, et al., 2002).
Since the cortical folding varies greatly across individuals, given a population of human brain MR images, there inherently exist multiple cortical folding patterns in the heterogeneous population. Because major sulcal fundi are believed to be one of the most reliable features of cortical folding pattern and many sulcal fundi are thought to be associated with the boundaries of functional and cytoarchitectonic cortical regions, (for example, the central sulcal fundi separate the primary motor cortex belonging to frontal lobe from the primary somatosensory cortex belonging to the parietal lobe), therefore, the composition of a network of sulcal fundi has relatively good representation of global cortical shape, and the configuration of cortical sulcal fundi network can be used to analyze the variability of cortical folding in a large population of human brains. This study might help future research in classification of global folding patterns and stratification of brain images into subpopulations. There already exist some researches on pattern discovering in a population of human brain images. Blezek and Miller 2007 developed an atlas stratification method to infer multiple MR brain atlases in a population of subjects in contrast to the traditional method that assume a single atlas for the whole population, and to infer which subjects should be used to construct the atlas for each sub-population, by adopting the mean shift method to perform clustering in the population. Sabuncu et al. recently proposed a method iCluster for discovering patterns from a MR image population through mixture modeling. These methods performed voxel-wise comparing of a pair of images based on the intensity, as a result, they did not explicitly consider comparing anatomical corresponding structures. To facilitate the above mentioned large scale study of the variability of cortical folding pattern, computational methods for extraction of sulcal fundi in an automated and accurate manner are much needed.
Motivated by the above specific requirement, in this paper, we propose a novel automatic pipeline for accurate extraction of sulcal fundi from triangulated cortical surfaces. Our pipeline for sulcal fundi extraction is composed of four steps, as summarized in Figure 1. Firstly, we adopt a robust finite differences method to estimate principal curvatures, principal directions and curvature derivatives along the principal directions for each vertex. Then, we detect the sulcal fundi segment in each triangle of the surface based on curvatures and curvature derivatives. Afterwards, we link the sulcal fundi segments into continuous curves, and combine adjacent sulcal fundi curves caused by numerical estimation error. Finally, we connect the breaking sulcal fundi curves and smooth bumping sulcal fundi using the fast marching method on the cortical surface. We applied the proposed sulcal fundi extraction method to ten normal brain MR images on the inner cortical surface (the interface between gray matter and white matter). We quantitatively evaluated and validated the sulcal fundi extraction method by using manually labeled sulcal fundi by two experts as the standard. The average difference between automatically extracted major sulcal fundi and the manual labeled results is consistently around 1.0 mm on the ten subjects, indicating the relatively good performance of the proposed method. Some preliminary results of this work were shown in Li et al. 2008.
Fig. 1.
The flow chart of the proposed sulcal fundi extraction pipeline.
2 Methods
2.1 Estimating curvatures and curvature derivatives
Curvatures and their derivatives are fundamental properties for cortical surface analysis in our method. However, due to the non-uniform distribution of surface vertices and their neighborhoods, it is not straightforward to estimate them accurately. Herein, we adopt a robust and efficient method to estimate curvatures and curvature derivatives as described in Rusinkiewicz, 2004. The basic idea is that before estimating the property (curvature and their derivatives) at each vertex, the property in each triangle face is calculated. Then the property at each vertex is computed as a weighted average of the properties in one ring adjacent faces (Rusinkiewicz, 2004).
Given a 2D triangulated cortical surface embedded in 3D space, the normal curvature, which represents how the normal direction changes from vertex to vertex, is the reciprocal of the circle that best approximates a normal slice of the surface in a given direction. The normal curvature c varying with the given direction can be estimated as:
| (1) |
where v is a unit vector in the tangent plane, and Π is the symmetric 2 × 2 Weingarten matrix. The eigenvalues and eigenvectors of the Weingarten matrix are the principal curvatures and principal directions which correspond to the value and directions where the normal curvatures achieve maximum and minimum respectively.
Instead of estimating the Weingarten matrix at each vertex directly, we estimate the Weingarten matrix at each triangle face first. Given an orthonormal coordinate system (u, v) in tangent plane, the Weingarten matrix is defined as the directional derivatives of the surface normal vector n :
| (2) |
The derivative of normal vector in a direction s in tangent plane can be computed by multiplying the Weingarten matrix with the direction vector: Πs = Dsn (Rusinkiewicz, 2004).
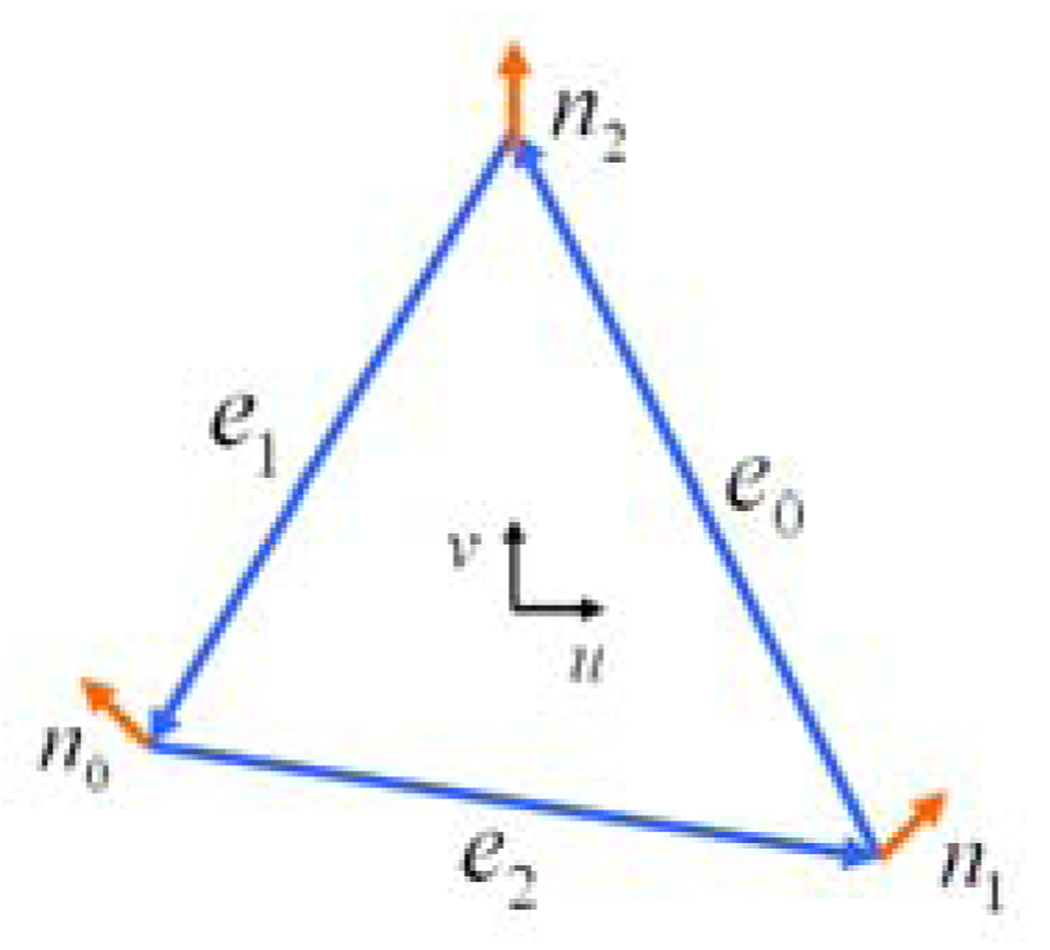
Given a triangle in which we have three well-defined directions (the edges) together with the differences in normal vectors of those directions (Rusinkiewicz, 2004) (see Figure 2), we have three constraints on the Weingarten matrix (Rusinkiewicz, 2004):
| (3) |
Fig. 2.
Illustration of the directions and normal vectors in a triangle face.n0, n1 and n2 represent the normal vectors.
Thus, we can estimate the elements in Weingarten matrix of the triangle face using the least-square method.
Once we obtain the Weingarten matrix expressed in the (uf, vf) coordinate system in each face, we need to average it with contributions from adjacent triangles. As each vertex has its own orthonormal coordinate system, we transform the Weingarten matrix into the vertex coordinate system. The first component in Weingarten matrix expressed in (up, vp) coordinate system is computed as:
| (4) |
We can obtain and similarly.
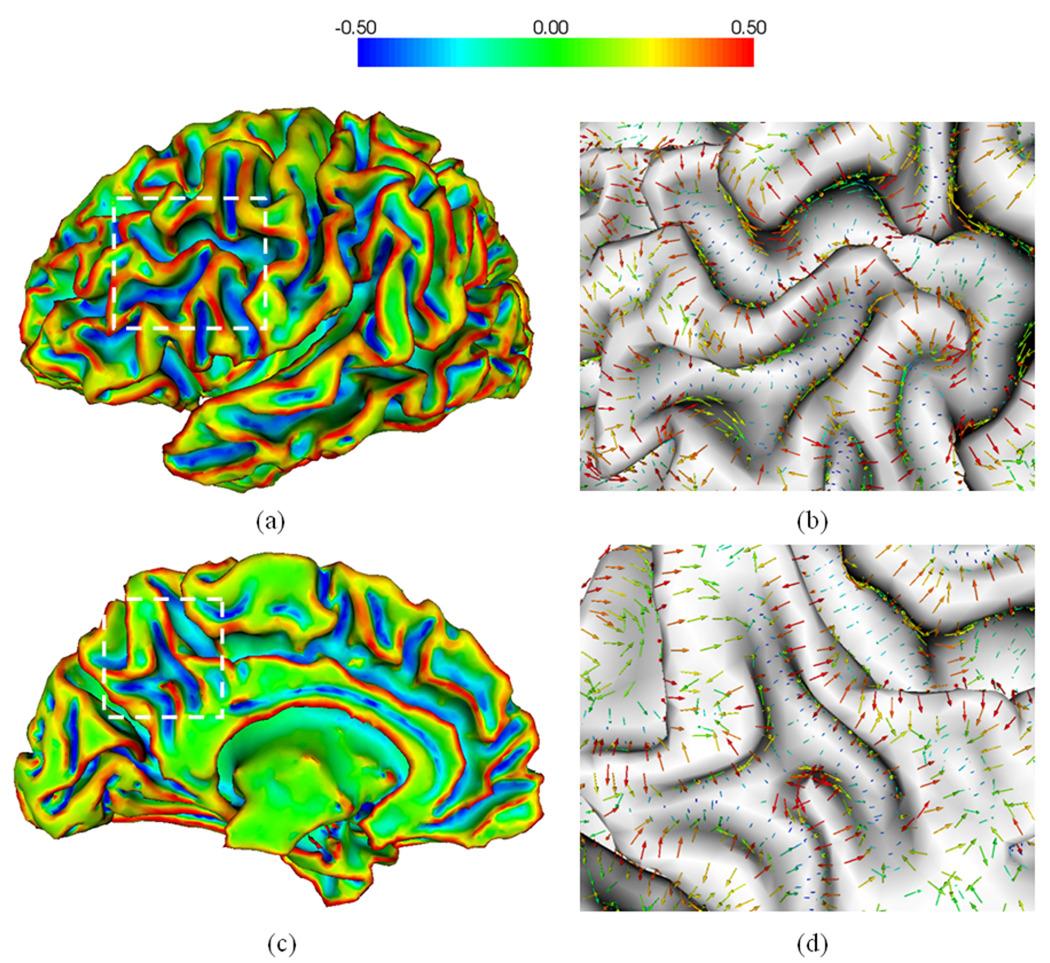
To decide the weighting accumulation from adjacent triangles, we use the Voroni area weighting method (Rusinkiewicz, 2004), in which wf ,p is set to be portion of the area of face f lying closest to vertex p . Once we obtained the Weingarten matrix at each vertex, we estimate the principal curvatures and principal directions at each vertex by computing the eigenvalues and eigenvectors of the Weingarten matrix. Similarly, we can estimate the curvature derivatives at each vertex. Figure 3 shows an example of the estimated maximum principal curvatures (the curvature with maximum absolute value of the two principal curvatures) and their corresponding principal directions on a cortical inner surface.
Fig. 3.
An example of the estimated maximum principal curvatures and their corresponding principal directions on a cortical inner surface. (a) is the lateral view of the surface; (c) is the medial view of the surface. (a) and (c) are maximum principal curvature maps; (b) and (d) are zoomed views of principal directions overlaid on the surface in the rectangular regions in (a) and (c) respectively. The color bar is shown on the top.
2.2 Detection of sulcal fundi segments
With the estimated curvatures and curvature derivatives on the cortical surface, we are ready to determine whether each triangle contains sulcal fundi segments or not. To detect the sulcal fundi segments, we adopt a method similar to the one originally developed for ridge and valley detection on triangular meshes (Thirion et al., 1996; Ohtake et al., 2004).
Given a triangulated cortical surface, denote the maximum and minimum principal curvatures be cmax and cmin at a vertex (subject to the constraint: |cmax|>= |cmin|), and the corresponding principal directions be pmax and pmax, where p is a unit vector in the tangent plane. Denote dmax = ∂cmax/∂pmax as directional derivative of cmax along with the direction pmax. The criterion for sulcal fundi point detection is formulated as:
| (5) |
It means that sulcal fundi points are located where the maximum principal curvature cmax are negative values, and where the first order directional derivative of cmax vanishes (zero-crossing of dmax) and the second order directional derivative of cmax reaches positive values. Given a triangle in a cortical surface (denote the three vertices as v1, v2 and v3respectively), we check whether or not the triangle contains sulcal fundi segments by inspecting whether the three edges contain sulcal fundi points. Without loss of generality, we take the edge linked by v1and v2as an instance. Firstly, as the maximum principal curvatures cmax at sulcal regions reach large negative values (see Figure 3), we inspect cmax at vertices v1 and v2 to ensure that:
| (6) |
Then, we check whether the edge contains the first order directional derivative of point where cmax vanishes (zero-crossing of dmax) with the following formula:
| (7) |
Since the maximum principal direction is not unique at each vertex (because the opposite direction of the principal direction can also be treated as a principal direction), the estimated principal curvature derivatives can be positive or negative. To enforce the principal direction point towards sulcal root regions, we flip the sign of dmax(v) and the corresponding maximum principal direction if dmax(v) is positive. Then, to ensure that the edge contains true sulcal fundi point, another condition that the maximum principal curvature cmax should decrease along the edge, should be satisfied:
| (8) |
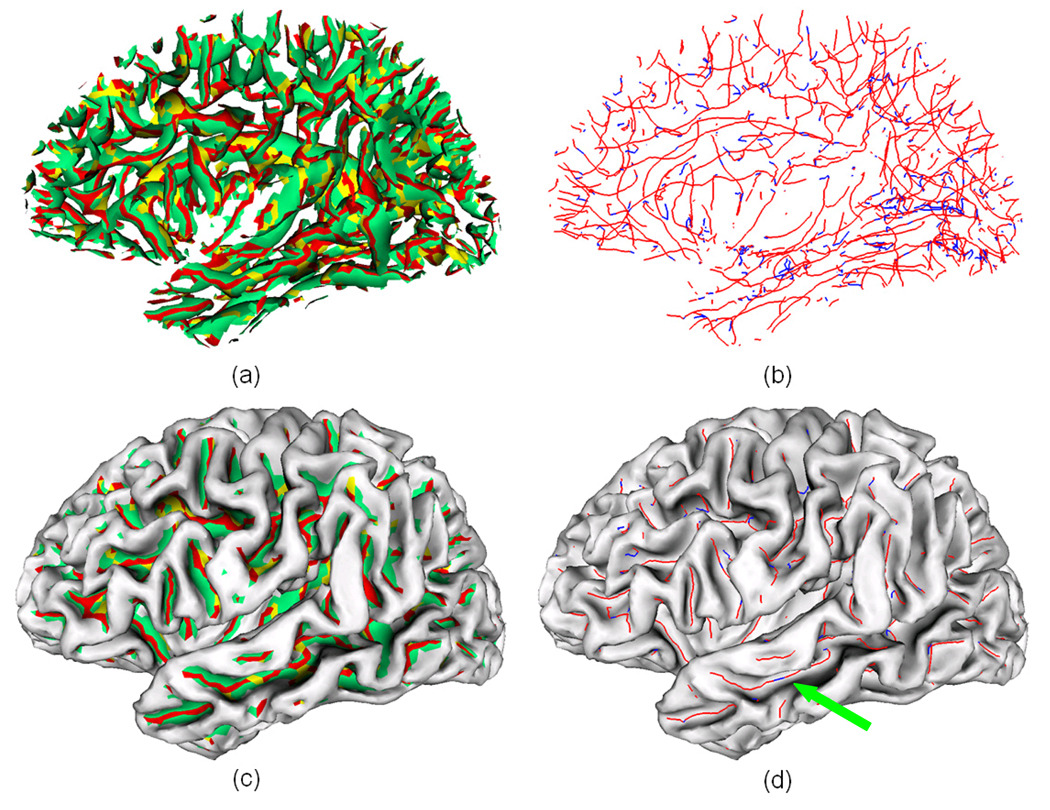
If the edge passes the above three conditional checks, a strict sulcal fundi point is found on the edge. But, if the edge passes only the first two conditional checks, a candidate sulcal fundi point is found on the edge. We will explain why we distinguish strict and candidate sulcal fundi points later in Figure 4. Then, we calculate the exact position of the sulcal fundi point on the edge with the linear interpolation method (Thirion et al., 1996; Ohtake et al., 2004):
| (9) |
Fig. 4.
Illustration of the steps involved in sulcal fundi segment detection. (a) is the set of vertices that passed the conditional checks. The red color vertices indicate the vertices that passed all the three conditions; The yellow color vertices represent the vertices that passed the first two conditions but not the third one; The green color vertices represents the vertices that only passed the first condition. (b) is the sulcal fundi segment detection result, in which blue color segments indicate candidate sulcal fundi segments, and red color segments represent strict sulcal fundi segments. (c) and (d) are the results by overlaying (a) and (b) on the original cortical surface, respectively. As we can see, if we only consider strict sulcal fundi segments as sulcal fundi, some continuous sulcal fundi curves will be interrupted (the green arrow in (d) highlights an example).
Figure 4 shows an example of steps involved in sulcal fundi segment detection on a cortical surface. Figure 5 shows a detailed example of sulcal fundi segment detection on a cortical surface.
Fig. 5.
An illustration of sulcal fundi segment detection in a trianglized cortical surface. It should be noted that the surface is viewed from inside to outside. The orange curve represents the detected sulcal fundi segments in triangular faces. The direction of the arrow at each vertex indicates the maximum principal direction, and the color of the arrow indicates the value of the maximum principal curvature (color bar on the right).
After checking the three edges in a triangle, there exist four potential results as illustrated in Figure 6. In case (a) and (b), none or only one of the three edges contains sulcal fundi point. Therefore, no sulcal fundi segment exists in the triangle. In case (c), two of the three edges have sulcal fundi points, so we connect the two points as a sulcal fundi segment. In case (d), all of the three edges contain sulcal fundi points and we connect the three vertices to the barycenter of the three points to form three sulcal fundi segments, that corresponds to the intersection of the cortical sulcal fundi curves. Afterwards, we distinguish the segment as a strict or a candidate sulcal fundi segment. If a sulcal fundi point in a segment is a candidate point, we consider the segment as a candidate sulcal fundi segment. Otherwise, the segment is considered as a strict segment.
Fig. 6.
Illustration of the four potential results of sulcal fundi segment detection in a triangle.
2.3 Linking sulcal fundi segments
As mentioned before, we distinguish sulcal fundi segments between strict and candidate segments for the purpose of facilitating sulcal fundi segments linking. The basic idea is that if a sulcal fundi segment is a strict segment, it is definitely identified as a sulcal fundi segment and the linking is started from such strict segments. If it is a candidate sulcal fundi segment but connects to a strict sulcal fundi segment by a path of sulcal fundi segments, it is also identified as a sulcal fundi segment. Figure 4 (b) and (d) show examples of strict sulcal fundi segments (red color) and candidate sulcal fundi segments (blue color). It is apparent that if we only consider strict sulcal fundi segments as sulcal fundi, some continuous sulcal fundi curves will be interrupted. Thus, the conditional check greatly contributes to sulcal fundi linking. Starting from a strict sulcal fundi segment, a sulcal fundi curve is expanded by adding adjacent sulcal fundi segment that shares the same edge or center with the current sulcal fundi segment. The procedure of sulcal fundi segment linking continues until no more adjacent segments join in the curve. A new sulcal fundi curve will be created from a strict sulcal fundi segment. After the step of linking sulcal fundi segments, we obtain a set of sulcal fundi curves. However, due to the numerical estimation error, sometimes sulcal fundi might be broken, especially around junction region of sulcal fundi. To deal with this situation, we check one ring neighborhood of each vertex. If there are two or more different sulcal fundi in the one ring neighborhood and the maximum principal curvature at the vertex is negative, we combine these sulcal fundi together to form a new one. To remove tiny and noisy sulcal fundi branches, we prune the sulcal fundi curves less than 3 segments. Figure 7 shows an example of combining two adjacent sulcal fundi curves into one around a junction region.
Fig. 7.
An example of adjacent sulcal fundi combination. (a) is the original extracted sulcal fundi; (b) is the corresponding sulcal fundi after the combination and the pruning of tiny branches.
2.4 Connection of breaking sulcal fundi and smoothing
After linking the sulcal fundi segments, we obtain a series of continuous sulcal fundi curves. Some sulcal fundi may be very short, which correspond to the interrupted sulcal fundi or inherently short minor sulcal fundi. Thus, we need to connect interrupted sulcal fundi together to form long sulcal fundi curves. However, we may not know which sulcal fundi are interrupted and which ones are inherently short. To deal with this problem, we adopt the fast marching method, which was originally developed in (Sethian, 1996) on regular grids and was extended to triangulated surface mesh in (Kimmel and Sethian, 1998). In general, the fast marching method is a numerical approach for solving Eikonal equation (Kimmel and Sethian, 1998):
| (10) |
which describes the evolution of closed curves on a surface as a function of arrival time T(x) with speed F(x) at a point x on the curve and with the constraint that x is on the surface S . The geodesic path from a source point to a destination point on a triangulated surface can be extracted by first solving the Eikonal equation on the surface to obtain the distance map from the source point, and then backtracking along the gradient direction (Kimmel and Sethian, 1998).
To connect breaking sulcal fundi, from each end point of the extracted sulcal fundi curve, we search in a geodesic region (8mm as the distance threshold in the paper), to find out whether there exist other sulcal fundi in the region. The geodesic region is calculated using the fast marching method on the surface with the setting of uniform speed on all vertices. Once other sulcal fundi curves in the region are found, we tentatively connect the end points to the found sulcal fundi by computing the weighted geodesic path between them on the surface. As the sulcal fundi are located at regions with large negative maximum principal curvatures, we set the marching speed for each vertex according to the maximum principal curvature as follows:
| (11) |
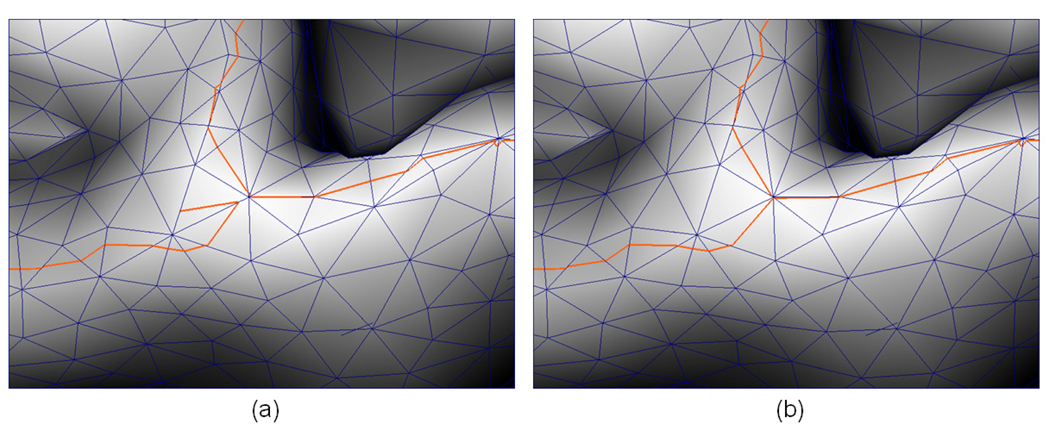
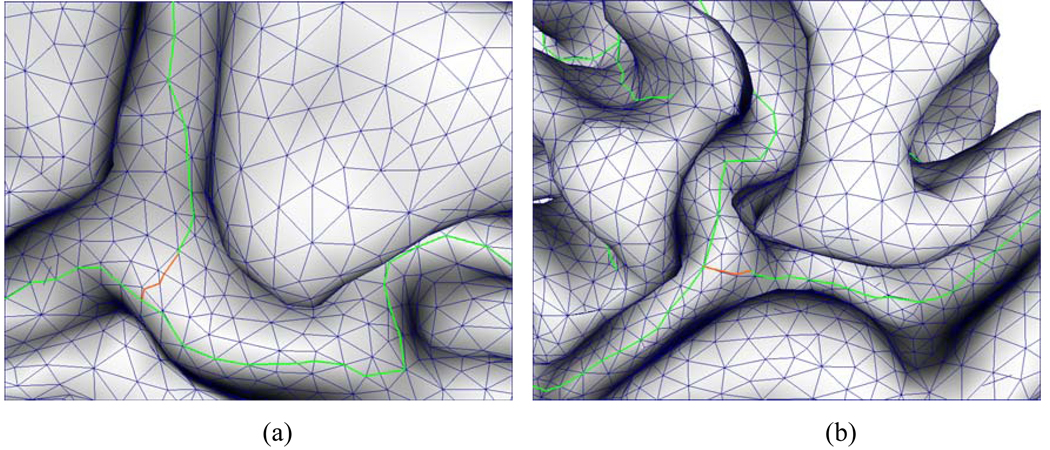
where T, a curvature threshold parameter, is used to eliminate extremely noisy curvature and α is a weighting parameter. This formula makes sure that the sulcal root regions have large marching speeds, and gyral crown regions have relatively small marching speeds. However, the geodesic path may wrongly connect two inherently separated sulcal fundi by a gyral crown region. To avoid this, we inspect cmax on the geodesic path. Since we know that cmax is positive at gyral crown regions, if cmax at a point on the path is positive, we conclude that the geodesic path is passing through gyral crown regions and regard it as a wrong connection, and then discard it. Otherwise, we add the geodesic path as a part of the sulcal fundi to connect breaking sulcal fundi. Figure 8 shows two examples of connection of breaking sulcal fundi curves.
Fig. 8.
Two examples of connection of breaking sulcal fundi. The green curves are the originally extracted sulcal fundi, and the orange curves are ones connecting breaking sulcal fundi.
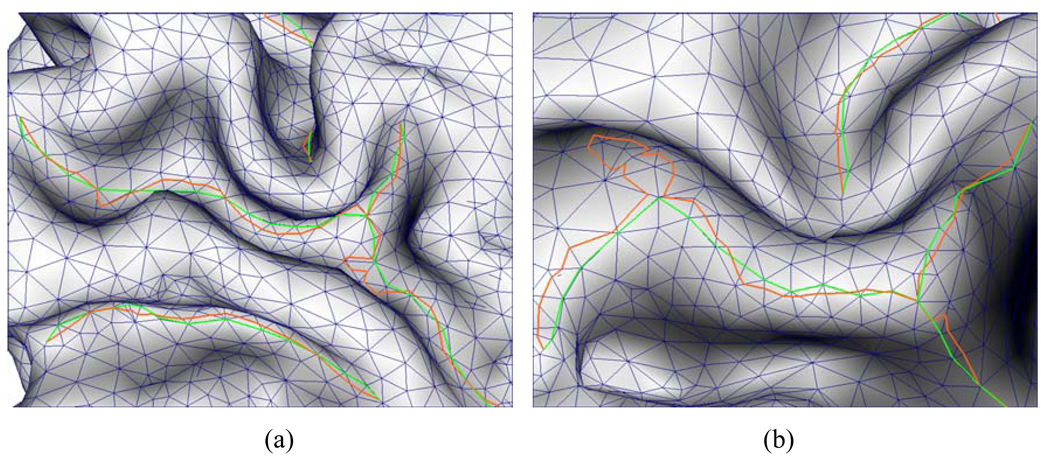
After connecting breaking sulcal fundi, we obtain a set of sulcal fundi in which there may exist sharp bumps due to the numerical error in the estimation of curvatures and their derivatives. Therefore, we need to smooth the extracted sulcal fundi. We formulate the sulcal fundi smoothing as a minimization problem: minimizing the weighting geodesic distance from a sulcal fundi starting point to the corresponding end point or junction point. Meanwhile, we want to keep the smoothed sulcal fundi close to the originally extracted sulcal fundi. This minimization problem can be solved by the fast marching method. We set the marching speed at each vertex for sulcal fundi smoothing as follows:
| (12) |
Where the term S(x) is used to favor vertices close to the originally extracted sulcal fundi, and β is a parameter used to control the tradeoff between favoring curvature and favoring closeness to the original sulcal fundi points. In our implementation, S(x) is set to be:
| (13) |
Where xi belongs to the one-ring adjacent vertices of x, and si is the sulcal fundi point on the edge from by x and xi. If no sulcal fundi point exists on edges formed by the one-ring adjacent vertices of x, S(x) is set to be 0. A straightforward explanation to this design is: the closer the current vertex to adjacent sulcal fundi point, the more favored the current vertex in smoothing. Using the marching speed above, we smooth the sulcal fundi by computing the weighted geodesic path between the sulcal fundi start point and the corresponding end point or junction point. Figure 9 shows two examples of sulcal fundi smoothing. We can observe that some bumps are effectively removed; meanwhile the smoothed sulcal fundi are still close to the original one at other regions.
Fig. 9.
Two examples of sulcal fundi smoothing. The orange curves are the originally extracted sulcal fundi curves. The green curves are the sulcal fundi after smoothing by the fast marching method. We can see that the final sulcal fundi is much smoother and more realistic.
To summarize, the proposed sulcal fundi extraction pipeline consists of four consecutive steps: estimating curvatures and curvature derivatives, detection of sulcal fundi segments, linking sulcal fundi segments and connection of breaking sulcal fundi and smoothing. Figure 10 shows a running example of the proposed sulcal fundi extraction pipeline on a cortical inner surface of a hemisphere.
Fig. 10.
A running example of the proposed sulcal fundi extraction pipeline on a cortical inner surface of a hemisphere. (a) A triangulated cortical inner surface; (b) The maximum principal curvature map. (c) The detected sulcal fundi segments. (d) The final extracted sulcal fundi, in which each branch of sulcal fundi is assigned a random color.
3. Validation and Results
In this section, a series of experiments are conducted to evaluate the performance of the propsed sulcal fundi extraction pipeline. Unless otherwise specified, all the topologically corrected and geometrically accurate cortical surfaces used in this section were generated with the BrainVISA software (Mangin et al., 1995). This tool firstly generates a binary mask of each hemisphere cortex with spherical homotopy using a set of steps, including: bias correction, histogram analysis, brain mask segmentation, hemisphere separation, detection of gray/white matter interface (Mangin et al., 1995; Cachia et al., 2003). A standard facet tracking algorithm is adopted to compute a first spherical mesh made up of facets from the cortex mask. Then, the center of each facet is connected to the center of the neighboring facets in order to yield a spherical mesh of triangles. This algorithm preserving the initial topology relies on a look-up table of configurations like in the standard marching cube algorithm (Mangin et al., 1995; Cachia et al., 2003). Finally, a decimation procedure including smoothing is performed in order to remove stair artifacts due to the underlying discretization. The embedded smoothing operation iteratively moves the nodes towards their neighborhood gravity center (Mangin et al., 1995; Cachia et al., 2003). For more details of the cortical surface reconstruction method using BrainVisa, we refer to Mangin et al., 1995; Cachia et al., 2003. The dataset we used were described in our previous publication in Liu et al., 2006.
3.1 Parameter settings
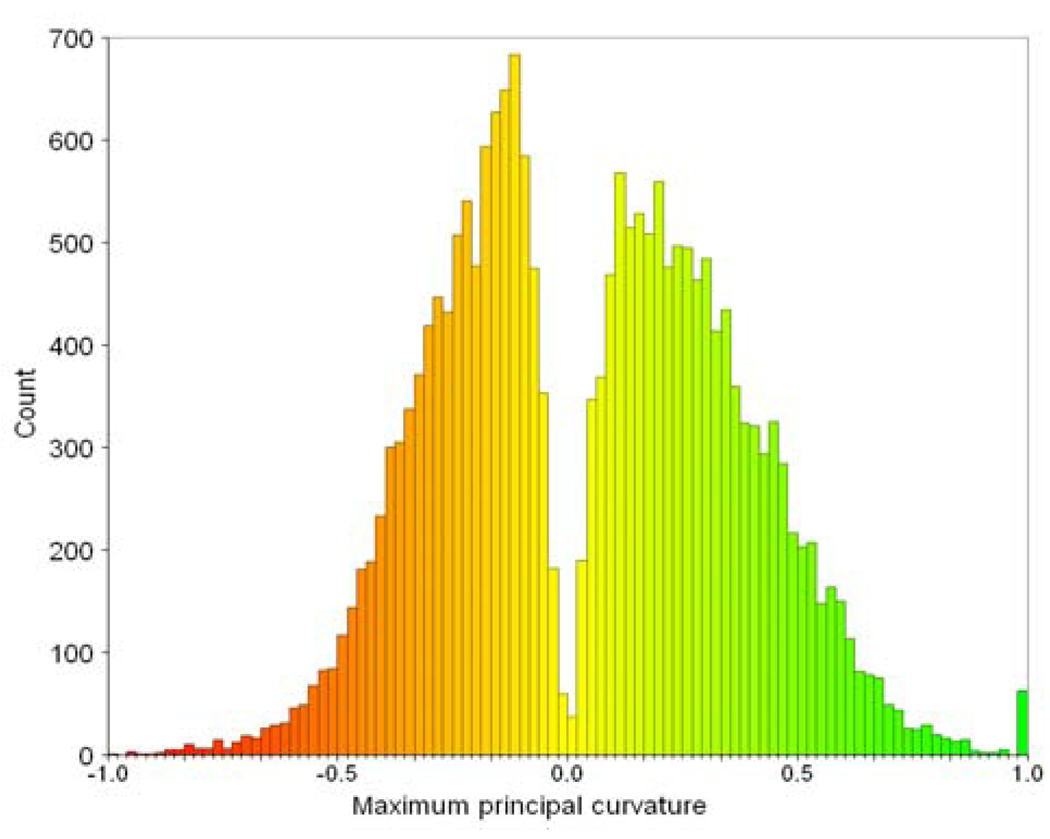
There are a few parameters which can be adjusted in the method. The first two parameters are: T and α, which determine the marching speed in the fast marching method for connecting breaking sulcal fundi and smoothing bumpy sulcal fundi. The threshold parameter T is used to eliminate extremely noisy curvatures on the cortical surface and it is set to be −1.0 throughout the paper. The reason is: according to our extensive observations, the percentage of vertices with absolute maximum principal curvature larger than 1.0 is less than 1.0%. This can be seen from Figure 11 that shows a typical maximum principal curvature histogram distribution of an inner cortical surface of a hemisphere with the total vertex number 20979. The non-positive parameter α is used to determine the degree of favoring large negative maximum principal curvature when extracting the weighted geodesic paths. At regions with large negative maximum principal curvature, the marching speed should be large, so that the weighted geodesic paths tend to pass through those regions. The smaller α is, the stronger the geodesic paths favor passing through vertices with large negative maximum principal curvature. When α is set to be 0, the marching speed will be uniform for all vertices. We tried different values for α and we found that α = −5.0 is small enough for most situations for connecting breaking sulcal fundi and smoothing. Therefore, in our experiments, the parameter T is set to be −1.0 and parameter α is set to be −5.0.
Fig. 11.
An example of the maximum principal curvature histogram of an inner cortical surface of a hemisphere.
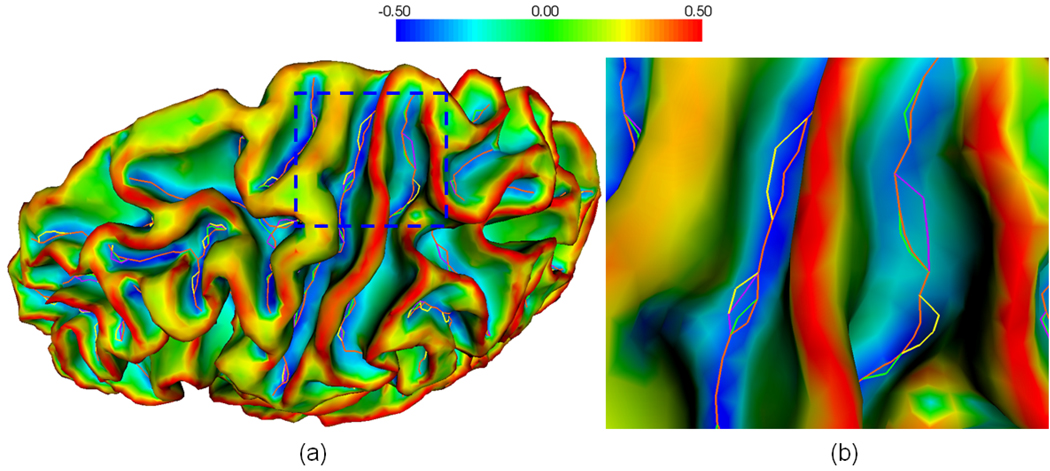
The third parameter β (0 ≤ β ≤ 1) determines the tradeoff between favoring the originally detected sulcal fundi points and vertices with large negative maximum principal curvatures when smoothing sulcal fundi. When β reaches 1, the marching speed F2 is determined by curvature only. Thus the smoothed sulcal fundi are affected by curvature only. When β reaches 0, the marching speed is F2 determined by detected sulcal fundi position only. We tried different values for β and we found that relatively large β achieves better tradeoff between closeness to the original sulcal fundi and smoothing. Figure 12 shows an example of different values for parameter β that affects the final sulcal fundi extraction results. The parameter β set as 0.5 and 0.7 (green and orange curves) achieves good smoothing results compared to β set as 0.3 (purple curves). In our experiments, β is set to be 0.7 throughout the paper.
Fig. 12.
Illustration of different β values affecting the final sulcal fundi extraction results. (a) The sulcal fundi extraction results overlaid on the cortical surface colored with maximum principal curvature. The yellow curves represent the sulcal fundi before smoothing. The purple, green and orange curves represent the final sulcal fundi after smoothing with the parameter β set as 0.3, 0.5 and 0.7 respectively. As we can see clearly, sulcal fundi smoothing step removes some sharp bumps in sulcal fundi. The parameter β setting as 0.5 and 0.7 (green and orange curves) achieves better smoothing results, compared to β setting as 0.3 (purple curves).
3.2 Quantitative evaluation
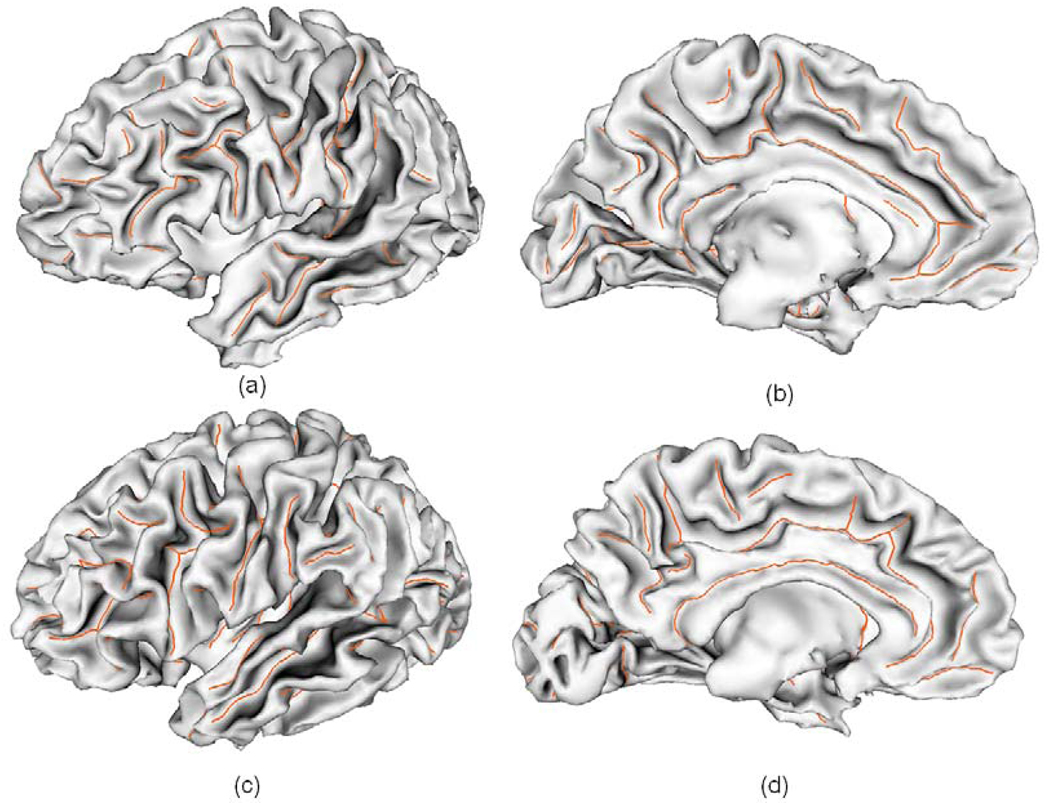
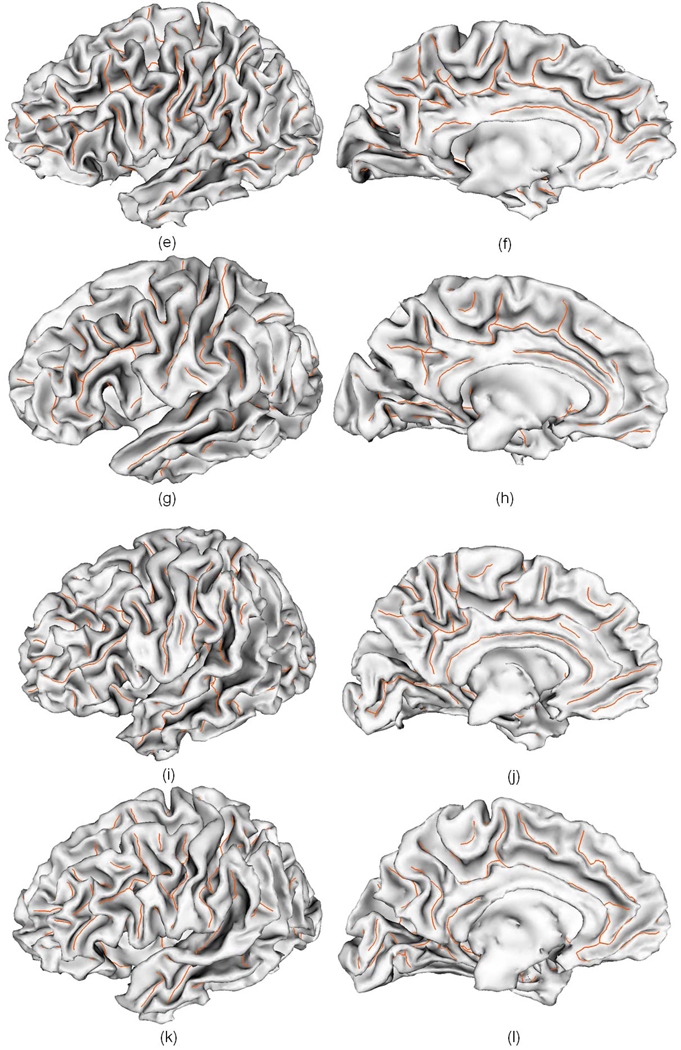
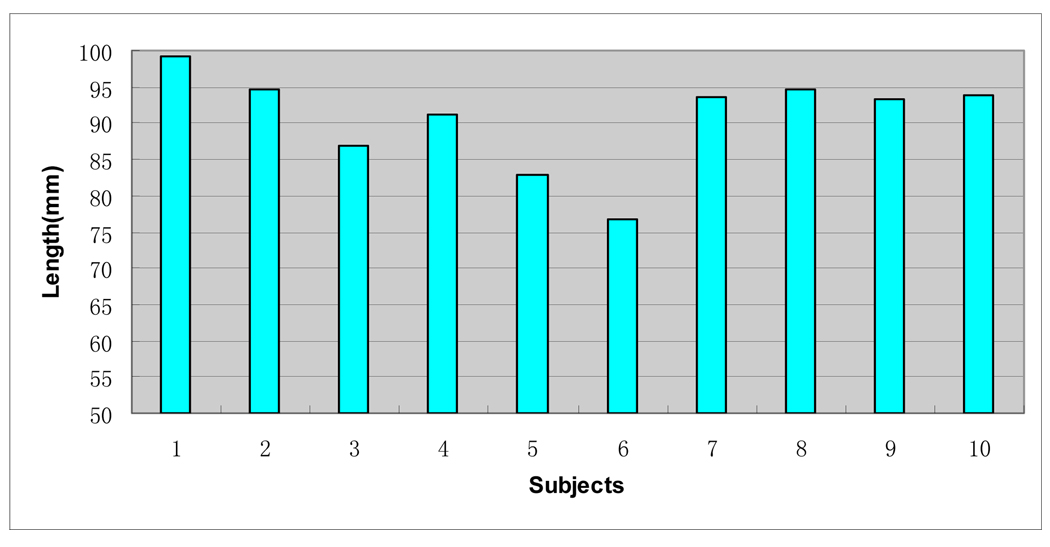
We applied the sulcal fundi extraction pipeline on the cortical surfaces of ten normal human brains. On average, in the ten subjects, the inner surface of a hemisphere comprised about 25000 vertices and 50000 triangles. The average length of an edge in the triangles is around 1.9 mm. Figure 13 shows the sulcal fundi extraction results overlaid on the corresponding cortical surface of 6 randomly selected subjects. In the inner surfaces of left hemispheres of the ten subjects, after linking sulcal fundi segments as curves, we found 124.4 sulcal fundi connecting components on average with the standard derivation 6.7. After combining adjacent sulcal fundi curves, the number reduced to 83.9 on average with the standard derivation 3.7. After the step of connecting breaking sulcal fundi curves, the number further reduced to 59.1 on average with the standard derivation 5.1. This result demonstrates the effectiveness of each step in the pipeline. We visually inspected the sulcal fundi extraction results and found that all of the major sulcal fundi have been extracted successfully in the ten cases. Some extracted sulcal fundi were not continuous due to the buried gyri in sulcal regions where curvatures were positive (Cachia et al., 2003b). We have shown also the lengths of central sulcal fundi of the left hemispheres of the ten subjects in Figure 14. The lengths are calculated by summing the lengths of segments in sulcal fundi. The average length of the central sulcal fundi was 90.7 mm with the standard derivation 6.7mm on the ten subjects. Quite large variation in the length of central sulcal fundi was observed in this experiment. This result is very similar to the result reported by Ono et. al. 1990, in which the average length of left central sulci is 94mm, and the minimum and maximum length are 70mm and 125mm respectively.
Fig. 13.
Sulcal fundi extraction results overlaid on the corresponding cortical surfaces of 6 randomly selected subjects. The orange curves represent extracted sulcal fundi. The left column figures show the lateral views and right column figures show the medial views.
Fig. 14.
The lengths of central sulcal fundi on left hemispheres of the ten subjects.
In order to quantitatively evaluate the accuracy of the proposed sulcal fundi extraction pipeline, two experts manually labeled the major sulcal fundi on the cortical inner surfaces of left hemispheres of the ten subjects as standard. The manual annotation is performed as follows: experts interactively position and record all sulcal fundi points along the orientation of the sulcus on the surface rendering of triangular cortical surfaces, and then connect these sulcal fundi points into a sulcal fundus curve. When manually annotating sulcal fundi, the experts always refer to a brain surface atlas. The starting and ending points are relatively difficult to be determined, since the precise physical boundaries between sulci and gyri are not defined. Therefore, the annotation of the starting and ending points is mainly based on the experience of experts. Meanwhile, the allowed maximum inter-expert error for starting and ending points is constrained to be no more than an edge length. When annotating the sulcal fundi, if a fundus is not clearly interrupted by gyri, we always draw a single sulcal fundus. We define two distance measurements to quantitatively evaluate the performance. Let the standard sulcal fundi be denoted as Sgand automatically extracted sulcal fundi as Sa, the two distance measurements are defined as:
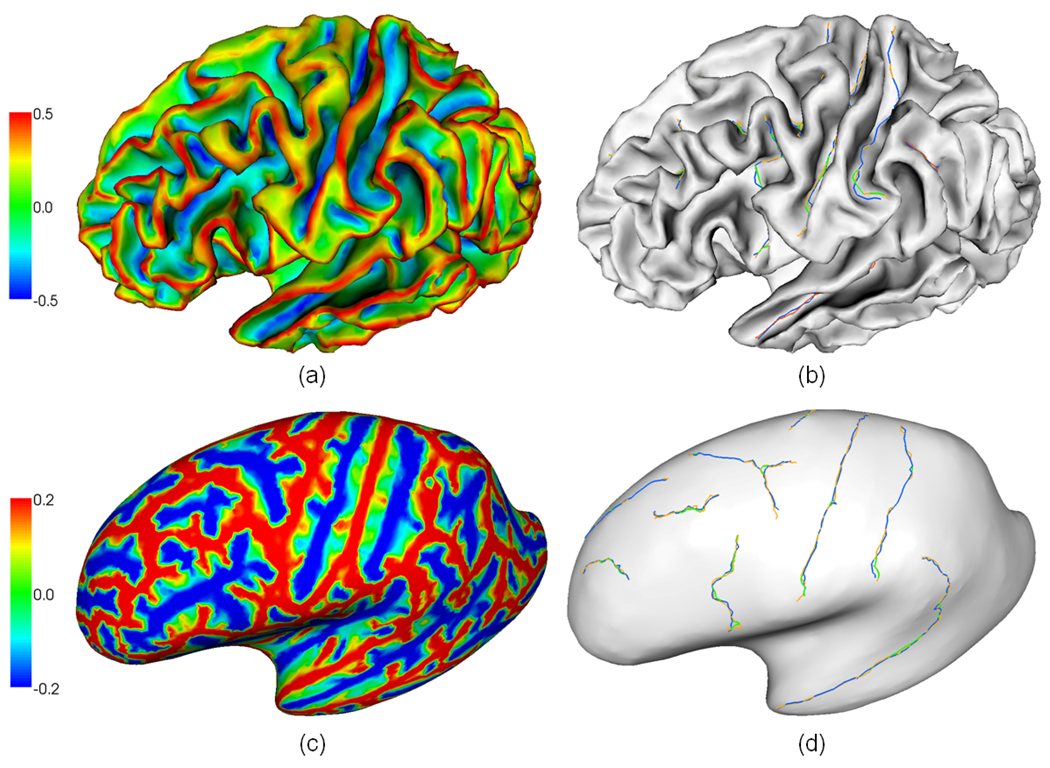
where n and m are total point number in sulcal fundi Sa and Sg respectively. Here dmin measures the average distance from all the points in Sa to their corresponding closest points in sulcal fundi Sg . dmax measures the worst maximum distance from all the points in Sa to their corresponding closest points in sulcal fundi Sg. We use several major sulcal fundi including central, pre-central, post-central, superior frontal, superior temporal and cingulate sulcal fundi to evaluate the performance of the pipeline. Figure 15 shows an example of several manually labeled sulcal fundi and automatically extracted sulcal fundi overlaid on a lateral cortical surface. For the convenience of inspection, we also overlay the sulcal fundi on the corresponding inflated surface, which is obtained by a similar method in (Tosun et al., 2004). As we can see, the manually labeled and automatically extracted sulcal fundi are very close to each other. Table 1 and 2 show the average dmin and average dmax of the several sulcal fundi on the 10 subjects, compared to the standard from expert 1 and table 3 and 4 show the average dmin and average dmax compared to the standard from expert 2. Compared to both experts, the average dmin is around 0.7 mm and the average dmaxis around 3.0 mm, indicating the good performance of the proposed pipeline.
Fig. 15.
An example of manually labeled and automatically extracted several major sulcal fundi on a lateral cortical surface. (a) and (c) are the maximum principal curvature map on the surface and the corresponding inflated surface respectively. The color bar is on the left. (b) and (d) are manually labeled and automatically extracted sulcal fundi overlaid on the surface and inflated surface respectively. The orange color curves indicate automatically extracted sulcal fundi. The green and blue color curves represent manually labeled sulcal fundi by two experts.
Table 1.
The dmin of several major sulcal fundi on the left hemispheres of the cortical inner surfaces of the ten subjects, compared to manually labeled sulcal fundi by the first expert.
| Sulcal fundi |
Central | Pre- central |
Post- central |
Superior frontal |
Superior temporal |
Cingulate |
|---|---|---|---|---|---|---|
| 1 | 0.61 | 0.93 | 0.92 | 0.52 | 0.62 | 0.66 |
| 2 | 0.66 | 0.74 | 0.49 | 0.60 | 0.60 | 0.73 |
| 3 | 0.71 | 0.57 | 0.73 | 0.55 | 0.67 | 0.32 |
| 4 | 0.81 | 0.57 | 0.51 | 0.41 | 0.64 | 0.30 |
| 5 | 0.62 | 0.61 | 0.66 | 0.64 | 0.52 | 0.45 |
| 6 | 0.71 | 0.35 | 0.78 | 0.70 | 0.65 | 0.62 |
| 7 | 0.61 | 0.78 | 0.49 | 0.58 | 0.67 | 0.38 |
| 8 | 0.57 | 0.64 | 0.69 | 0.42 | 0.63 | 0.35 |
| 9 | 0.72 | 0.54 | 0.63 | 0.39 | 0.65 | 0.62 |
| 10 | 0.78 | 0.62 | 0.49 | 0.90 | 0.61 | 0.48 |
| Average(mm) | 0.68 | 0.64 | 0.64 | 0.57 | 0.63 | 0.49 |
Table 2.
The dmax of several major sulcal fundi on the left hemispheres of the cortical inner surfaces of the 10 subjects, compared to manually labeled sulcal fundi by the first expert.
| Sulcal fundi |
Central | Pre- central |
Post- central |
Superior frontal |
Superior temporal |
Cingulate |
|---|---|---|---|---|---|---|
| 1 | 2.64 | 3.63 | 3.93 | 1.65 | 2.20 | 4.22 |
| 2 | 3.28 | 4.12 | 1.75 | 2.36 | 3.64 | 4.08 |
| 3 | 2.91 | 2.10 | 3.23 | 2.04 | 2.63 | 2.00 |
| 4 | 3.12 | 2.79 | 2.33 | 2.74 | 2.00 | 2.88 |
| 5 | 1.86 | 1.95 | 3.50 | 2.32 | 1.94 | 3.65 |
| 6 | 3.09 | 2.70 | 3.85 | 2.82 | 2.65 | 3.52 |
| 7 | 1.75 | 3.71 | 1.41 | 1.62 | 2.16 | 2.32 |
| 8 | 2.21 | 3.03 | 3.86 | 2.17 | 2.38 | 2.20 |
| 9 | 3.63 | 2.86 | 2.81 | 1.76 | 1.80 | 2.89 |
| 10 | 3.36 | 2.02 | 2.74 | 4.13 | 1.93 | 2.82 |
| Average(mm) | 2.78 | 2.89 | 2.94 | 2.36 | 2.33 | 3.06 |
Table 3.
The dmin of several major sulcal fundi on the left hemisphere of the cortical inner surfaces of the 10 subjects, compared to manually labeled sulcal fundi by the second expert.
| Sulcal fundi |
Central | Pre- central |
Post- central |
Superior temporal |
Superior temporal |
Cingulate |
|---|---|---|---|---|---|---|
| 1 | 0.63 | 0.50 | 0.79 | 0.53 | 0.59 | 0.70 |
| 2 | 0.82 | 0.81 | 0.46 | 0.65 | 0.63 | 0.84 |
| 3 | 0.68 | 0.79 | 0.53 | 0.58 | 0.65 | 0.81 |
| 4 | 0.78 | 0.64 | 0.53 | 0.55 | 0.65 | 0.69 |
| 5 | 0.56 | 0.54 | 0.92 | 0.61 | 0.51 | 0.6 |
| 6 | 0.74 | 0.58 | 0.59 | 0.78 | 0.63 | 0.86 |
| 7 | 0.61 | 0.69 | 0.49 | 0.73 | 0.68 | 0.50 |
| 8 | 0.58 | 0.73 | 0.73 | 0.58 | 0.81 | 0.58 |
| 9 | 0.67 | 0.83 | 0.61 | 0.33 | 0.64 | 0.74 |
| 10 | 0.66 | 0.88 | 0.51 | 0.31 | 0.73 | 0.79 |
| Average(mm) | 0.67 | 0.70 | 0.62 | 0.57 | 0.65 | 0.71 |
Table 4.
The dmax of several major sulcal fundi on the left hemispheres of the cortical inner surfaces of the 10 subjects, compared to manually labeled sulcal fundi by the second expert.
| Sulcal fundi |
Central | Pre- central |
Post- central |
Superior frontal |
Superior temporal |
Cingulate |
|---|---|---|---|---|---|---|
| 1 | 2.64 | 3.01 | 3.92 | 1.65 | 2.14 | 4.22 |
| 2 | 3.27 | 3.76 | 1.75 | 4.11 | 3.63 | 3.90 |
| 3 | 2.61 | 4.26 | 2.05 | 2.41 | 2.63 | 3.75 |
| 4 | 3.11 | 2.89 | 2.79 | 2.73 | 2.00 | 3.02 |
| 5 | 1.86 | 1.57 | 2.02 | 2.32 | 1.94 | 3.65 |
| 6 | 3.09 | 1.94 | 2.19 | 3.12 | 2.65 | 4.13 |
| 7 | 2.32 | 3.59 | 1.41 | 3.46 | 2.49 | 1.66 |
| 8 | 2.21 | 3.03 | 3.86 | 2.27 | 3.99 | 3.75 |
| 9 | 3.63 | 3.73 | 1.86 | 1.88 | 1.80 | 3.09 |
| 10 | 3.35 | 3.46 | 2.74 | 1.50 | 2.79 | 3.73 |
| Average(mm) | 2.81 | 3.12 | 2.46 | 2.54 | 2.61 | 3.49 |
3.3 Comparison with BrainVISA
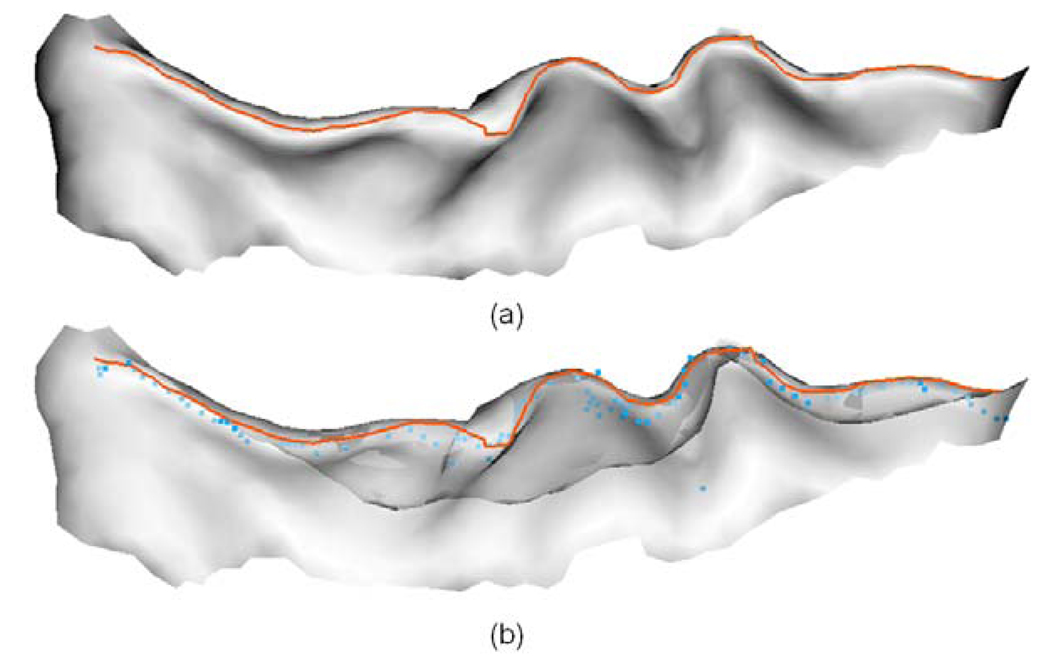
Although a variety of methods have been proposed for sulcal fundi extraction in the literature, few implementations of them are publicly available. Since all the cortical surfaces in our experiments are generated by the BrainVISA software (Cointepas et al., 2001), which can project the bottom lines of sulcal ribbon to the volumetric images, we compared our sulcal fundi extraction results with those from the BrainVISA. Specifically, we adopted the sulcal bottom line in volumetric image generated by the BrainVISA software for purpose of comparison. Since the sulcal bottom lines are projected on volumetric images in BrainVISA, they are recorded in grid positions and not organized in curve structures. Therefore, it is expected that there exist a bias around half a voxel away from the sulcal fundi positions on the gray/white matter surface. As a result, these two results might not be fair comparison. Then, we calculated the average minimum distance from all the points in BrainVISA results to their corresponding closest points in two manually labeled sulcal fundi sets. We used the central sulcal fundi on the left hemispheres of the above ten subjects for comparison. The details of the comparison results are shown in Figure 16. The average dmin between BrainVISA generated results and two manually labeled central sulcal fundi sets is around 1.3 mm. Considering that the manually annotation might be subjective and the expected half a voxel bias, even though the average dmin of our results is around 0.7mm, we cannot assert that our results are more accurate than the BrainVISA results. However, at least we demonstrate that our results are similar to the BrainVISA results. Figure 17 shows an example of comparison of sulcal fundi extraction results between our methods with BrainVISA results. Moreover, our extracted sulcal fundi are organized in curve structures.
Fig. 16.
The dmin between BrainVISA generated results and manually labeled central sulcal fundi on the cortical inner surfaces of left hemispheres of the ten subjects.
Fig. 17.
An example of comparison of sulcal fundi extraction results between our results with BrainVISA’s results. The orange curves indicate the extracted central sulcal fundi by our method, and the blue points represent the sulcal fundi points generated by the BrainVISA. The sulcus is viewed from inside to outside. (a) Our extracted sulcal fundi overlaid on the central sulcus. (b) Our extracted sulcal fundi and BrainVISA generated sulcal fundi points overlaid on the central sulcus, where the opacity of the surface is set to be 0.6 for the convenience of inspection.
3.4 Reproducibility
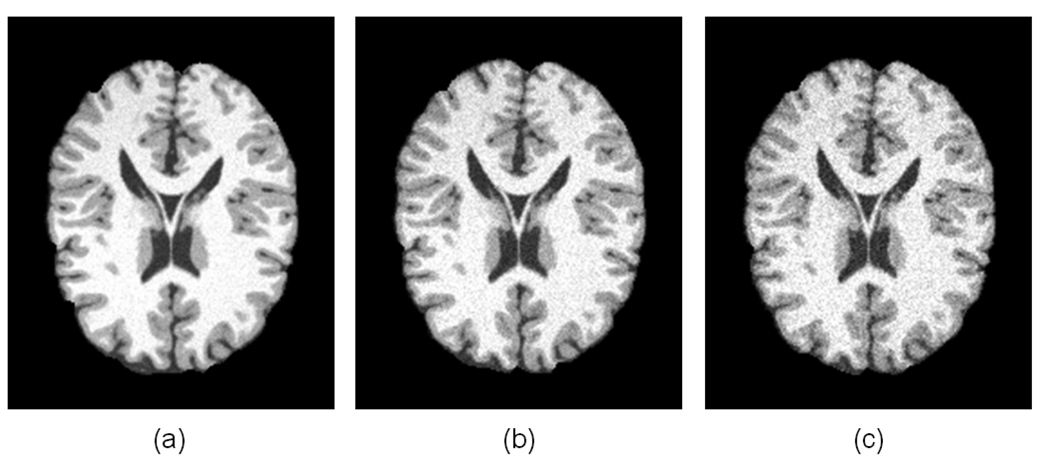
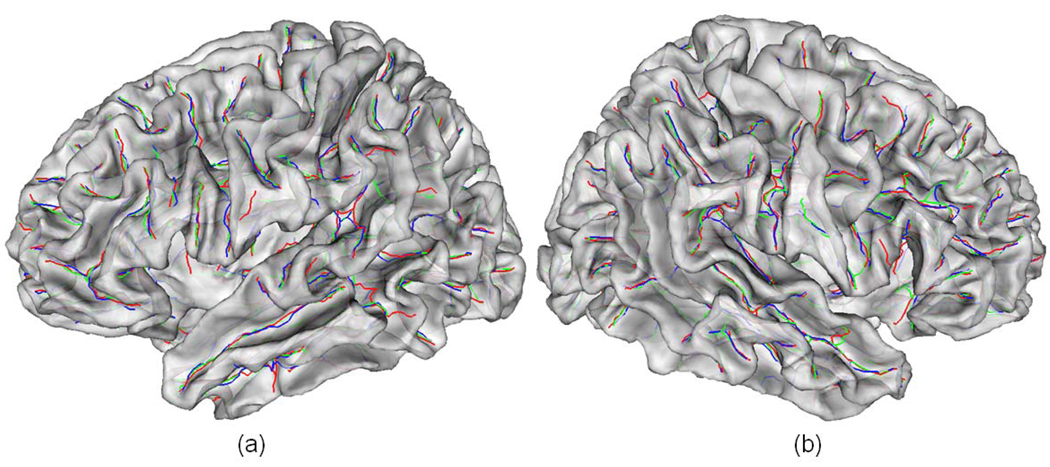
In order to test the reproducibility of the pipeline, we employed simulated T1-weighted normal brain images with different noise level from the BrainWeb website (Cocosco et al., 1997). We generated three simulated images with 1mm slice thickness, 20% intensity non-uniformity, 181 × 217 × 181 voxel resolution. The noise levels of the three images were set as 3%, 5% and 7% respectively. We refer them as simulated scan 1, 2 and 3, as shown in Figure 18. All the topologically corrected and geometrically accurate cortical surfaces in this section are generated by the method describe in Liu et al. 2008. The method consists of several steps: skull-stripping using BET in Oxford FSL tools; and cerebelum and brain stem removing using in-house tools; tissue segmentation into gray matter, white matter and CSF using FAST in Oxford FSL tools; topology correction of white matter volume using BrainSuite (Shattuck and Leahy, 2002), which implements a graph-based method (Shattuck and Leahy, 2001); reconstruction an isosurface of the corrected volume using the marching cube algorithm (Lorensen and Cline, 1987); decimation and smoothing using the IBM OpenDX software. For more details of the inner cortical surface reconstruction method, we refer to Liu et al. 2008. On average, in the three scans, the inner surfaces including two hemispheres have about 70000 vertices and 140000 triangles. The average length of an edge in triangles is about 1.8 mm. Figure 19 shows the sulcal fundi extraction results of the three scans. It should be noted that some minor shallow sulcal fundi are extracted in one of the three images, but not in others. These phenomena might attribute to the minor differences in tissue segmentation and surface reconstruction, since these different images have different noise levels. Table 5 and 6 show the average dmin and average dmaxof the several major sulcal fundi on the left hemisphere of the three scans compared to the each other. The average dmin is around 1.0 mm and the average dmax is around 3.0 mm, indicating the good reproducibility of the pipeline. This result also demonstrates that our sulcal extraction method has good performance on not only cortical surfaces reconstructed by BrainVISA, but also on the cortical surfaces reconstructed by other available software or methods, e.g., the methods in Liu et al., 2008. Our future work involves investigating its performance on cortical surfaces reconstructed by other methods such as the ones in Dale et al., 1999, Shattuck and Leahy, 2002, and Han et al., 2004.
Fig. 18.
The three simulated brain images with different noise levels.
Fig. 19.
The sulcal fundi extraction results of the three simulated MR images overlaid on a cortical surface. The red, green and blue color curves represent the sulcal fundi extraction results of scan 1, 2 and 3, respectively. The opacity of the surface is set to be 0.6 for the convenience of visual inspection.
Table 5.
The dmin of several major sulcal fundi on the left hemispheres of three scans, compared with each other.
| Sulcal fundi | Central | Pre-central | Post-central | Superior frontal | Superior temporal |
|---|---|---|---|---|---|
| Scan 1—Scan 2 | 0.89 | 1.51 | 0.69 | 1.41 | 0.88 |
| Scan 1—Scan 3 | 0.94 | 1.43 | 0.95 | 1.46 | 0.90 |
| Scan 2—Scan 3 | 0.71 | 1.07 | 0.96 | 0.89 | 0.88 |
| Average (mm) | 0.85 | 1.34 | 0.87 | 1.25 | 0.89 |
Table 6.
The dmax of several major sulcal fundi on the left hemispheres of three scans, compared with each other.
| Sulcal fundi | Central | Pre-central | Post-central | Superior frontal | Superior temporal |
|---|---|---|---|---|---|
| Scan 1—Scan 2 | 1.14 | 3.90 | 2.01 | 3.91 | 2.98 |
| Scan 1—Scan 3 | 1.78 | 3.93 | 2.56 | 3.98 | 2.88 |
| Scan 2—Scan 3 | 1.84 | 2.17 | 2.31 | 1.79 | 2.88 |
| Average (mm) | 1.59 | 3.34 | 2.30 | 3.23 | 2.91 |
4. Discussion and Conclusion
The advantage of the proposed pipeline for sulcal fundi extraction over previous curve tracking based methods, which usually require users to manually accurately position some points of desired sulcal fundi and are subject to inter-rater variation, is its accuracy and automation. Our method uses curvature and curvature derivative information to detect the exact zero-crossing sulcal fundi position and then link those sulcal fundi points as sulcal fundi curves. Therefore, the proposed method can find the accurate sulcal fundi location without sulcal and gyral region segmentation. Also, the proposed pipeline is quite robust in different cases and in different situations, as shown in section 3.2 to section 3.4. Moreover, the automation enables the application of the proposed pipeline in large scale brain image processing and analysis.
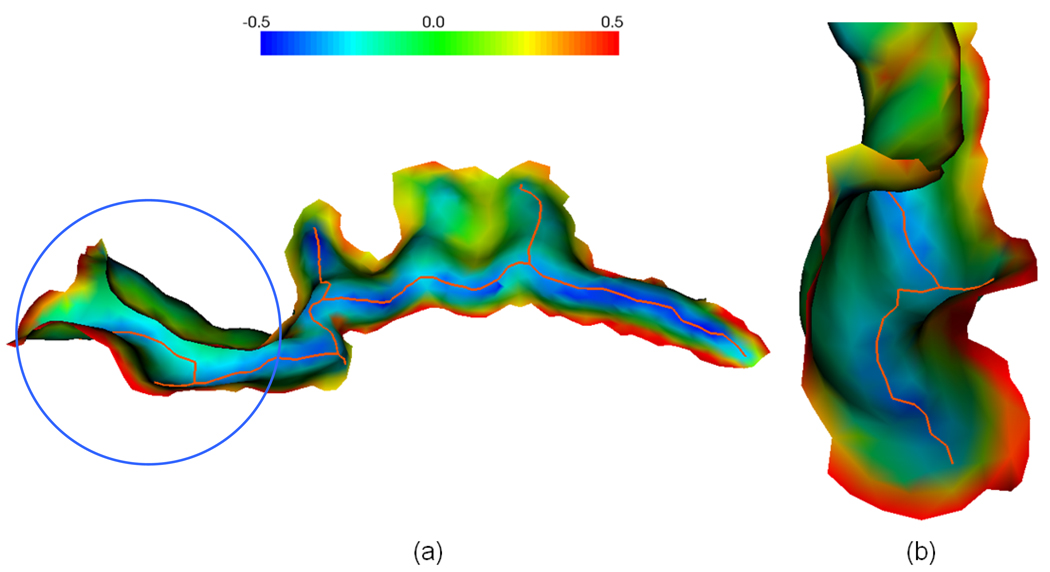
One potential problem in sulcal fundi extraction using curvature is that some sulci might be quite flat valleys, for example, the cingulate sulcus. However, as long as the sulci are not totally flat (otherwise, both curvature and curvature derivatives will be zero), curvatures and their derivatives still provide important and necessary information for sulcal fundi extraction. Thus, our method is still able to find the true sulcal fundi in smooth valley. Figure 20 shows an example of sulcal fundus extraction results in a quite smooth cingulated sulcus. As we can see, our method is able to extract the sulcal fundi correctly in the situation that the sulci are not totally flat. Another potential problem is that some sulci may include buried gyri where curvatures are positive (Cachia et al., 2003b), therefore the extracted sulcal fundi will be interrupted around those regions in the curvature based method. Incorporation of other features, e.g. geodesic depth, might provide remedy in this situation, which will be investigated in the future.
Fig. 20.
An illustration of extracted sulcal fundi on a quite flat cingulated sulcus. The orange curves represent the extracted sulcal fundi and the colors on the sulcus indicate the maximum principal curvatures (The color bar is shown on the top). (b) is the different view point (viewing from left to right in figure (a) of the zoomed view of the region in the circle in (a).
In the paper, we assumed that the triangular cortical surfaces are sufficiently smooth and have a specific spatial resolution. Different spatial resolution might cause different problems, for example, very low resolution might result in lost details and inaccuracy of sulcal fundi points, and very high resolution might cause ambiguities when determining sulcal fundi points. We used the cortical surface with the average length of edges in triangles around 1.9 mm. Since the triangles are normally dense around sulcal bottom and gyral crowns, the lengths of edges in triangles at these regions are smaller than this average length. The extracted sulcal fundi by our method are able to cross half edges in triangular cortical surfaces. And the experiment results have demonstrated that our method has achieved around 1.0mm accuracy level.
In summary, we have presented a novel automatic pipeline for accurate extraction of sulcal fundi on cortical surfaces based on curvature and curvatures derivatives information. We applied the method to inner cortical surfaces of ten normal subjects. To evaluate the efficacy and performance of the proposed method, we evaluated it using manually labeled sulcal fundi as the standard. The results show that the algorithm is able to extract sulcal fundi efficiently and accurately. Currently, the sulcal fundi extraction method is implemented using C/C++ programming languages. On a typical Intel Core2 1.86GHz machine with 2GB memory, it takes around 8 seconds to extract all the sulcal fundi on the inner surface of a hemisphere.
Our future work includes further evaluation and validation of the method on more subjects and automatic recognition of sulcal fundi. Once we obtain the sulcal fundi, we will analyze the variability of the corresponding sulcal fundi and study the complex cortical fundi network configuration in a population of brains. In addition, automatic extraction and recognition of sulci fundi might shed light on the long-standing problem of brain image registration problem caused by remarkable complexity and variability in human brain cortex (Mangin et al., 2003), even though a variety of methods have been proposed (Bajcsy et al., 1983; Collins et al., 1994; Friston et al., 1995; Thompson et al., 1996; Christensen et al., 1996; Davatzikos, 1997; Woods et al., 1998; Thirion, 1998; Rueckert et al., 1999; Shen and Davatzikos, 2002; Liu et al, 2004). The recognized sulci fundi could be used for brain image registration by firstly matching the consistent corresponding sulcal fundi across individuals as initialization, and then matching other cortical regions progressively. In this way, the chance of being trapped in local minima of energy function minimization in nonlinear brain image registration algorithms could be greatly reduced (Shen and Davatzikos, 2002).
Acknowledgement
G. Li, J Nie and L Guo were supported by the Northwestern Polytechnical University Foundation for Fundamental Research. G Li was also supported by the Doctorate Foundation of Northwestern Polytechnical University. T Liu was supported by the NIH Career Award EB 006878 and The University of Georgia start-up research funding. G Li, J Nie and T Liu performed initial part of the work presented in this manuscript when they were affiliated with and supported by the Methodist Hospital Research Institute and Weill Medical College of Cornell University. Also, the authors would like to thank Mr. Mayuresh Kasture for his help in proofreading of this manuscript and the anonymous reviewers for proving constructive suggestions that improved this paper.
Footnotes
Publisher's Disclaimer: This is a PDF file of an unedited manuscript that has been accepted for publication. As a service to our customers we are providing this early version of the manuscript. The manuscript will undergo copyediting, typesetting, and review of the resulting proof before it is published in its final citable form. Please note that during the production process errors may be discovered which could affect the content, and all legal disclaimers that apply to the journal pertain.
References
- Ashburner J, Csernansky JG, Davatzikos C, Fox NC, Frisoni GB, Thompson PM. Computer-assisted imaging to assess brain structure in healthy and diseased brains. Lancet Neurol. 2003;2(2):79–88. doi: 10.1016/s1474-4422(03)00304-1. [DOI] [PubMed] [Google Scholar]
- Bajcsy R, Lieberson R, Reivich M. A computerized system for the elastic matching of deformed radiographic images to idealized atlas images. J. Comput. Assist. Tomogr. 1983;7(4):618–625. doi: 10.1097/00004728-198308000-00008. [DOI] [PubMed] [Google Scholar]
- Bartesaghi A, Sapiro G. A system for the generation of curves on 3D brain images. Hum. Brain. Mapp. 2001;14(1):1–15. doi: 10.1002/hbm.1037. [DOI] [PMC free article] [PubMed] [Google Scholar]
- Blezek DJ, Miller JM. Atlas stratification. Med. Image Anal. 2007;11(5):443–457. doi: 10.1016/j.media.2007.07.001. [DOI] [PMC free article] [PubMed] [Google Scholar]
- Cachia A, Mangin J-F, Riviere D, Papadopoulos-Orfanos D, Kherif F, Bloch I, Regis J. A generic framework for parcellation of the cortical surface into gyri using geodesic Voronoi diagrams. Med. Image. Anal. 2003a;7(4):403–416. doi: 10.1016/s1361-8415(03)00031-8. [DOI] [PubMed] [Google Scholar]
- Cachia A, Mangin J-F, Riviere D, Kherif F, Boddaert N, Andrade A, Papadopoulos-Orfanos D, Poline JB, Bloch I, Zilbovicius M, Sonigo P, Brunelle F, Regis J. A primal sketch of the cortex mean curvature: a morphogenesis based approach to study the variability of the folding patterns. IEEE Trans. Med. Imag. 2003b;22(6):754–765. doi: 10.1109/TMI.2003.814781. [DOI] [PubMed] [Google Scholar]
- Christensen GE, Rabbit RD, Miller MI. Deformable templates using large deformation kinematics. IEEE Trans. Image Process. 1996;5(10):1435–1447. doi: 10.1109/83.536892. [DOI] [PubMed] [Google Scholar]
- Cocosco CA, Kollokian V, Kwan RKS, Evans AC. BrainWeb: online interface to a 3D MRI simulated brain database. NeuroImage. 1997;5(4):S425. [Google Scholar]
- Cointepas Y, Mangin JF, Garnero L, Poline JB, Benali H. BrainVISA: Software platform for visualization and analysis of multimodality brain data. NeuroImage. 2001;13(6):S98. [Google Scholar]
- Collins DL, Neelin P, Peters TM, Evans AC. Automatic 3D intersubject registration of MR volumetric data in standardized Talairach space. J. Comput. Assist. Tomogr. 1994;18(2):192–205. [PubMed] [Google Scholar]
- Collins DL, Goualher GL, Evans AC. Non-linear cerebral registration with sulcal constraints. International Conference on Medical Image Computing & Computer Assisted Intervention; 1998. pp. 974–984. [Google Scholar]
- Dale AM, Fischl B, Sereno MI. Cortical surface-based analysis I: segmentation and surface reconstruction. NeuroImage. 1999;9(2):179–194. doi: 10.1006/nimg.1998.0395. [DOI] [PubMed] [Google Scholar]
- Davatzikos C. Spatial transformation and registration of brain images using elastically deformable models. Comput. Vis. Image Underst. 1997;66(2):207–222. doi: 10.1006/cviu.1997.0605. [DOI] [PubMed] [Google Scholar]
- Durrleman S, Pennec X, Trouve A, Ayache N. Measuring brain variability via sulcal lines registration: a diffeomorphic approach. International Conference on Medical Image Computing & Computer Assisted Intervention; 2007. pp. 675–682. [DOI] [PubMed] [Google Scholar]
- Fillard P, Arsigny V, Pennec X, Hayashi KM, Thompson PM, Ayache N. Measuring brain variability by extrapolating sparse tensor fields measured on sulcal lines. NeuroImage. 2007;34(2):639–650. doi: 10.1016/j.neuroimage.2006.09.027. [DOI] [PubMed] [Google Scholar]
- Friston K, Ashburner J, Frith CD, Poline JB, Heather JD, Frackowiak RSJ. Spatial registration and normalisation of images. Hum. Brain. Mapp. 1995;2:165–189. [Google Scholar]
- Goualher GL, Barillot C, Bizais Y. Three-dimensional segmentation and representation of cortical sulci using active ribbons. International Journal of Pattern Recognition and Artificial Intelligence. 1997;11:1295–1315. [Google Scholar]
- Han X, Pham DL, Tosun D, Rettmann ME, Xu C, Prince JL. CRUISE: cortical reconstruction using implicit surface evolution. NeuroImage. 2004;23(3):997–1012. doi: 10.1016/j.neuroimage.2004.06.043. [DOI] [PubMed] [Google Scholar]
- Hellier P, Barillot C. Coupling dense and landmark-based approaches for nonrigid registration. IEEE Trans. Med. Imag. 2003;22(2):217–227. doi: 10.1109/TMI.2002.808365. [DOI] [PubMed] [Google Scholar]
- Kao CY, Hofer M, Sapiro G, Stern J, Rehm K, Rottenberg DA. A geometric method for automatic extraction of sulcal fundi. IEEE Trans. Med. Imag. 2007;26(4):530–540. doi: 10.1109/TMI.2006.886810. [DOI] [PubMed] [Google Scholar]
- Khaneja N, Miller MI, Grenander U. Dynamic programming generation of curves on brain surfaces. IEEE Trans. Pattern Anal. Mach. Intell. 1998;20(11):1260–1265. [Google Scholar]
- Kimmel R, Sethian JA. Computing geodesic paths on manifolds. Proc. Natl. Acad. Sci. 1998;95(15):8431–8435. doi: 10.1073/pnas.95.15.8431. [DOI] [PMC free article] [PubMed] [Google Scholar]
- Le Goualher GL, Procyk E, Collins DL, Venugopal R, Barillot C, Evans AC. Automated extraction and variability analysis of sulcal neuroanatomy. IEEE Trans. Med. Imag. 1999;18(3):206–217. doi: 10.1109/42.764891. [DOI] [PubMed] [Google Scholar]
- Li G, Liu T, Nie J, Guo L, Wong STC. A novel method for cortical sulcal fundi extraction. International Conference on Medical Image Computing & Computer Assisted Intervention; 2008. pp. 270–278. [DOI] [PubMed] [Google Scholar]
- Li G, Guo L, Nie J, Liu T. Automatic cortical sulcal parcellation based on principal direction flow field tracking. NeuroImage. 2009;46(4):923–937. doi: 10.1016/j.neuroimage.2009.03.039. [DOI] [PMC free article] [PubMed] [Google Scholar]
- Liu T, Shen D, Davatzikos C. Deformable registration of cortical structures via hybrid volumetric and surface warping. NeuroImage. 2004;22(4):1790–1801. doi: 10.1016/j.neuroimage.2004.04.020. [DOI] [PubMed] [Google Scholar]
- Liu T, Young G, Huang L, Chen NK, Wong S. 76-space analysis of grey matter diffusivity: Methods and applications. NeuroImage. 2006;15(31):51–65. doi: 10.1016/j.neuroimage.2005.11.041. [DOI] [PubMed] [Google Scholar]
- Liu T, Nie J, Tarokh A, Guo L, Wong STC. Reconstruction of central cortical surface from brain MRI images: Method and application. NeuroImage. 2008;40(3):991–1002. doi: 10.1016/j.neuroimage.2007.12.027. [DOI] [PMC free article] [PubMed] [Google Scholar]
- Lohmann G. Extracting line representations of sulcal and gyral patterns in MR images of the human brain. IEEE Trans. Med. Imag. 1998;17(6):1040–1048. doi: 10.1109/42.746714. [DOI] [PubMed] [Google Scholar]
- Lohmann G, von Cramon DY. Automatic labelling of the human cortical surface using sulcal basins. Med. Image. Anal. 2000;4(3):179–188. doi: 10.1016/s1361-8415(00)00024-4. [DOI] [PubMed] [Google Scholar]
- Lohmann G, von Cramon DY, Colchester AC. Deep sulcal landmarks provide an organizing framework for human cortical folding. Cereb. Cortex. 2008;18(6):1415–1420. doi: 10.1093/cercor/bhm174. [DOI] [PubMed] [Google Scholar]
- Lorensen WE, Cline HE. Marching cubes: a high resolution 3D surface construction algorithm. Comput. Graph. 1987;21(4):163–169. [Google Scholar]
- Lui LM, Wang Y, Chan TF, Thompson PM. Automatic landmark and its application to the optimization of brain conformal mapping. International Conference on Computer Vision and Pattern Recognition; 2006. pp. 1784–1792. [Google Scholar]
- Mangin JF, Riviere D, Coulon O, Poupon C, Cachia A, Cointepas Y, Poline JB, Le Bihan D, Regis J, Papadopoulos-Orfanos D. Coordinate-based versus structural approaches to brain image analysis. Artif. Intell. Med. 2003;30(2):177–197. doi: 10.1016/S0933-3657(03)00064-2. [DOI] [PubMed] [Google Scholar]
- Mangin J-F, Frouin V, Bloch I, Regis J, Lopez-Krahe J. From 3D MR images to structural representations of the cortex topography using topology preserving deformations. J. Math. Imaging Vis. 1995;5(4):297–318. [Google Scholar]
- Mangin J-F, Riviére D, Cachia A, Duchesnay E, Cointepas Y, Papadopoulos-Orfanos D, Collins DL, Evans AC, Régis J. Object-based morphometry of the cerebral cortex. IEEE Trans. Med. Imag. 2004;24(8):968–982. doi: 10.1109/TMI.2004.831204. [DOI] [PubMed] [Google Scholar]
- Mangin J-F, Riviére D, Cachia A, Duchesnay E, Cointepas Y, Papadopoulos-Orfanos D, Scifo P, Ochiai T, Brunelle F, Régis J. A framework to study the cortical folding patterns. NeuroImage. 2004;23 Suppl. 1:S129–S138. doi: 10.1016/j.neuroimage.2004.07.019. [DOI] [PubMed] [Google Scholar]
- Ohtake Y, Belyaev A, Seidel HP. Ridge-valley lines on meshes via implicit surface fitting. Proc. ACM SIGGRAPH 2004. 2004:609–612. [Google Scholar]
- Ono M, Kubick S, Abernathey CD. Atlas of the Cerebral Sulci. New York: Thieme; 1990. [Google Scholar]
- Renault C, Desvignes M, Revenu M. 3D curves tracking and its application to cortical sulci detection. International Conference on Image Processing; 2000. pp. 491–494. [Google Scholar]
- Rettmann ME, Han X, Xu C, Prince JL. Automated sulcal segmentation using watersheds on the cortical surface. NeuroImage. 2002;15(2):329–344. doi: 10.1006/nimg.2001.0975. [DOI] [PubMed] [Google Scholar]
- Rivière D, Mangin JF, Papadopoulos-Orfanos D, Martinez JM, Frouin V, Régis J. Automatic recognition of cortical sulci of the human brain using a congregation of neural networks. Med. Image. Anal. 2002;6(2):77–92. doi: 10.1016/s1361-8415(02)00052-x. [DOI] [PubMed] [Google Scholar]
- Rueckert D, Sonoda LI, Hayes C, Hill DL, Leach MO, Hawkes DJ. Nonrigid registration using free-form deformations: application to breast MR images. IEEE Trans. Med. Imag. 1999;18(8):712–721. doi: 10.1109/42.796284. [DOI] [PubMed] [Google Scholar]
- Rusinkiewicz S. Estimating curvatures and their derivatives on triangle meshes. Proc. International Symposium on 3D Data Processing, Visualization and Transmission. 2004:486–493. [Google Scholar]
- Sabuncu M, Balci S, Shenton M, Golland P. IEEE Trans. Med. Imaging. 2009. Image-Driven population analysis through mixture modeling. In press. [DOI] [PMC free article] [PubMed] [Google Scholar]
- Sethian JA. A fast marching level set method for monotonically advancing fronts. Proc. Natl. Acad. Sci. USA. 1996;93:1591–1595. doi: 10.1073/pnas.93.4.1591. [DOI] [PMC free article] [PubMed] [Google Scholar]
- Shattuck DW, Leahy RM. Automated graph-based analysis and correction of cortical volume topology. IEEE Trans. Med. Imag. 2001;20(11):1167–1177. doi: 10.1109/42.963819. [DOI] [PubMed] [Google Scholar]
- Shattuck DW, Leahy RM. BrainSuite: an automated cortical surface identification tool. Med. Image Anal. 2002;6(2):129–142. doi: 10.1016/s1361-8415(02)00054-3. [DOI] [PubMed] [Google Scholar]
- Shattuck DW, Joshi AA, Pantazis D, Kan E, Dutton RA, Sowell ER, Thompson PM, Tog AW, Leahy RM. Semi-automated method fro delineation of landmarks on models of the cerebral cortex. J. Neurosci. Methods. 2009;178(2):385–392. doi: 10.1016/j.jneumeth.2008.12.025. [DOI] [PMC free article] [PubMed] [Google Scholar]
- Shen D, Davatzikos C. HAMMER: hierarchical attribute matching mechanism for elastic registration. IEEE Trans. Med. Imag. 2002;21(11):1421–1439. doi: 10.1109/TMI.2002.803111. [DOI] [PubMed] [Google Scholar]
- Shi Y, Thompson PM, Dinov I, Toga AW. Hamilton-Jacobi skeleton on cortical surfaces. IEEE Trans. Med. Imag. 2008;27(5):664–673. doi: 10.1109/TMI.2007.913279. [DOI] [PMC free article] [PubMed] [Google Scholar]
- Steger C. An unbiased detector of curvilinear structures. IEEE Trans. Pattern Anal. Mach. Intell. 1998;20(2):113–125. [Google Scholar]
- Sun ZY, Rivière D, Poupon F, Régis J, Mangin JF. Automatic inference of sulcus patterns using 3D moment invariants. International Conference on Medical Image Computing & Computer Assisted Intervention; 2007. pp. 515–522. [DOI] [PubMed] [Google Scholar]
- Tao X, Han X, Rettmann M, Prince JL, Davatzikos C. Statistical study on cortical sulci of human brains. International Conference on Information Processing in Medical Imaging; 2001. pp. 475–487. [Google Scholar]
- Tao X, Prince JL, Davatzikos C. Using a statistical shape model to extract sulcal curves on the outer cortex of the human brain. IEEE Trans. Med. Imag. 2002;21(5):513–524. doi: 10.1109/TMI.2002.1009387. [DOI] [PubMed] [Google Scholar]
- Thirion J-P. The extermal mesh and understanding of 3D surfaces. Int. J. Comput. Vis. 1996;19(2):115–128. [Google Scholar]
- Thirion J-P. Image Matching as a diffusion process: an analogy with Maxwell’s demons. Med. Image Anal. 1998;2(3):243–260. doi: 10.1016/s1361-8415(98)80022-4. [DOI] [PubMed] [Google Scholar]
- Thompson PM, Toga AW. A surface-based technique for warping three-dimensional images of the brain. IEEE Trans. Med. Imag. 1996;15(4):402–417. doi: 10.1109/42.511745. [DOI] [PubMed] [Google Scholar]
- Tosun D, Rettmann ME, Prince JL. Mapping techniques for aligning sulci across multiple brains. Med. Image. Anal. 2004;8:295–309. doi: 10.1016/j.media.2004.06.020. [DOI] [PMC free article] [PubMed] [Google Scholar]
- Tu Z, Zheng S, Yuille AL, Reiss AL, Dutton RA, Lee AD, Galaburda AM, Dinov I, Thompson PM, Toga AW. Automated extraction of the cortical sulci based on a supervised learning approach. IEEE Trans. Med. Imag. 2007;26(4):541–552. doi: 10.1109/TMI.2007.892506. [DOI] [PubMed] [Google Scholar]
- Vaillant M, Davatzikos C. Finding parametric representations of the cortical sulci using an active contour model. Med. Image. Anal. 1997;1(4):295–315. doi: 10.1016/s1361-8415(97)85003-7. [DOI] [PubMed] [Google Scholar]
- Vaillant M, Davatzikos C. Hierarchical matching of cortical features for deformable brain image registration. International Conference on Information Processing in Medical Imaging; 1999. pp. 182–195. [Google Scholar]
- Woods RP, Grafton ST, Watson JD, Sicotte NL, Mazziotta JC. Automated image registration. II: Intersubject validation of linear and nonlinear models. J. Comput. Assist. Tomogr. 1998;22(1):153–165. doi: 10.1097/00004728-199801000-00028. [DOI] [PubMed] [Google Scholar]
- Yang F, Kruggel F. Automatic segmentation of human brain sulci. Med. Image. Anal. 2008;12(4):442–451. doi: 10.1016/j.media.2008.01.003. [DOI] [PubMed] [Google Scholar]
- Zeng X, Staib LH, Schultz RT, Tagare H, Win L, Duncan JS. A new approach to 3D sulcal ribbon finding from MR images. International Conference on Medical Image Computing & Computer Assisted Intervention; 1999. pp. 148–157. [Google Scholar]
- Zhou Y, Thompson PM, Toga AW. Extracting and representing the cortical sulci. IEEE Comput. Graph. Appl. 1999;19(3):49–55. doi: 10.1109/38.761550. [DOI] [PMC free article] [PubMed] [Google Scholar]


