Abstract
BACKGROUND
Autophagy is a starvation induced cellular process of self-digestion that allows cells to degrade cytoplasmic contents. The understanding of autophagy, as either a mechanism of resistance to therapies that induce metabolic stress, or as a means to cell death, is rapidly expanding and supportive of a new paradigm of therapeutic starvation.
METHODS
To determine the effect of therapeutic starvation in prostate cancer, we studied the effect of the prototypical inhibitor of metabolism, 2-deoxy-D-glucose (2DG), in multiple cellular models including a transfected pEGFP-LC3 autophagy reporter construct in PC-3 and LNCaP cells.
RESULTS
We found that 2DG induced cytotoxicity in PC-3 and LNCaP cells in a dose dependent fashion. We also found that 2DG modulated checkpoint proteins cdk4, and cdk6. Using the transfected pEGFP-LC3 autophagy reporter construct, we found that 2DG induced LC3 membrane translocation, characteristic of autophagy. Furthermore, knockdown of beclin1, an essential regulator of autophagy, abrogated 2DG induced autophagy. Using Western analysis for LC3 protein, we also found increased LC3-II expression in 2DG treated cells, again consistent with autophagy. In an effort to develop markers that may be predictive of autophagy, for assessment in clinical trials, we stained human prostate tumors for Beclin1 by immunohistochemistry (IHC). Additionally, we used a digitized imaging algorithm to quantify Beclin1 staining assessment.
CONCLUSIONS
These data demonstrate the induction of autophagy in prostate cancer by therapeutic starvation with 2DG, and support the feasibility of assessment of markers predictive of autophagy such as Beclin1 that can be utilized in clinical trials.
Keywords: prostate cancer, deoxyglucose, beclin1, autophagy, glycolysis, metabolism
INTRODUCTION
The relentless progression of advanced prostate cancer is only temporarily disrupted by current therapeutic interventions including androgen ablation therapy or chemotherapy [1,2]. Prostate cancer cells become resistant by inactivating normal pathways of cell death and activating pathways of cell survival, but our knowledge of these mechanisms is incomplete.
One area that has received renewed attention is the metabolic fragility of cancer cells, which preferentially utilize glycolysis to metabolize glucose rather than oxidative phosphorylation. This difference, initially termed “The Warburg effect,” remains one of the fundamental features that distinguishes normal cells from tumor cells [3,4]. Whereas aerobic metabolism can generate 36 molecules of ATP per molecule of glucose, anaerobic glycolysis can only generate two. This fragility is magnified because cancer cells must survive in hostile environments with poor blood supply, limited oxygen, reduced growth factors, limited nutrients, and high metabolic demand. Our prior studies demonstrated induction of multiple glycolytic enzymes resulting from autocrine stimulation specifically in prostate cancer cells, suggesting that inhibition of glycolysis would exploit the metabolic fragility of prostate cancer [5].
Few studies to date have been completed with agents that directly target glycolysis to induce cytotoxicity, despite diagnostic studies developing positron emission tomography (PET), which uses a trapped glucose analogue, 2-deoxy-d-glucose (2DG), for detection of tumor. For example, Liu et al. [6] demonstrated that osteosarcoma cells that were defective in oxidative phosphorylation were 10-fold more sensitive to 2DG and 5-fold more sensitive to oxamate compared to wild type cells, demonstrating that cells relying on glycolytic pathways are sensitive to these anti-glycolytic agents. Munoz-Pinedo et al. [7] demonstrated that 2DG enhanced apoptosis induced by tumor necrosis factor, CD95 agonistic antibody and TRAIL in multiple tumor cell lines. Aft et al. [8] demonstrated activity of 2DG in an in vivo mouse breast tumor model. Additionally, Kurtoglu et al. [9] supported the hypothesis that additional mechanisms of cytotoxicity of 2DG occur including inhibition of N-linked glycosylation. As further studies of agents that inhibit glycolysis, such as 2DG, are ongoing in the laboratory and the clinic, an understanding of additional potential mechanisms of activity and drug resistance will be important.
In this regard, the process of autophagy, which is induced by nutrient deprivation, has been identified as an important mechanism of cellular resistance, or alternatively cell death if allowed to continue unabated [10–12]. Autophagy is a response to starvation whereby cellular organelles and bulk cytoplasm are targeted to lysosomes for degradation to supply an alternate energy source during periods of nutrient limitation. In addition to nutrient recycling, autophagy also plays an essential role in the proteolytic degradation of damaged proteins and organelles to maintain quality control. Sustained autophagy under conditions of protracted starvation has also been proposed to lead to cell death; thus, the survival or death consequences of autophagy are condition-dependent. Autophagy is also often impaired in human prostate cancers, due to either activation of the PI-3 kinase/Akt pathway and thereby mTOR, which inhibits autophagy, or through allelic loss of the essential autophagy gene beclin1 [11]. Therefore, growth in a hostile environment, inefficient utilization of glucose and defective autophagy predict that prostate cancers may be particularly sensitive to therapies that inflict metabolic stress.
We, therefore, hypothesize that prostate cancer is metabolically fragile because of dependence on glycolysis, increased activity of Akt, and impaired autophagy. This creates an opportunity to improve therapy through promotion of metabolic stress with agents that inhibit glycolysis. To begin to understand this novel paradigm, we studied the effect of a prototypical inhibitor of glycolysis, 2DG, a glucose analogue that inhibits glucose uptake, to determine if, in fact, 2DG induces cytotoxicity and autophagy in prostate cancer cells. To develop markers of autophagy for assessment in clinical trials, we studied Beclin1 in our cell systems and human prostate tissue from patients with prostate cancer.
MATERIAL AND METHODS
Cell Culture and Viability Assay
PC-3 (human androgen insensitive prostate cancer cell line), LNCaP (human androgen sensitive prostate cancer cell line) were obtained from ATCC. LNCaP and PC-3 cells were maintained in RPMI-1640 media with glucose concentration 2 g/L and 10% FBS. 2DG was obtained from Sigma (St. Louis, MO). Cells were plated initially in 96-well microtiter plates. After 24 hr they were treated with different concentrations of 2DG. After 72 hr of incubation in the presence or absence of drug, viability studies were performed by the MTT method as previously described [13]. Trypan Blue exclusion viability assay was performed on cells plated in 100 mm dishes. Cells were removed with trypsin after 72 hr and triplicate samples from each dish were counted on VI-Cell (Beckman Coulter Fullerton, CA). Mean and standard error was calculated. Time lapse microscopy was performed as previously described [14].
RNA Interference
LNCaP and PC-3 cells were transfected with annealed, purified, and desalted double-stranded siRNA (30 μg/3×106 cells) using the Amaxa nucleofection system (Gaithersburg, MD) (kit V, program G-16), as previously demonstrated [14]. siRNA targeted against beclin1 (5′-CAGUUUGGCACAAUCAAUAUU-3′) and LaminA/C were obtained from Dharmacon Research (Lafayette, CO).
Fluorescence Microscopy/LC3-GFP Autophagy Assay
LNCaP and PC-3 cells were co-transfected with EGFP-LC3 reporter along with LaminA/C siRNA (control) or beclin1 siRNA and plated on cover slips, treated with 2DG and cultured in maintenance media. After 72 hr cover slips were fixed in Formalde-Fresh solution (Fisher Scientific, Pittsburgh, PA). Following the washing and mounting the cover slips, the cells with GFP translocation were counted (>30 total) and photographed using fluorescence microscope (Nikon).
Immunoblot Analysis
Cells treated with 2DG were lysed in ice-cold RIPA buffer with protease inhibitors cocktail from (Sigma). Equivalent amounts of protein from each sample were electrophoresed on 12% or 15% gel SDS–PAGE and transferred to nitrocellulose. For cell cycle protein assessment, Cyclin D1, Cdk4, Cdk6 and secondary goat anti-mouse HRP conjugated antibody were used (Sigma). Beclin1 was assessed using rabbit primary antibody (Santa Cruz Biotechnology, Inc., cat # sc-11427, Santa Cruz, CA). LC3 was assessed using primary rabbit antibody from MBL International (Woburn, MA) and secondary goat anti-rabbit HRP conjugated antibody (Santa Cruz Biotechnology, Inc.). Cleaved Caspase3 antibody was obtained from Cell Signaling (Beverly, MA).
Immunohistochemistry of TMA
Tissue microarray slides with paraffin embedded prostate cores were placed into a Ventana Medical Systems Discovery automated slide stainer, heated to 75°C for 8 min. Deparaffinzation (de-waxing) of tissues is accomplished using heat and Ventana de-waxing solutions for 8–10 min. Slides were washed in buffer at 37°C for 10 min. Antigen retrieval is performed for over 72 min at a pH 8 using EDTA buffer. Anti-BECN1 (H-300) (Santa Cruz Biotechnology, Inc., cat # sc-11427) was applied to the tissue sections at a dilution of 1:240 with 1% BSA/PBS with amplification and incubated overnight at room temperature. Biotinylated secondary antibody (Discovery Universal detection #2) was applied to the tissue sections and developed with Ventana Strept-Avidin Horseradish Peroxidase. Hem-atoxlyn was used as a tissue counterstain.
Imaging
Immunostained tissue microarrays were imaged and digitized using a 40× volume scan on a high-throughput Trestle/Clarient MedMicro whole slide scanner. The resulting imaged specimens were stored in multi-tiled TIFF format on a redundant array of independent devices (RAID). Tissue Microarray analysis software automatically performs registration of the arrays, decomposes the specimen into its constituent staining maps and generates the measures for integrated staining intensity (ISA), effective staining area (ESA), and effective staining intensity (ESI) [15]. The software manages imaged tissue microarrays along with all related descriptive text and data fields into an Oracle 10 g database. The expression metrics that are generated during processing are automatically populated into the database and can be used to query and locate any given imaged specimen and correlated dataset to facilitate subsequent retrieval.
RESULTS
Effectof 2DGin Cancer Cell Lines
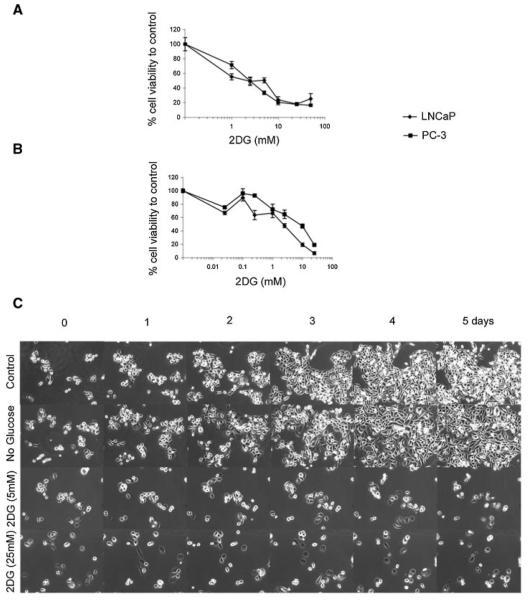
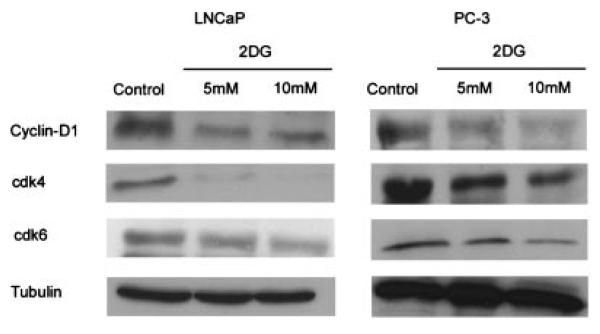
To determine if 2DG inhibits prostate cancer cell viability, we treated LNCaP and PC-3 cells with increasing concentrations of 2DG. As shown in Figure 1, both LNCaP cells and PC-3 cells are inhibited by 2DG in a dose dependent fashion. The cytotoxic effect was demonstrated by cell counts using a trypan blue assay (Fig. 1A) and an MTT cell viability assay (Fig. 1B). To determine the effect of 2DG over time, we observed morphological changes by time-lapse microscopy over 5 days (100×). As shown in Figure 1C, proliferation was decreased more by therapeutic starvation with exposure of cells to 2DG (bottom two rows) compared to control (top row) or compared to cells in which glucose was absent from the media (although present in added serum). To determine the effect of 2DG on cell cycle checkpoint proteins, we assessed the effect of 2DG on expression of Cyclin-D1, cdk4, and cdk6. As shown in Figure 2, 2DG decreased expression of Cyclin-D1, cdk4, and cdk6 in both LNCaP and PC-3 cells. Thus, 2DG arrests cell growth and promotes cell death of prostate cancer cell lines in a dose-dependent fashion.
Fig. 1.
Effect of 2DG on prostate cancer cell viability. LNCaP and PC-3 cells were treated with various concentrations of 2DG over 72 hr and assessed by cell counts with trypan blue (A) and MTT assay (B). Both LNCaP cells and PC-3 cells were inhibited by 2DG in a dose dependent fashion. Experiments were performed in triplicate ±SEM. To determine the effect of 2DG on cellular morphology, morphological changes in PC-3 cells were observed with time-lapse microscopy (100×) (C). Cells were treated with vehicle (Control), no glucose in media (except that contained in added serum), 5 and 25 mM 2DG over 5 days.
Fig. 2.
Effect of 2DG on cell cycle checkpoint proteins. Cyclin-D1, cdk4, and cdk6 were assessedby immunoblot following treatment with 5 and 10 mM 2DG. 2DG decreased expression of Cyclin D1, Cdk4, Cdk6 in LNCaP and PC-3 cells relative to tubulin, which was used to control for protein loading.
Autophagy and Beclin-1 in Tumor Cell Lines
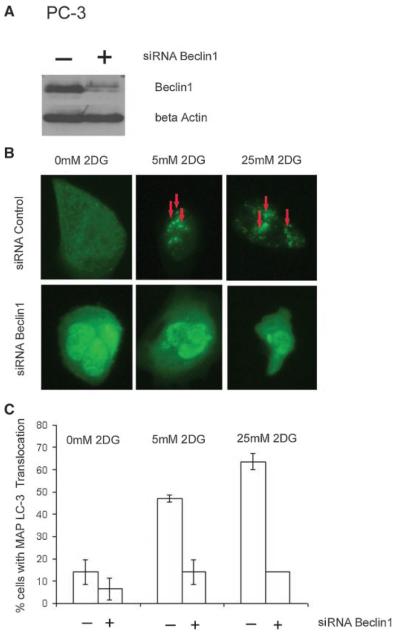
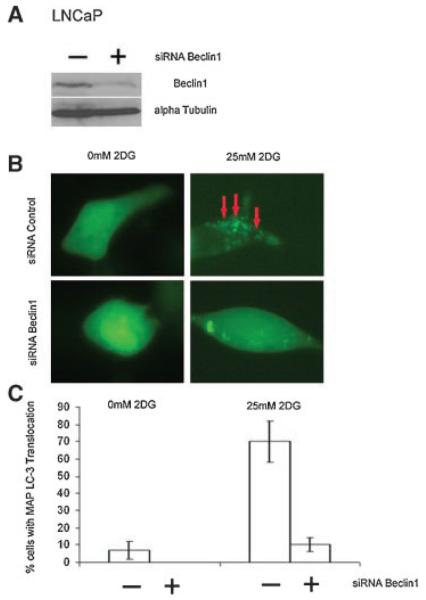
To determine the effect of 2DG on autophagy, we expressed the fluorescent autophagy marker GFP-LC3 in LNCaP and PC3 cells, and modulated the expression of the autophagy regulator Beclin1 with siRNA. As shown in Figure 3A, siRNA for Beclin1 efficiently decreased expression in PC-3 cells compared to control siRNA. Treatment of 2DG induced autophagy as demonstrated by redistribution of the autophagosome marker GFP-LC3 from a diffuse cyoplasmic pattern to form punctate localization indicative of autophagosome formation (Fig. 3B shows a photograph of representative cells and C quantification of percentage of cells with punctate redistribution). In Figure 3B, the arrows identify punctate localization in cells treated with 2-DG, which do not develop with Beclin1 siRNA treatment (second row of Fig. 3B). As shown in Figure 3C, over 40% of cells contain such punctate GFP-LC3 localization with 5 mM 2DG, which is decreased to less than 20% of cells with the addition of Beclin1 siRNA. To determine if the effect of 2DG to induce Beclin1 dependent autophagy was limited to PC-3 cells, we also assessed the effect of 2DG in LNCaP cells. As shown in Figure 4, treatment of LNCaP cells with 2DG resulted in similar decreased Beclin1 with siRNA (A) and increased autophagy, as demonstrated by punctate distribution of LC-3 (B,C). As was the case with PC-3 cells, 2DG induced autophagy in LNCaP cells was also dependent on Beclin1 expression.
Fig. 3.
Induction of Beclin1-dependent autophagy by 2DG in human PC3 cells. A: Western blot for Beclin1 and the actin control of PC3 cells treated with Beclin1 siRNA (+) or lamin control (−)siRNA. Beclin1 protein levels were reduced specifically by Beclin1 siRNA. B: Representative examples of predominantly diffuse EGFP-LC3 localization without 2DG (0 mM 2DG) and membrane translocation (red arrows) upon 2DG treatment (5 and 25 mM) in the upper row are shown. This punctate pattern represents the localization of the marker GFP-LC3 in autophagosome formation. The localization of GFP-LC3 is abrogatedby Beclin1 siRNA (all three lower panels in 3B). C: Quantitation of the percentage of counted cells that contained EGFP-LC3 localization indicative of autophagy after treatment with 2DG A decrease in the percentage of cells with punctate localization of EGFP-LC3 was noted with treatment of Beclin1 siRNA. Each bar represents the percentage of cells with the translocation±SEM.
Fig. 4.
Induction of Beclin1-dependent autophagy by 2DG in human LNCaP cells. A: Western blot for Beclin1 and the actin control of LNCaP cells treated with lamin control siRNA or Beclin1 siRNA. B: Representative examples of predominantly diffuse EGFP-LC3 localization without 2DG (0 mM 2-DG) and membrane translocation (red arrows) upon 2DG treatment (25 mM) in the upper row are shown. This punctate pattern represents the localization of the marker GFP-LC3 in autophagosome formation. The localization of GFP-LC3 is abrogated by Beclin1 siRNA (lower panels in 4B). C: Quantitation of the EGFP-LC3 localization showing induction of autophagy with 2-DG that isinhibited by siRNA for Beclin1. Each bar represents the percentage of cells with the translocation ±SEM.
Effect of 2DG on LC3 and Caspase Activation
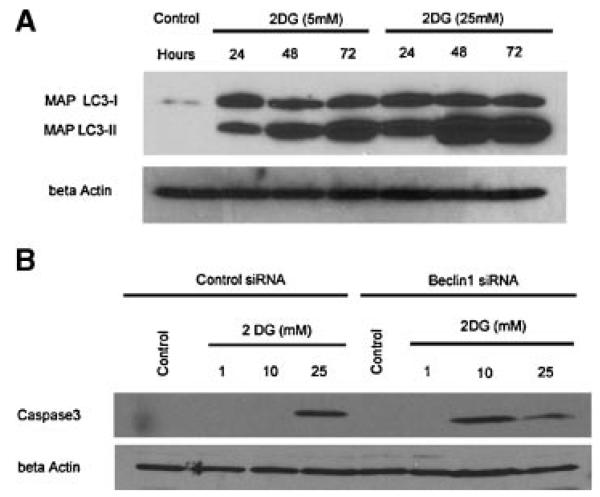
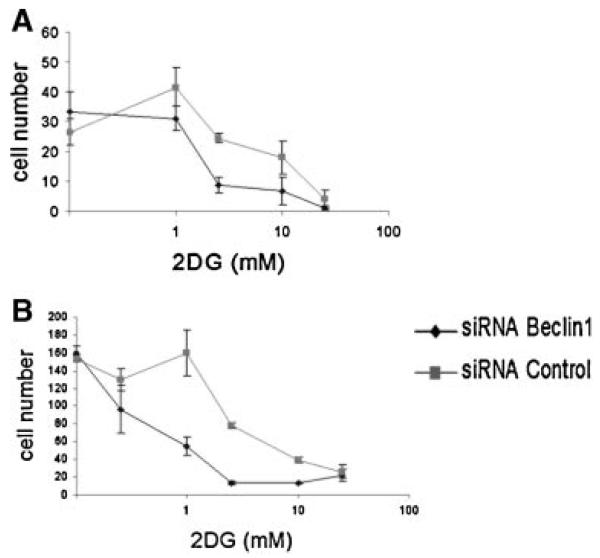
To further assess the effect of 2DG on autophagy, we also assessed the expression of LC3 protein by Immunoblot. As shown in Figure 5A, LC3-II protein increased relative to LC3-I protein, as would be expected with induction of autophagy over 72 hr of treatment with 5 or 25 mM 2DG. To begin to determine the effect of Beclin1 on apoptotic proteins such as caspase-3, we assessed the effect of 2DG on the cleaved (activated fragment of caspase-3). As shown in Figure 5B, caspase-3 is cleaved to the active fragment in PC3 cells treated with 2DG. Of note, treatment of Beclin1 siRNA, which was shown to abrogate autophagy (Figs. 3 and 4), allowed increased activation of caspase-3 at lower 2DG concentration, suggesting that Beclin1 and autophagy were associated with resistance to apoptosis with these specific experimental conditions, and at concentrations more relevant to what can be achieved in patients. The effect of autophagy on 2DG induced cytotoxicity was further assessed by a cytotoxicity assay. LNCaP and PC-3 cells were treated with various concentrations of 2DG over 72 hr, with and without beclin1 siRNA or Lamin control, and assessed by cell counts with trypan blue (Fig. 6). Both LNCaP cells and PC-3 cells were inhibited by 2DG in a dose dependent fashion, and cytotoxicity increased with Beclin1 siRNA, consistent with the hypothesis that autophagy was a mechanism of resistance of 2DG induced cytotoxicity.
Fig. 5.
Effect of 2DG on LC3 protein (A) and caspase 3 (B).LC3-I and LC3-II protein is shown by immunoblot after treatment with 5 and 25 mM of 2DG at 24,48, and 72 hr showing the characteristic increasein proportion of LC3-II/LC3-I expected with induction of autophagy (A). To determine the importance of Beclin1 in 2DG induced apoptosis, we assessed the activated cleavage product of caspase3 in PC3 cells by immunoblot after treatment with 2DG (B). Cells were treated with Lamin siRNA (control) or Beclin1 siRNA demonstrating activation and cleavage of caspase3 after treatment with 10 mM 2DG only in the setting of Beclin1 siRNA treatment, which decreased Beclin1 expression (Figs. 3A and 4A) and decreases autophagy (Figs. 3B and 4B). After treatment with 25 mM 2DG, caspase3 is activated and cleaved regardless of beclin1 expression. Actin was used as a control for equal protein loading.
Fig.6.
Effect of autophagy on 2DG induced cytotoxicity. LNCaP (A) and PC-3 (B) cells were treated with various concentrations of 2DG over 72 hr, with and without beclin1 siRNA or Lamin control, and assessed by cell counts with trypan blue. Both LNCaP cells and PC-3 cells were inhibited by 2DG in a dose dependent fashion, and cytotoxicity increased with Beclin1 siRNA. Experiments were performed in triplicate±SEM.
Beclin-1 Expression in Human Tissue
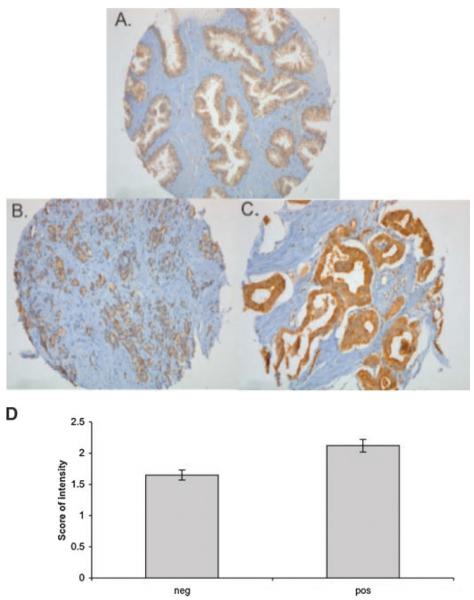
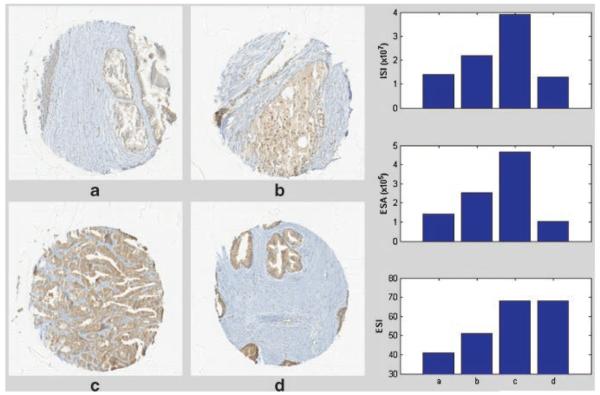
Because of the dependence of therapeutic starvation-induced autophagy on Beclin1, it would be important to develop this as a translational marker of clinical trials that develop agents that induce metabolic starvation. To determine the feasibility of measuring Beclin1 expression in human prostate tissue, we stained a human prostate tissue microarray by immunohisto-chemistry (IHC). As shown in Figure 7, the characteristic staining of beclin1 was in epithelial cells in normal (Fig. 7A) and cancer (Fig. 7B,C). As shown in Figure 7D, Beclin1 staining intensity (scored by a single pathologist, M.M., from 0 to 3) was increased in tumor tissue compared to normal tissue. In an effort to develop a standardized methodology for quantifying Beclin1, for use in clinical trial correlatives, we performed quantitative digitized image analysis of the tissue microarray. As shown in Figure 8, a color decomposition analysis of tissue staining generated the corresponding measures for integrated staining intensity, effective staining area and effective staining intensity. Thus, Beclin1 can be assessed effectively with IHC in human tissue and quantified by automated digitized imaging, providing a complete assessment methodology to test in clinical studies.
Fig. 7.
Tissue microarray of Beclin1 staining. IHC of Beclin1 from the CINJ prostate TMA. Staining is shown for Beclin1 innormal (A) and 1+ (B) and 3+ (C) intensity in tumor. D: Bar graph of percentage of patient tissue microarrays with Beclin1 staining in normal tissue (neg) and cancer (pos).
Fig. 8.
Quantitative digitized imaging of tissue microarray. As shown in panels a–d, arrays were imaged using a 40× volume scan on a Trestle/Clarient whole slide scanner. The diagram located in the right hand column of the figure was generated using color decomposition analysis and shows measures for ISA, ESA, and ESI as previously demonstrated [15].
DISCUSSION
Targeting metabolism is an attractive new paradigm for investigation because of increased metabolic fragility of cancer. The understanding and development of clinically available therapies capable of modulating metabolism is critically important. We found that 2DG, a prototypical inhibitor of glycolysis, was cytotoxic in prostate cancer cells. Additionally, we found that 2DG induced the state of autophagy, now known to modulate the effectiveness of targeting metabolism in tumor cells. Autophagy is thought to be a resistance mechanism to cellular stress, or, alternatively, if left to completion, a cause of cell death. Additionally, we demonstrated the importance of Beclin1 as a regulator of autophagy and established methodology to quantitatively assess Beclin1 in human tissue. These data, therefore, support future translational efforts by providing a rationale to assess therapeutics that target metabolism, by demonstrating that autophagy may be a mechanism that modulates cell death, by providing support for the importance of Beclin1 as a regulator of autophagy, and by establishing methodology for the assessment of Beclin1 in patient material in future clinical trials.
The finding that 2DG induced autophagy is important because this may represent either a mechanism of cell death or survival that warrants further study with agents developed for therapeutic starvation such as 2DG. Autophagy is conserved, genetically controlled catabolic response to starvation whereby cells self-digest intracellular organelles by targeting them for degradation in lysosomes to generate energy. This may serve to regulate normal turnover of organelles and to remove those with compromised function to maintain homeostasis. Autophagy can also be a survival mechanism during periods of starvation where self-digestion provides an alternative energy source and facilitates the disposal of unfolded proteins under stress conditions. It has recently become clear that normal and tumor cells require the catabolic process of autophagy to survive nutrient deprivation [11]. We found that autophagy was dependent on Beclin1 (Figs. 3 and 4) and functioned as a survival mechanism under our experimental conditions (Figs. 5 and 6), which is consistent with prior studies [16]. We also found that Beclin1 can be detected in human tumor by IHC, establishing the feasibility of measuring Beclin1 in prostate tissue (Figs. 7 and 8), and realize that additional studies would be needed to determine if intensity of expression is associated with the propensity of tumor to undergo autophagy. The implication of measuring beclin1 in human tumor is currently unclear, and the current assessment was focused to demonstrate the feasibility of assessing beclin1 by IHC in a small group of patient samples, and to quantify the intensity for use in larger clinical studies. This may be particularly important in prostate cancer because multiple studies have demonstrated that the beclin1 (atg6, vps30) gene is critical for autophagy to occur and allelic loss occurs with high frequency in prostate cancers [17]. Establishing the role of autophagy in prostate cancer is, therefore, an important step toward understanding the disease process and for the development of new treatments that modulate metabolism [18]. Furthermore, prior studies have demonstrated that activation of the PI-3K/Pten/Akt pathway also promotes glycolysis (in part through up-regulation of glycolytic enzymes and glucose transporters), and stimulates protein synthesis while inhibiting autophagy [4]. Thus, one of the most important events in prostate cancer profoundly alters the cellular metabolic state by increasing energy demand (stimulation of protein synthesis) while promoting inefficient energy production (dependence on glycolysis) and inhibiting catabolism (autophagy).
Therefore, it is our hypothesis that the oncogenic switch from aerobic to glycolytic metabolism, known for decades as the “Warburg effect,” causes tumor cells to be predisposed to metabolic catastrophe where constitutive growth signals and inefficient energy production impair their ability to adapt to metabolic stress [10]. This fundamental difference between normal and tumor cells has yet to be exploited effectively in the clinic. Our data supports the importance of autophagy in the study of such approaches and gives direction toward the clinical translation of this important paradigm.
Acknowledgments
Grant sponsor: Department of Defense; Grant number: W81XWH-05-1-0036.
Footnotes
CONFLICT OF INTEREST
Views and opinions of, and endorsements by, the authors do not necessarily reflect those of the Department of Defense.
REFERENCES
- 1.Petrylak DP. Future directions in the treatment of androgen-independent prostate cancer. Urology. 2005;65:8–12. doi: 10.1016/j.urology.2005.04.020. [DOI] [PubMed] [Google Scholar]
- 2.DiPaola RS, Patel J, Rafi MM. Targeting apoptosis in prostate cancer. Hematol Oncol Clin North Am. 2001;15(3):509–524. doi: 10.1016/s0889-8588(05)70229-x. [DOI] [PubMed] [Google Scholar]
- 3.Weinhouse S. The, Warburg hypothesis fifty years later. Z Krebsforsch Klin Onkol Cancer Res Clin Oncol. 1976;87(2):115–126. doi: 10.1007/BF00284370. [DOI] [PubMed] [Google Scholar]
- 4.Deberardinis RJ, Lum JJ, Hatzivassiliou G, Thompson CB. The biology of cancer: Metabolic reprogramming fuels cell growth and proliferation. Cell metabolism. 2008;7(1):11–20. doi: 10.1016/j.cmet.2007.10.002. [DOI] [PubMed] [Google Scholar]
- 5.Dvorzhinski D, Thalasila A, Thomas PE, Nelson D, Li H, White E, DiPaola RS. A novel proteomic coculture model of prostate cancer cell growth. Proteomics. 2004;4(10):3268–3275. doi: 10.1002/pmic.200400847. [DOI] [PubMed] [Google Scholar]
- 6.Liu H, Savaraj N, Priebe W, Lampidis TJ. Hypoxia increases tumor cell sensitivity to glycolytic inhibitors: A strategy for solid tumor therapy (Model C) Biochem Pharmacol. 2002;64(12):1745–1751. doi: 10.1016/s0006-2952(02)01456-9. [DOI] [PubMed] [Google Scholar]
- 7.Munoz-Pinedo C, Ruiz-Ruiz C, Ruiz de Almodovar C, Palacios C, Lopez-Rivas A. Inhibition of glucose metabolism sensitizes tumor cells to death receptor-triggered apoptosis through enhancement of death-inducing signaling complex formation and apical procaspase-8 processing. J Biol Chem. 2003;278(15):12759–12768. doi: 10.1074/jbc.M212392200. [DOI] [PubMed] [Google Scholar]
- 8.Aft RL, Lewis JS, Zhang F, Kim J, Welch MJ. Enhancing targeted radiotherapy by copper(II)diacetyl- bis(N4-methylthiosemicarbazone) using 2-deoxy-D-glucose. Cancer Res. 2003;63(17):5496–5504. [PubMed] [Google Scholar]
- 9.Kurtoglu M, Gao N, Shang J, Maher JC, Lehrman MA, Wangpaichitr M, Savaraj N, Lane AN, Lampidis TJ. Under normoxia, 2-deoxy-D-glucose elicits cell death in select tumor types not by inhibition of glycolysis but by interfering with N-linked glycosylation. Mol Cancer Ther. 2007;6:3049–3058. doi: 10.1158/1535-7163.MCT-07-0310. [DOI] [PubMed] [Google Scholar]
- 10.Jin S, DiPaola RS, Mathew R, White E. Metabolic catastrophe as a means to cancer cell death. J Cell Sci. 2007;120(Pt 3):379–383. doi: 10.1242/jcs.03349. [DOI] [PMC free article] [PubMed] [Google Scholar]
- 11.Mathew R, Karantza-Wadsworth V, White E. Role of autophagy in cancer. Nat Rev Cancer. 2007;7(12):961–967. doi: 10.1038/nrc2254. [DOI] [PMC free article] [PubMed] [Google Scholar]
- 12.Amaravadi RK, Yu D, Lum JJ, Bui T, Christophorou MA, Evan GI, Thomas-Tikhonenko A, Thompson CB. Autophagy inhibition enhances therapy-induced apoptosis in a Myc-induced model of lymphoma. J Clin Invest. 2007;117:326–336. doi: 10.1172/JCI28833. [DOI] [PMC free article] [PubMed] [Google Scholar]
- 13.Ioffe ML, White E, Nelson DA, Dvorzhinski D, DiPaola RS. Epothilone induced cytotoxicity is dependent on p53 status in prostate cells. Prostate. 2004;61(3):243–247. doi: 10.1002/pros.20108. [DOI] [PubMed] [Google Scholar]
- 14.Degenhardt K, Mathew R, Beaudoin B, Bray K, Anderson D, Chen G, Mukherjee C, Shi Y, Gelinas C, Fan Y, Nelson DA, Jin S, White E. Autophagy promotes tumor cell survival and restricts necrosis, inflammation, and tumorigenesis. Cancer Cell. 2006;10:51–64. doi: 10.1016/j.ccr.2006.06.001. [DOI] [PMC free article] [PubMed] [Google Scholar]
- 15.Chen W, Reiss M, Foran DJ. A prototype for unsupervised analysis of tissue microarrays for cancer research and diagnostics. IEEE Trans Inf Technol Biomed. 2004;8(2):89–96. doi: 10.1109/titb.2004.828891. [DOI] [PubMed] [Google Scholar]
- 16.Karantza-Wadsworth V, Patel S, Kravchuk O, Cheng G, Mathew R, Jin S, White E. Autophagy mitigates metabolic stress and genome damage in mammary tumorigenesis. Genes Dev. 2007;21(13):1621–1635. doi: 10.1101/gad.1565707. [DOI] [PMC free article] [PubMed] [Google Scholar]
- 17.Aita VM, Liang XH, Murty VV, Pincus DL, Yu W, Cayanis E, Kalachikov S, Gilliam TC, Levine B. Cloning and genomic organization of beclin 1, a candidate tumor suppressor gene on chromosome 17q21. Genomics. 1999;59:59–65. doi: 10.1006/geno.1999.5851. [DOI] [PubMed] [Google Scholar]
- 18.Amaravadi RK, Thompson CB. The roles of therapy-induced autophagy and necrosis in cancer treatment. Clin Cancer Res. 2007;13(24):7271–7279. doi: 10.1158/1078-0432.CCR-07-1595. [DOI] [PubMed] [Google Scholar]


