

Abstract
Although neuroadaptations in the nucleus accumbens (NAc) are thought to contribute to nicotine addiction, little is known about the chronic effects of nicotine on NAc neuronal activity. In the present experiment, rats were exposed to a 23 d period of nicotine self-administration (SA), a 30 d abstinence period, and a 7 d period of reexposure to SA. Chronic electrophysiological procedures were used to record the activity of individual NAc neurons on the 3rd and 23rd days of initial SA and on the 1st, 3rd, and 7th days of reexposure. Between-session comparisons showed that NAc neurons exhibit two patterns of plasticity under the present experimental conditions. First, phasic-increase firing patterns time-locked to the nicotine-reinforced lever press do not change during initial SA, but then show increases in prevalence and amplitude after abstinence, which persist during reexposure. Second, for neurons that show no phasic response time-locked to the nicotine-reinforced lever press, average baseline and SA firing rates decrease during initial SA, return to normal during abstinence, and decrease again during reexposure. As a combined consequence of the two types of neurophysiological plasticity, average firing rate of NAc neurons at the time of nicotine-directed behavior undergoes a progressive and persistent net amplification, across the successive stages of SA, abstinence, and reexposure. This net increase in NAc firing at the time of nicotine-directed behavior occurs in association with an increase in animals' motivation to seek nicotine. The adaptations that occur in nicotine-exposed animals do not occur in animals exposed to sucrose. The NAc neurophysiological plasticity potentially contributes to compulsive tobacco use.
Introduction
Tobacco is a drug of significant abuse worldwide, with serious associated pathologies and costs to society (Shiffman et al., 1998; Henningfield et al., 2000). Given adequate drug exposure, individuals develop an addiction to nicotine, the primary active ingredient of tobacco. Drug addiction is a progressive and chronic disorder: individuals gradually transition from controlled to compulsive drug seeking and taking, and exhibit a high incidence of relapse even after extended periods of abstinence (Lerman et al., 2007). It is hypothesized that the development and chronicity of compulsive nicotine-directed behavior are mediated by drug-induced neuroadaptations, which progress and persist across cycles of drug taking and abstinence (Koob and Le Moal, 1997; Nestler and Aghajanian, 1997; Everitt and Wolf, 2002; Nestler, 2004). The nucleus accumbens (NAc) is considered a key structure underlying addiction to nicotine and other drugs (Stein et al., 1998; Koob and Le Moal, 2001; Everitt and Wolf, 2002; Brody et al., 2004). Based on these observations, identifying nicotine-induced NAc neuroadaptations that develop and persist across cycles of drug taking, abstinence, and reexposure is an important step toward understanding and ultimately treating drug addiction.
In the present study, chronic electrophysiological recordings were used to test for nicotine-induced adaptations (i.e., plasticity) in NAc neuronal activity that develop and persist across stages of nicotine self-administration (SA), abstinence, and reexposure. The recordings showed that NAc neurons undergo unique plasticity during stages of drug taking versus extended abstinence (i.e., referred to as stage-specific plasticity). The neurons also exhibit forms of plasticity that vary depending on the response of the neurons during daily self-administration sessions (i.e., referred to as activity-dependent plasticity). The nicotine-induced stage-specific and activity-dependent plasticity is associated with a progressive and persistent net increase in neuronal activity associated with nicotine-directed behavior, as well as with an enhanced motivation to engage in nicotine-directed behavior. The observed NAc neurophysiological plasticity enhances our understanding of nicotine-induced plasticity, particularly with respect to nicotine SA, abstinence, and reexposure. The findings are relevant to identifying mechanisms that contribute to compulsive nicotine-directed behavior.
Materials and Methods
Subjects
Subjects were 18 male Long–Evans rats. Protocols were in accordance with the Guide for the Care and Use of Laboratory Animals published by the Public Health Service and approved by the Animal Care and Use Committee of the University of Pennsylvania.
Surgery and postoperative maintenance
Animals were deeply anesthetized with ketamine (30 mg/kg, i.p.) and xylazine (5 mg/kg, i.p.) and an indwelling catheter (SILASTIC tubing: 0.012 inch inner diameter, 0.025 inch outer diameter; Dow Corning) was surgically implanted into the external jugular vein. The catheter was secured to the vein with surgical silk sutures and passed subcutaneously to the top of the back where it exited into a connector (modified 22 gauge cannula). Under isoflurane anesthesia, arrays of 16 Teflon-coated stainless-steel microwires were bilaterally implanted in the accumbens [anteroposterior, +0.7 to +2.7 mm; mediolateral, ±0.8 to ±2.2 mm, relative to bregma; and dorsoventral, −6.8 to −7.2 mm relative to level skull (Paxinos and Watson, 2004)]. A stainless-steel ground wire was also implanted 4 mm into the ipsilateral side of the brain, 5 mm caudal to bregma. Animals had ad libitum access to water but were restricted to 15–20 g of food each day to maintain body weight at ∼360–380 g. After surgery, animals were flushed daily with 0.2 ml of an ampicillin solution (0.1 g/ml) containing heparin (300 IU/ml) to maintain patency. A detailed description of surgical and postoperative procedures was provided in previous reports (Peoples, 2003; Guillem et al., 2005).
Chronic extracellular recordings
Procedures.
Voltage signals from each microwire were recorded, amplified up to 32,000×, processed, and digitally captured using commercial hardware and software (Plexon). Single units were discriminated off-line with principal component analysis (Offline Sorter; Plexon). The quality of individual-neuron recordings was ensured with the following criteria: <3% of all interspike intervals exhibited by the unit were <1900 μs, and the average amplitude of the unit waveform was at least three times larger than that of the noise band. The average amplitude of recorded neural waveforms was 156 μV. Electrophysiological data were analyzed using NeuroExplorer (Plexon) and MatLab (The MathWorks).
Between-group and between-session stability of electrophysiological recordings.
Average waveform amplitude and number of neurons recorded per animal were quantified for all recording sessions. Comparisons of these measures between days and groups showed that the characteristics of the electrophysiological recordings were stable across the different recording sessions and were comparable between the nicotine and sucrose groups (supplemental Fig. 1, available at www.jneurosci.org as supplemental material).
Operant-conditioning apparatus
Behavioral procedures were performed in operant chambers housed inside sound-attenuating cubicles. Chambers were equipped with a retractable lever, a house light mounted on the ceiling, a signal light above the response lever, a white noise generator, and a tone generator. Operant equipment, hardware, and control software were purchased from MED Associates.
Experimental procedures
Nicotine and sucrose SA sessions.
For the nicotine group, the start of each nicotine SA session was signaled by the illumination of a house light and the insertion of a lever. Animals self-administered the nicotine reinforcer on a fixed-ratio 1 (FR1) schedule of reinforcement. Each reinforced lever press was followed by an intravenous nicotine infusion (i.e., 30 μg/kg per infusion, free base, in 0.2 ml over 7.5 s), a 10 s tone, a 10 s illumination of the light above the lever, and the retraction of the lever. A 60 s time-out preceded the reinsertion of the lever and the start of the next trial. At the end of the session, the house light was extinguished and the lever was retracted. Each SA session was preceded and followed by a 60 min period during which no session events occurred. For the sucrose group, sucrose SA sessions were conducted in an identical manner to the nicotine SA sessions, except for the following: (1) each reinforced lever press was followed by delivery of sucrose solution into a drinking well (i.e., 0.2 ml of 32% sucrose over 10 s), instead of an intravenous nicotine infusion, and (2) the number of sucrose infusions was matched to the daily number of nicotine infusions earned by the nicotine group.
Progressive-ratio sessions.
Behavioral responding was examined in two progressive-ratio self-administration sessions. In these sessions, the FR response requirement for reinforcement was increased according to the following sequence: 1, 2, 4, 6, 9, 12, 15, 20, 25, 32, etc. (Richardson and Roberts, 1996). The progressive-ratio sessions lasted for either a maximum of 6 h or until 1 h elapsed without a reinforcer delivery. The last ratio completed during the session was defined as the breaking point.
Training and SA history.
After 1 week of recovery from surgery, animals were exposed to three daily habituation sessions. In each session, animals were placed in the chamber for 4 h and connected via a cable to the fluid/electronic swivel. Thereafter, animals were trained to self-administer nicotine (n = 10) under a FR1 schedule of reinforcement in daily 2 h sessions for 23 d. After day 23 of the initial SA stage, animals were exposed first to 1 additional day of FR1 SA training, and then on the next day to one progressive-ratio session (i.e., on day 25 of SA). Then, animals underwent a 1 month abstinence period during which drug access was interrupted and animals remained in their home cages. After the abstinence period, animals were reexposed to daily nicotine SA sessions for 7 d. Thereafter, animals were exposed first to one additional FR1 SA training session and then to a progressive-ratio session. The sucrose animals (n = 8) were similarly treated.
Recording sessions
Electrophysiological recordings were conducted during the last habituation day and during the 3rd and 23rd days of the initial SA stage. Additional recordings were conducted on the first, third, and seventh days of reexposure. The experimental events of recording sessions conducted on SA training days were the same as those during all other SA training days.
Analysis of firing rates and firing patterns
Normalization of firing rate data.
A preliminary analysis of firing rates showed that they were skewed. Therefore, for all between-group and between-session comparisons, firing rates were normalized using the transformation of log10(x + 1) to reduce the skew of the firing-rate distribution, and thereby allow for parametric ANOVA statistics. All average values are reported as mean ± SEM.
Phasic increase in firing time-locked to the reinforced lever press.
Each neuron was tested for a short-duration phasic increase in firing time-locked to the reinforced lever press. These firing patterns were identified using lever presses that occurred during the maintenance phase of the SA session, when response rates were stable (i.e., last 15 presses). Across these 15 trials, the average firing rate during the 1 s prepress was compared with the average firing rate during a baseline period (i.e., −12 to −9 s before the lever press) using a Wilcoxon test. A comparable comparison was made between the 1 s postpress and the −12 to −9 s prepress. A phasic increase in firing time-locked to the reinforced lever press was defined as a significant increase in the 1 s prepress, the 1 s postpress, or both. Preliminary analyses of between-session changes in phasic activity showed that those changes were comparable for the various types of phasic-increase firing patterns (data not shown). The neurons were therefore treated as a single group in all analyses described in Results.
Prevalence and magnitude of phasic firing patterns.
For each animal and recording session, we determined the percentage of recorded neurons that exhibited a phasic-increase firing pattern time-locked to the reinforced operant response, and averaged those numbers to calculate the mean percentage of phasic-increase firing patterns per animal. The magnitude of the firing pattern was calculated using the following ratio: |A − B|/(A + B). The variable A equaled the average firing rate (i.e., hertz per 0.1 s bin) during the 1 s prepress, the 1 s postpress, or the 1 s prepress and postpress, depending on whether neurons exhibited, respectively, an exclusively prepress, an exclusively postpress, or a combined prepress and postpress firing pattern time-locked to the reinforced press. The variable B equaled the average firing rate (i.e., hertz per 0.1 s bin) during the −12 to −9 s prepress. Changes in prevalence and magnitude of phasic firing patterns were assessed using ANOVA. In these and other ANOVA, “recording day” and “session phase” were treated as repeated measures.
Histology and core versus shell comparisons
Histological procedures were used to identify the location of all wire tips used to record neurons. Under anesthesia, anodal current (50 μA for 5 s) was passed through each microwire. Animals were then perfused with 4% paraformaldehyde in 0.9% saline. The brains were cut into 50 μm coronal sections, which were mounted on slides and incubated in a solution of 5% potassium ferricyanide and 10% hydrochloric acid to stain the iron deposits left by the recording tips. The tissue was counterstained with 0.2% solution of neutral red. The location of each wire tip was plotted on the coronal plate that most closely corresponded to its anterior–posterior position. Only those neurons that were located within the boundaries of the NAc were included in analyses (Fig. 1).
Figure 1.

Locations of all recorded neurons in the nicotine and sucrose groups. A, B, Locations of all recorded NAc neurons are presented on coronal sections for the nicotine (A) and the sucrose (B) groups. The numbers indicate millimeters anterior to bregma.
To test for an effect of NAc subterritory, the location of each neuron was assessed relative to the core–shell boundaries defined by Paxinos and Watson (2004). All neurons identified as core and shell neurons were a minimum of 0.5 mm from the core–shell border. A preliminary ANOVA analysis showed that the prevalence of core and shell neurons was comparable between the sucrose and nicotine groups and stable across the successive recording sessions (supplemental Fig. 2, available at www.jneurosci.org as supplemental material).
Results
Nicotine group
Nicotine intake during daily SA training sessions
Nicotine intake progressively increased during the initial SA stage from 15.1 ± 1.4 infusions to 32.5 ± 1.5 infusions (i.e., day 1 vs day 23) but remained stable thereafter (Fig. 2 A). A one-way ANOVA with day (i.e., 3rd and 23rd days of initial SA and 1st, 3rd, and 7th days of reexposure) as a factor showed a significant effect of day on nicotine intake (F (29,261) = 8.14; p < 0.001). Post hoc comparisons showed that the daily rate of nicotine infusion started to increase significantly relative to the 1st SA session by the 7th session (p < 0.05) and continued to increase until the 12th session. Thereafter, daily nicotine intake remained stable (NS; session 12 compared with session 23). Moreover, nicotine intake during reexposure was not significantly different from that on the last day of initial nicotine SA (NS; sessions 1–7 of reexposure compared with session 23 of initial nicotine SA).
Figure 2.
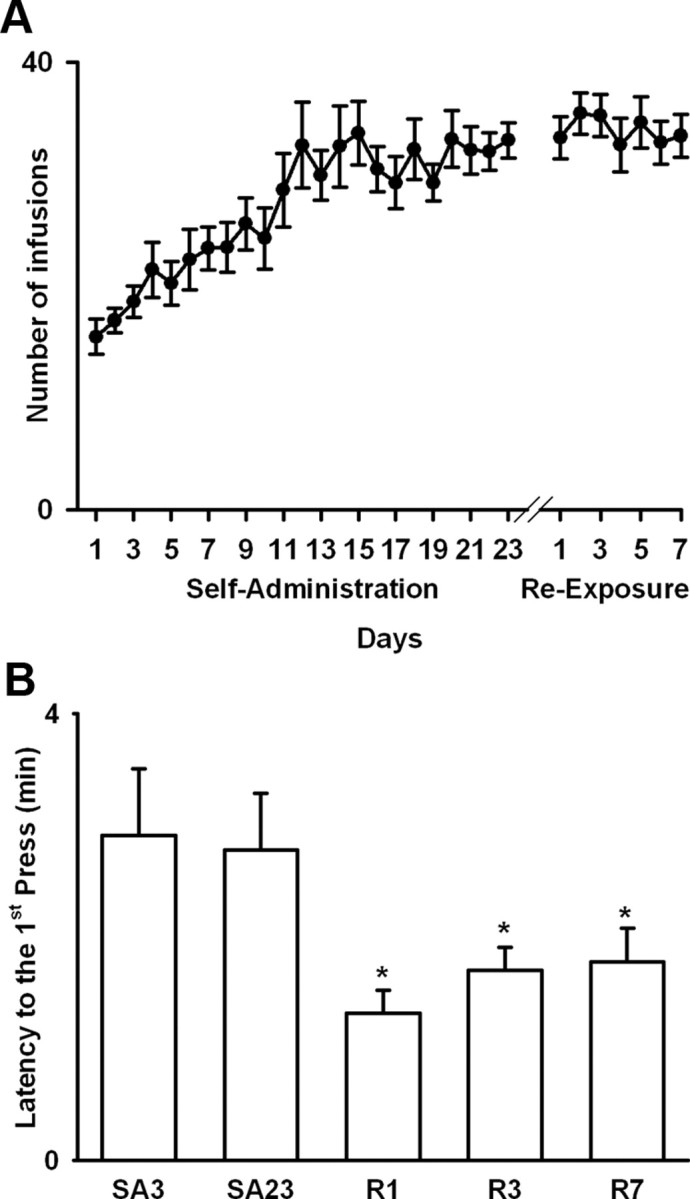
Total nicotine intake and latency to first press during nicotine SA sessions. A, Average nicotine intake (i.e., total number of infusions per session) during initial nicotine SA and reexposure is plotted as a function of SA training day (i.e., days 1–23 of initial SA and days 1–7 of reexposure, respectively). B, Average latency to first press is plotted as a function of recording day (i.e., Hab, habituation; SA3 and SA23, days 3 and 23 of initial SA stage; R1, R3, and R7, days 1, 3, and 7 of reexposure). The asterisk (*) denotes a significant difference (p < 0.05) relative to the 3rd and the 23rd days of initial SA. Error bars indicate SEM.
Incentive to engage in nicotine-directed behavior
Substantial evidence suggests that abstinence from drugs of abuse leads to an increase in drug-directed behavior (Tran-Nguyen et al., 1998; Grimm et al., 2001; Di Ciano and Everitt, 2002; George et al., 2007; O'Dell and Koob, 2007). We tested for a similar pattern of behavior with between-day comparisons of the following two measures: (1) latency to the first nicotine self-infusion during each of the recorded SA sessions, and (2) breaking point for nicotine self-administration, which was determined in two progressive-ratio sessions. The first progressive-ratio session was conducted after the 23rd day of initial SA and before the onset of the abstinence stage (i.e., on day 25 of SA). The second was conducted after the 7th day of reexposure (i.e., on the 9th day of reexposure).
A one-way ANOVA with day (i.e., 3rd and 23rd days of initial SA and 1st, 3rd, and 7th days of reexposure) as a factor showed that there was a significant between-session decrease in the average latency to the first nicotine self-infusion (F (4,36) = 3.32; p < 0.05). Post hoc comparisons showed that the latency to the first infusion was significantly lower during each of the nicotine reexposure sessions relative to the 3rd and 23rd days of the initial nicotine SA stage (Fig. 2 B). Furthermore, a one-way ANOVA showed that the average breaking point increased between the preabstinence progressive-ratio session (i.e., 15.3 ± 2.43 presses) and the post-reexposure progressive-ratio session (i.e., 45.2 ± 6.99 presses) (F (1,9) = 19.85; p < 0.01).
Stage-specific and activity-dependent plasticity in NAc neuronal activity in animals exposed to nicotine SA
Stage-specific changes in phasic-increase firing patterns time-locked to the nicotine-reinforced lever press
Each neuron was tested for a short-duration phasic increase in firing rate time-locked to the reinforced lever press. On day 3 of initial nicotine SA, 19.5% (17 of 87) of the NAc neurons exhibited a significant phasic increase in firing rate time-locked to the nicotine-reinforced lever press (Fig. 3 A–C). We compared the percentage and the magnitude of the phasic firing patterns across initial nicotine SA, abstinence, and reexposure (Fig. 4 A,B). One-way ANOVAs showed that there was a significant effect of day on both the percentage (F (4,45) = 3.23; p < 0.05) and the magnitude of the phasic-increase firing patterns (F (4,82) = 4.01; p < 0.01). Post hoc comparisons revealed that there was no significant change in either the incidence or the amplitude of the phasic increase firing patterns time-locked to the reinforced press between the 3rd and the 23rd days of initial nicotine SA. However, the amplitude and the incidence of the firing patterns were significantly increased (≥140%) during each of the three reexposure recording sessions, relative to the 3rd and 23rd days of initial nicotine SA (p < 0.05).
Figure 3.

Examples of individual neuron firing patterns time-locked to the nicotine-reinforced lever press. A–C, Each perievent histogram shows the average firing rate (i.e., average hertz per 0.1 s bin) of a single neuron plotted as a function of time (in seconds) before and after the nicotine-reinforced lever press (i.e., 12 s prepress and 12 s postpress). From left to right are shown a prepress firing pattern (A), a postpress firing pattern (B), and a combined prepress and postpress firing pattern (C). D, Average firing rate (i.e., average hertz per 0.1 s bin) of a single task-nonactivated neuron during the 12 s before and the 12 s after the nicotine-reinforced lever press. Above each histogram is shown a trial by trial raster display of firing plotted during the 12 s before and after the nicotine-reinforced lever press. Individual ticks represent a single discharge of the neuron. Time 0 on the abscissa corresponds to completion of the reinforced lever press.
Figure 4.

Stage-dependent and activity-dependent changes in NAc firing across the initial nicotine SA, abstinence, and reexposure stages. A, Average percentage of recorded neurons (i.e., per animal) that exhibited a phasic-increase firing pattern time-locked to the nicotine-reinforced lever press (i.e., prevalence percentage) is plotted as a function of recording day (i.e., SA3 and SA23 of initial SA session; and R1, R3, and R7 of reexposure). B, Average magnitude of the phasic-increase firing pattern time-locked to the nicotine-reinforced lever press is plotted as a function of recording day (i.e., SA3 and SA23 of initial SA; and R1, R3, and R7 of reexposure). The calculation of magnitude is described in Materials and Methods. In both A and B, the asterisk (*) denotes a significant difference, relative to the 3rd and the 23rd days of SA (p < 0.05). C, D, Average baseline (C) and SA (D) firing rates [i.e., average log10(x + 1), abbreviated log Hz] are plotted as a function of recording day (i.e., Hab, SA3, and SA23 of initial SA; and R1, R3, and R7 of reexposure). C, The single (*) and double (**) asterisks denote a significant difference relative to habituation day with p < 0.05 and p < 0.01, respectively. D, Asterisk (*) denotes a significant difference relative to SA3. E, F, Average baseline and SA firing rates [i.e., average log10(x + 1), abbreviated as log Hz] of task-activated (E) and task-nonactivated neurons (F) are plotted as a function of day (i.e., SA3 and SA23 of initial SA; R1, R3, and R7 of reexposure). The asterisk (*) denotes a significant difference relative to SA3 (p < 0.05). Error bars indicate SEM.
A stage-specific decrease in average baseline and SA firing rates
For all recorded neurons combined, between-session comparisons were made of average firing rate during the 60 min presession baseline period (i.e., referred to as baseline firing rate) (Fig. 4 C). Between-session comparisons were also made of the average firing rate during the SA session (i.e., referred to as SA firing rate) (Fig. 4 D). A two-way ANOVA with recording day (i.e., habituation, 3rd and 23rd days of SA and 1st, 3rd, and 7th days of reexposure) and session phase (i.e., baseline vs SA) as factors showed a significant effect of recording day (F (5,461) = 6.79; p < 0.001), a significant effect of session phase (F (1,461) = 22.24; p < 0.001), and a significant interaction between recording day and session phase (F (5,461) = 2.96; p < 0.05).
A number of post hoc comparisons were conducted to further characterize the between-session changes in average firing. Comparisons between baseline and SA firing rates showed that average SA firing rate was significantly lower than average baseline firing rate on several days, including the 3rd (p < 0.01) and 23rd (p < 0.001) days of initial SA, and the 7th day of reexposure (p < 0.01). Between-session comparisons showed that the average baseline firing rate decreased significantly between the habituation day and the 23rd day of nicotine SA (p < 0.05). After 30 d of abstinence (i.e., on day 1 of reexposure), average baseline firing rate returned to that observed in drug-naive animals (i.e., did not differ significantly from average baseline firing rate observed during the habituation recording session). Hypoactivity reemerged during reexposure: by the 3rd day of reexposure, average baseline firing significantly decreased relative to the 1st day of reexposure (p < 0.05), and equaled the average firing rate on the 23rd day of initial nicotine SA. Changes in average SA firing rate followed the changes in average baseline firing rate (Fig. 4 D).
An activity-dependent decrease in average baseline and SA firing rates
Different between-session changes in the average firing rates of two subsets of neurons.
In a previous cocaine SA study (Peoples et al., 2007), we found that NAc neurons underwent different between-session changes in average baseline and SA firing rates, depending on whether the neurons showed a phasic increase in firing rate time-locked to the cocaine-reinforced lever press during daily SA sessions. Specifically, neurons that showed a phasic increase in firing time-locked to the cocaine-reinforced lever press during daily SA sessions, as a group showed no between-session change in either average baseline or SA firing rate across a 30 d period of cocaine SA. However, neurons that did not show a phasic change in firing rate time-locked to the cocaine-reinforced lever press, as a group showed a significant decrease in average baseline and SA firing rates across the same 30 d period of cocaine self-administration. In the present study, we investigated whether neurons showed a similar “activity-dependent” effect across the stages of initial SA, abstinence, and reexposure.
Neurons in the nicotine group were sorted into two categories: (1) neurons that showed a phasic increase in firing time-locked to the nicotine-reinforced lever press (i.e., referred to as task-activated neurons) (Figs. 3 A–C; 5, top row) and (2) neurons that did not show a phasic change in firing rate time-locked to the nicotine-reinforced lever press (i.e., referred to as task-nonactivated neurons) (Figs. 3 D; 5, bottom row). A between-session comparison was made of the average baseline and SA firing rates of these two groups of neurons (Fig. 4 E,F). A three-way ANOVA with activation (i.e., task-activated vs task-nonactivated), day (i.e., 3rd and 23rd days of SA and 1st, 3rd, and 7th days of reexposure) and session phase (i.e., baseline vs SA) as factors showed that there was a significant effect of activation (F (1,311) = 4.34; p < 0.05), as well as a significant interaction among activation, recording day, and session phase (F (4,311) = 4.12; p < 0.05). These findings show that task-activated and task-nonactivated neurons underwent different between-session changes in average firing rates.
Figure 5.

Average firing patterns time-locked to the nicotine-reinforced lever press: task-activated versus task-nonactivated neurons. Top row, The average firing pattern of task-activated neurons time-locked to the nicotine-reinforced lever press is shown for each SA recording day (i.e., SA3 and SA23 of initial SA; R1, R3, and R7 of reexposure). In each perievent histogram, average firing rate (i.e., hertz per 0.1 s bin) is plotted as a function of time before and after the nicotine-reinforced lever press (i.e., 12 s prepress and 12 s postpress). Bottom row, The average firing pattern of all task-nonactivated neurons time-locked to the nicotine-reinforced lever press is shown for each SA recording day (i.e., SA3 and SA23 of initial SA; and R1, R3, and R7 of reexposure). In each perievent histogram, average firing rate (i.e., hertz per 0.1 s bin) is plotted as a function of time before and after the nicotine-reinforced lever press (i.e., the 12 s prepress and postpress).
Additional analyses were conducted to characterize the different changes in average firing of the task-activated and task-nonactivated neurons. A two-way ANOVA applied to the task-activated neurons showed no effect of recording day (F (4,72) = 0.78; NS) and no interaction between recording day and session phase (F (4,72) = 1.28; NS), indicating that the average firing of the task-activated neurons did not show any between-session change in average baseline or SA firing rate (Figs. 4 E; 5, top row). In contrast, a two-way ANOVA applied to the task-nonactivated neurons showed a significant effect of day (F (4,239) = 3.95; p < 0.01), and no significant interaction between recording day and session phase (F (4,239) = 1.23; NS) (Fig. 4 F), indicating a significant change in the baseline and SA average firing rates of the task-nonactivated neurons (Figs. 4 F; 5, bottom row). Additional between-day comparisons showed that the average baseline and SA firing rates of the task-nonactivated neurons decreased significantly between the 3rd and the 23rd days of initial SA. On the 1st day of reexposure average baseline and SA firing rates had returned to those observed during the habituation session and the 3rd session of the initial SA stage, respectively. Hypoactivity reemerged during the subsequent reexposure sessions: average firing rates decreased significantly on the 7th day of reexposure relative to both the 3rd day of initial SA and the 1st day of reexposure (p < 0.05). An additional analysis of firing exhibited by the task-nonactivated neurons showed that the between-session decreases in the average firing rates of the task-nonactivated neurons were associated with parallel decreases in burst firing (supplemental Fig. 3, available at www.jneurosci.org as supplemental material).
The between-session changes in the average firing rates of the task-nonactivated neurons were not attributable to between-session changes in behavior.
One interpretation of the between-session decreases in the average firing rates of task-nonactivated neurons is that repeated drug exposure altered the frequency of a particular behavior, which in turn led to a change in afferent input to the recorded neurons and a corresponding decrease in the average firing rate of the neurons (i.e., the decrease in firing rate potentially reflects behavioral feedback). The baseline and SA phases are behaviorally distinct. For example, animals engage in locomotion frequently during the SA session and rarely during the baseline phase (experimenter observation). Animals also engage in operant behavior during the SA phase but not during the baseline phase. The comparable between-session changes in baseline and SA firing rates, despite the between-phase differences in behavior, is inconsistent with a primary causal role of behavioral feedback in the firing-rate changes. Nevertheless, we conducted an additional analysis to more directly test the interpretation.
In the analysis, the calculation of average SA firing rate during each SA session was limited to periods in which animals engaged in a particular behavior (e.g., locomotion away from the response lever). Calculating firing rate in this way removed the contribution of a between-session change in behavioral feedback to the between-session comparison of average SA firing rate (Rank et al., 1983). The control analysis replicated the original finding of a significant between-session decrease in the average SA firing rate of the task-nonactivated neurons, supporting the interpretation that the between-session decreases in the firing rates of task-nonactivated neurons do not simply reflect changes in behavioral feedback to the neurons (supplemental Fig. 4, available at www.jneurosci.org as supplemental material).
A persistent and progressive net increase in NAc firing time-locked to nicotine-directed operant behavior
Based on the observed changes in phasic-firing patterns and average firing rates, it appears that NAc neuronal activity associated with nicotine-directed behavior undergoes a persistent and progressive net increase across initial nicotine SA, abstinence, and reexposure. That is the ratio between average firing at the time of the reinforced press (referred to as signal) and average firing during other “background” periods increases progressively across the successive stages of initial SA, abstinence, and reexposure. A population analysis of average signal:background for all recorded NAc neurons was consistent with this interpretation.
To conduct the population analysis, we first calculated, for each neuron, the average firing rate for each of the following: (1) the 60 min presession baseline period (i.e., background period); (2) the 1 s prepress; and (3) the 1 s postpress. For each neuron, the signal period was defined as follows: (1) the 1 s prepress and postpress, if firing during the two periods did not differ significantly; (2) the 1 s prepress, if firing during that period was significantly greater than firing during the 1 s postpress; and (3) the 1 s postpress, if firing during the postpress period was greater than that during the 1 s prepress. The average firing rates during the background and signal periods were defined as the background and signal firing rates, respectively (Fig. 6 A).
Figure 6.

A persistent and progressive net increase in NAc firing time-locked to the nicotine-reinforced lever press. A, Average signal and background firing rates [i.e., average log10(x + 1), abbreviated log Hz] of all recorded neurons (i.e., all task-activated and all task-nonactivated neurons combined) in the nicotine group are plotted as a function of recording day (i.e., SA3 and SA23 of initial SA; and R1, R3, and R7 of reexposure). The signal firing rate is the average peak firing rate time-locked to the nicotine-reinforced press (see Results). The background firing rate is average firing rate during the 60 min baseline period. B, The average signal:background ratio is plotted as a function of recording day (i.e., SA3 and SA23 of initial SA; R1, R3, and R7 of reexposure). The single, double, and triple asterisks denote a significant difference relative to the third day of initial SA with p < 0.05, p < 0.01, and p < 0.001, respectively. The symbol + denotes a significant difference relative to the 23rd day of initial SA (p < 0.05). Error bars indicate SEM. C, Average baseline and SA firing rates (i.e., average hertz per 0.1 s bin for all recorded neurons combined) are plotted as a function of recording day (i.e., SA3 and SA23 of initial SA, and R1, R3, and R7 of reexposure). For each recording day, two average perievent histograms are shown: one displays average firing rate (i.e., average hertz per 0.1 s bin) during the 60 min baseline period (left histogram of the pair), and the other displays average firing rate (i.e., average hertz per 0.1 s bin) during the 12 s before and after the nicotine-reinforced lever press (right histogram of the pair).
A one-way ANOVA with recording day (i.e., 3rd and 23rd days of SA and 1st, 3rd, and 7th days of reexposure) as a factor showed that there was a significant effect of recording day on the signal:background ratio (F (4,342) = 4.99; p < 0.001). Post hoc analyses showed that the signal:background ratio was significantly increased on all days relative to the third day of initial nicotine SA (i.e., SA3 vs SA23, p < 0.05; vs R1 p < 0.01; vs R3, p < 0.001; vs R7, p < 0.001). It was also greater on the 7th day of reexposure relative to the 23rd day of nicotine SA (p < 0.05) (Fig. 6 B,C). Together, these results demonstrate that, at a population level, average firing rate of NAc neurons time-locked to nicotine-reinforced behavior underwent a progressive and persistent net increase relative to firing during the drug-free, presession baseline phase. Comparable findings were obtained when the analyses were repeated with the background firing rate defined as average firing during the −12 to −9 s prepress (supplemental Fig. 5A,B, available at www.jneurosci.org as supplemental material).
No difference in the between-session plasticity exhibited by neurons located in the core versus the shell of the NAc
Phasic firing patterns time-locked to the nicotine-reinforced lever press.
There was a trend for core neurons to exhibit a greater increase in the magnitude of phasic activity across recording days (e.g., reexposure vs initial SA) compared with shell neurons (supplemental Fig. 6, available at www.jneurosci.org as supplemental material). However, the trends did not reach statistical significance. Several two-way ANOVA analyses with day (i.e., 3rd and 23rd days of SA; 1st, 3rd, and 7th days of reexposure) and subterritory (core vs shell) as factors were used to test for an effect of subterritory on phasic-increase firing patterns time-locked to the nicotine-reinforced press. These analyses showed that the average magnitude of the phasic-increase firing pattern was greater in the core than in the shell. There was no significant effect of subterritory on prevalence of the phasic-increase firing patterns. Moreover, there was no significant effect of subterritory on between-session changes in either the prevalence or the magnitude of the phasic firing patterns. Subterritory also did not significantly affect the prevalence of task-nonactivated neurons (supplemental Fig. 6, available at www.jneurosci.org as supplemental material).
Average baseline and SA firing rates.
A three-way ANOVA analysis with day, session phase, and subterritory as factors was used to test for an effect of subterritory on average presession baseline and SA session firing rates. For all neurons combined, there was no significant effect of subterritory on average baseline and session firing rates and no significant effect of subterritory on the between-session changes in average baseline and SA firing rates (supplemental Fig. 7A,B, available at www.jneurosci.org as supplemental material). There was a trend for the decrease in average baseline and SA firing rates of task-nonactivated neurons to be greater for shell neurons than for core neurons (supplemental Fig. 7E,F, available at www.jneurosci.org as supplemental material). However, ANOVA analyses showed that there were no significant effects of subterritory on the average firing rates of either task-activated (supplemental Fig. 7C,D, available at www.jneurosci.org as supplemental material) or task-nonactivated neurons.
Sucrose control group
Behavior
Sucrose animals were matched to the nicotine animals for number of reinforcers per day so that the between-session pattern of total reinforcers per day for the sucrose group was necessarily the same as it was for the nicotine group. However, the latency to first press and the breaking point were determined by the subjects, so it was possible to use those measures to test for between-session changes in the motivation of animals to self-administer sucrose. ANOVA analyses showed that the rats in the sucrose group exhibited no change in the average latency to the first sucrose-reinforced press (F (4,28) = 1.58; NS) (Fig. 7), and no change in the average sucrose breaking point between the preabstinence progressive-ratio session (92.1 ± 6.98) and the postabstinence progressive-ratio session (96.3 ± 5.50) (F (1,7) = 2.31; NS).
Figure 7.

No significant between-session change in latency to the first sucrose-reinforced lever press. Average latency to the first sucrose-reinforced lever press is plotted as a function of recording day (i.e., SA3 and SA23 of initial SA, and R1, R3, and R7 of reexposure). Error bars indicate SEM.
No changes in either phasic-increase firing patterns time-locked to the sucrose-reinforced lever press or average baseline and SA firing rates
Separate one-way ANOVAs, which included recording day (i.e., 3rd and 23rd days of initial SA and 1st, 3rd, and 7th day of reexposure) as a factor, showed that there was no significant effect of day on either the prevalence (F (4,35) = 0.33; NS) or the magnitude (F (4,24) = 0.01; NS) of phasic-increase firing patterns time-locked to the sucrose-reinforced lever press (Fig. 8 A,B). Moreover, a two-way ANOVA analysis of average baseline and SA firing rates with recording day (i.e., habituation, 3rd and 23rd days of initial SA and 1st, 3rd, and 7th day of reexposure) and session phase (i.e., baseline vs SA) as factors showed that there was no significant effect of either day (F (5,386) = 0.15; NS) or session phase (F (1,386) = 0.08; NS). There was also no significant interaction between recording day and session phase (F (5,386) = 0.44; NS) (Fig. 8 C,D). Additionally, a three-way ANOVA analysis of average baseline and SA firing rates with activation (i.e., task-activated vs task-nonactivated), recording day (i.e., 3rd and 23rd days of initial SA and 1st, 3rd, and 7th day of reexposure), and session phase (i.e., baseline vs SA) as factors showed that there was no significant effect of activation (F (1,207) = 0.11; NS), and no significant interaction between day and session phase (F (4,207) = 0.85; NS). Thus, in the sucrose group, neither the task-activated nor the task-nonactivated neurons showed significant between-session changes in average baseline and SA firing rates (Fig. 8 E,F).
Figure 8.

No significant between-session changes in phasic firing patterns and average firing rates in the sucrose group. A, Average percentage of neurons (i.e., per animal) exhibiting a phasic-increase firing pattern time-locked to the sucrose-reinforced lever press (i.e., prevalence percentage) is plotted as a function of recording day (i.e., SA3 and SA23 of initial SA, and R1, R3, and R7 of reexposure). B, Average magnitude of the phasic-increase firing pattern time-locked to the sucrose-reinforced lever press is plotted as a function of recording day (i.e., SA3 and SA23 of initial SA, and R1, R3, and R7 of reexposure). The calculation of magnitude is described in Materials and Methods. C, D, Average baseline (C) and SA (D) firing rates [i.e., average log10(x + 1), abbreviated log Hz] are plotted as a function of recording day (i.e., Hab; SA3 and SA23 of initial SA; and R1, R3, and R7 of reexposure). E, F, Average baseline and SA firing rates [i.e., average log10(x + 1), abbreviated log Hz] of task-activated (E) and task-nonactivated neurons (F) are plotted as a function of day (i.e., SA3 and SA23 of initial SA, and R1, R3, and R7 of reexposure). Error bars indicate SEM.
A population analysis of signal and background firing rates was conducted for the sucrose group. Signal and background firing rates were determined as described for the nicotine group (Fig. 9 A,C). When background was defined as firing during the 60 min baseline period, there was no significant effect of recording day (F (4,316) = 0.83; NS) on the signal:background ratio (Fig. 9 B). Similar results were obtained when background firing rate was defined as firing during the −12 to −9 s prepress (Fig. 9 C; supplemental Fig. 5C,D, available at www.jneurosci.org as supplemental material).
Figure 9.

No significant net increase in firing time-locked to the sucrose-reinforced lever press. A, Average signal and background (i.e., presession baseline) firing rates [i.e., average log10(x + 1)] of all recorded neurons are plotted as a function of recording day (i.e., SA3 and SA23 of initial SA, and R1, R3, and R7 of reexposure). B, Average signal:background ratio is plotted as a function of recording day (i.e., SA3 and SA23 of initial SA, and R1, R3, and R7 of reexposure). C, Average baseline and SA firing rates (i.e., hertz per 0.1 s bin) of all recorded neurons are plotted as a function of recording day (i.e., SA3 and SA23 of initial SA, and R1, R3, and R7 of reexposure). For each recording day, two average perievent histograms are shown: one displays average firing rate (i.e., average hertz per 0.1 s bin) during the 60 min presession baseline period (left histogram of the pair), and the other displays average firing rate (i.e., hertz per 0.1 s bin) during the 12 s before and after the sucrose-reinforced lever press. Error bars indicate SEM.
No difference in the between-session plasticity exhibited by neurons located in the core versus the shell
The subterritorial analyses applied to the nicotine group were also conducted for the sucrose group. None of the analyses revealed a significant difference between the core and shell (supplemental material, available at www.jneurosci.org).
Discussion
Major findings: stage-specific and activity-dependent nicotine-induced changes in NAc neural activity
The present study shows that NAc neurons exhibit stage-specific and activity-dependent plasticity across periods of initial nicotine SA, extended abstinence, and reexposure. This plasticity consists of two predominant patterns. First, phasic firing patterns time-locked to the nicotine-reinforced lever press show no change during initial drug taking but then show increases in prevalence and magnitude during abstinence, which persist during reexposure. Second, average baseline and SA firing rates of task-nonactivated neurons decrease during an initial period of daily nicotine exposure, return to normal during extended abstinence, and decrease again during reexposure, whereas average firing rates of task-activated neurons remain stable. The decreases in the average firing rates of task-nonactivated neurons and the increase in prevalence and amplitude of phasic-increase firing patterns are exhibited by both shell and core neurons. At a population level, the net effect of the two patterns of plasticity is to progressively and persistently increase the net strength of average firing associated with nicotine-directed behavior. These changes in neural activity are associated with an increase in the motivation of animals to engage in nicotine-directed behavior. The behavioral and neural changes observed in the nicotine group do not generalize to animals exposed to sucrose SA, abstinence, and reexposure.
Interpretations of the present findings and comparisons with other investigations
The effects of nicotine SA and abstinence on phasic firing patterns and the average firing rates of NAc neurons are strikingly similar to previously reported effects of cocaine SA and abstinence on phasic and average firing (Peoples et al., 1999, 2007a; Hollander and Carelli, 2005). The effects of cocaine reexposure have not yet been characterized. Nicotine and cocaine have different sites and mechanisms of action (Koob and Le Moal, 2001; Nestler, 2005; Ikemoto et al., 2006). However, both drugs share with other addictive drugs certain acute and chronic neurochemical and sub-cellular NAc effects (Di Chiara and Imperato, 1988; Balfour, 2002; McClung et al., 2004). It is possible that the changes in firing associated with nicotine and cocaine SA and abstinence will generalize to other drugs.
The sucrose reward concentration used in the present study (i.e., 32%) is the maximally reinforcing concentration in rats (Reilly, 1999). Additionally, the sucrose reward was more reinforcing than nicotine in the present study, as indicated by the latency-to-first-press and breaking-point measures. Based on these observations, one might hypothesize that the stable neuronal activity in the sucrose group reflects the high reinforcing efficacy of the sucrose reward and a potentially related “ceiling effect” on NAc neurophysiological plasticity. However, a number of observations argue against this interpretation. First, the prevalence and magnitude of the phasic firing patterns and the average baseline firing rates of the nicotine and sucrose groups were quite similar on the first recording day, suggesting that there was a potential for the phasic firing patterns and average firing rates of the two groups to undergo similar plasticity. Second, a previous study which used a 10% sucrose solution as a reinforcer also failed to observe changes in behavior and NAc neural activity (Jones et al., 2008). Third, cocaine is considered more reinforcing than nicotine, and yet exposure to cocaine and nicotine SA are associated with comparable changes in phasic firing patterns and average firing rates. These observations argue against the reinforcer efficacy and ceiling effect interpretation. The similar changes in NAc phasic firing patterns and average firing rates in animals exposed to cocaine and nicotine (Hollander and Carelli, 2005; Peoples et al., 2007a,b; present study), combined with the absence of those findings in sucrose-exposed animals (Jones et al., 2008; present study) supports the interpretation that the plasticity in the drug-exposed animals is attributable to chronic pharmacological effects.
Investigators have hypothesized that certain patterns of exposure to highly palatable foods induce neuroadaptations, which are similar to those induced by addictive drugs. Moreover, the shared neuronal plasticity contributes to compulsive intake of both drug and food rewards (Rada et al., 2005; Volkow et al., 2008). The similar neurophysiological plasticity in the NAc after nicotine and cocaine SA and the absence of that plasticity in sucrose SA (Hollander and Carelli, 2005, 2007; Peoples et al., 2007a; Jones et al., 2008; present study) is suggestive of important differences in the NAc neural plasticity induced by repeated exposure to addictive drugs versus sucrose. Additional studies are required to fully investigate this possibility.
In previous cocaine studies, the abstinence-induced increase in phasic activity was significantly greater in the core than in the shell. Conversely, the decrease in average firing of task-nonactivated neurons was significantly greater in the shell than in the core (Hollander and Carelli, 2007; Peoples et al., 2007a). Although there were similar trends in the present nicotine study, there were no significant interactions between subterritory and effect of initial SA, abstinence, and reexposure on phasic and average firing. The different findings between the cocaine and nicotine studies could reflect an effect of drug, or an effect of other experimental and analytical differences. However, it is noteworthy that neurons in the present study were more concentrated in the anterior NAc relative to neurons recorded in the cocaine studies. It is possible that the between-study differences in core versus shell effects correspond to differences in medial–lateral heterogeneity along the anterior–posterior axis of the NAc (Zahm and Brog, 1992).
Relationship between increases in signal:background and the strength of drug-directed behavior
Animal and human studies show that the NAc contributes to directing and invigorating goal-directed behavior, including drug-directed behavior (Kelley and Stinus, 1985; Blackburn et al., 1987; Pfaus and Phillips, 1991; Salamone et al., 1994; Robbins and Everitt, 2007). Drug-induced adaptations within the NAc are hypothesized to contribute to compulsive drug-directed behavior, which characterizes drug addiction. The contribution of the NAc to the occurrence or strength of a particular behavior relative to other behaviors is hypothesized to reflect the relative activation of particular ensembles of neurons associated with the behaviors (Pennartz et al., 1994). Based on this current understanding of NAc contributions to goal-directed behavior, the two types of NAc neurophysiological plasticity observed in the present study and the net increase in firing time-locked to the nicotine-reinforced press (i.e., the increase in signal:background ratio for the nicotine-reinforced press) might be expected to increase the propensity of animals to engage in nicotine-directed behavior.
In the present experiment, nicotine intake did not escalate; however, under continuous limited-access conditions, nicotine SA generally does not show increments postacquisition, perhaps because of aversive effects of high levels of nicotine (Paterson and Markou, 2004; Kenny and Markou, 2006; George et al., 2007). Nevertheless, the latency-to-first-press and breaking-point measures showed evidence of increased motivation to seek nicotine during the reexposure phase relative to preabstinence nicotine SA sessions. Additionally, previous cocaine studies showed that the decrease in average firing of task-nonactivated neurons and the postabstinence increase in phasic activity are both associated with a concomitant strengthening of cocaine-directed behavior (Hollander and Carelli, 2005, 2007; Peoples et al., 2007a). Based on these observations, additional investigation of the relationship between drug-directed behavior and NAc signal:background for drug-directed behavior is warranted.
Plasticity in NAc neural activity: possible mediating mechanisms
The mechanisms underlying the neurophysiological plasticity observed in the present study cannot be specified as of yet. However, repeated nicotine exposure induces a number of changes in neurotransmission, which could contribute to the adaptations in NAc neural activity. For example, nicotine exposure leads to lasting changes in glutamatergic neurotransmission (Mansvelder and McGehee, 2000; Mansvelder et al., 2002) and glutamatergic compounds have been shown to influence both nicotine reinforcement and reinstatement to nicotine-directed behavior (Kenny et al., 2003; Kenny and Markou, 2004; Bespalov et al., 2005; Liechti et al., 2007).
Acute effects of nicotine are also potentially relevant in understanding the NAc neurophysiological plasticity observed in the present experiment. For example, acute activation of nicotine receptors can influence intracellular Ca2+ stores in an activity-dependent manner (Dajas-Bailador and Wonnacott, 2004) and contribute to long-term potentiation (Mansvelder and McGehee, 2000; Saal et al., 2003) and long-term depression (Partridge et al., 2002). Nicotine causes several types of acute changes in neurotransmission, which could either induce or modulate NAc neuroadaptations. For example, in the NAc, acute nicotine increases the release of dopamine (Benwell and Balfour, 1992; Corrigall et al., 1992; Pontieri et al., 1996; Di Chiara, 2000; Lecca et al., 2006), which modulates long-term depression and long-term potentiation (Kauer and Malenka, 2007; Schotanus and Chergui, 2008). Acute nicotine effects could also contribute indirectly to activity-dependent plasticity by altering the firing rate of neurons (Pennartz et al., 1994; Peoples et al., 2004, 2007a,b).
Conclusions
The present study provides new insight into NAc neurophysiological plasticity induced by nicotine, particularly in relation to a history of nicotine SA, abstinence, and reexposure. Additional investigation of the NAc neurophysiological plasticity observed in the present study might elucidate mechanisms that contribute to the development of compulsive drug-directed behavior toward nicotine and other addictive drugs.
Footnotes
This work was supported by National Institute on Drug Abuse Grants DA05186 and DA026942, National Cancer Institute Grant 4100020574, and American Cancer Society Institutional Research Grant IRG-78-002-29. We thank Drs. Alexxai V. Kravitz, George F. Koob, Barry J. Everitt, and Serge H. Ahmed for helpful comments and suggestions on this manuscript.
References
- Balfour DJ. Neuroplasticity within the mesoaccumbens dopamine system and its role in tobacco dependence. Curr Drug Targets CNS Neurol Disord. 2002;1:413–421. doi: 10.2174/1568007023339076. [DOI] [PubMed] [Google Scholar]
- Benwell ME, Balfour DJ. The effects of acute and repeated nicotine treatment on nucleus accumbens dopamine and locomotor activity. Br J Pharmacol. 1992;105:849–856. doi: 10.1111/j.1476-5381.1992.tb09067.x. [DOI] [PMC free article] [PubMed] [Google Scholar]
- Bespalov AY, Dravolina OA, Sukhanov I, Zakharova E, Blokhina E, Zvartau E, Danysz W, van Heeke G, Markou A. Metabotropic glutamate receptor (mGluR5) antagonist MPEP attenuated cue- and schedule-induced reinstatement of nicotine self-administration behavior in rats. Neuropharmacology. 2005;49(Suppl 1):167–178. doi: 10.1016/j.neuropharm.2005.06.007. [DOI] [PubMed] [Google Scholar]
- Blackburn JR, Phillips AG, Fibiger HC. Dopamine and preparatory behavior: I. Effects of pimozide. Behav Neurosci. 1987;101:352–360. doi: 10.1037//0735-7044.101.3.352. [DOI] [PubMed] [Google Scholar]
- Brody AL, Olmstead RE, London ED, Farahi J, Meyer JH, Grossman P, Lee GS, Huang J, Hahn EL, Mandelkern MA. Smoking-induced ventral striatum dopamine release. Am J Psychiatry. 2004;161:1211–1218. doi: 10.1176/appi.ajp.161.7.1211. [DOI] [PubMed] [Google Scholar]
- Corrigall WA, Franklin KB, Coen KM, Clarke PB. The mesolimbic dopaminergic system is implicated in the reinforcing effects of nicotine. Psychopharmacology (Berl) 1992;107:285–289. doi: 10.1007/BF02245149. [DOI] [PubMed] [Google Scholar]
- Dajas-Bailador F, Wonnacott S. Nicotinic acetylcholine receptors and the regulation of neuronal signalling. Trends Pharmacol Sci. 2004;25:317–324. doi: 10.1016/j.tips.2004.04.006. [DOI] [PubMed] [Google Scholar]
- Di Chiara G. Role of dopamine in the behavioural actions of nicotine related to addiction. Eur J Pharmacol. 2000;393:295–314. doi: 10.1016/s0014-2999(00)00122-9. [DOI] [PubMed] [Google Scholar]
- Di Chiara G, Imperato A. Drugs abused by humans preferentially increase synaptic dopamine concentrations in the mesolimbic system of freely moving rats. Proc Natl Acad Sci U S A. 1988;85:5274–5278. doi: 10.1073/pnas.85.14.5274. [DOI] [PMC free article] [PubMed] [Google Scholar]
- Di Ciano P, Everitt BJ. Reinstatement and spontaneous recovery of cocaine-seeking following extinction and different durations of withdrawal. Behav Pharmacol. 2002;13:397–405. doi: 10.1097/00008877-200209000-00013. [DOI] [PubMed] [Google Scholar]
- Everitt BJ, Wolf ME. Psychomotor stimulant addiction: a neural systems perspective. J Neurosci. 2002;22:3312–3320. doi: 10.1523/JNEUROSCI.22-09-03312.2002. [DOI] [PMC free article] [PubMed] [Google Scholar]
- George O, Ghozland S, Azar MR, Cottone P, Zorrilla EP, Parsons LH, O'Dell LE, Richardson HN, Koob GF. CRF-CRF1 system activation mediates withdrawal-induced increases in nicotine self-administration in nicotine-dependent rats. Proc Natl Acad Sci U S A. 2007;104:17198–17203. doi: 10.1073/pnas.0707585104. [DOI] [PMC free article] [PubMed] [Google Scholar]
- Grimm JW, Hope BT, Wise RA, Shaham Y. Neuroadaptation. Incubation of cocaine craving after withdrawal. Nature. 2001;412:141–142. doi: 10.1038/35084134. [DOI] [PMC free article] [PubMed] [Google Scholar]
- Guillem K, Vouillac C, Azar MR, Parsons LH, Koob GF, Cador M, Stinus L. Monoamine oxidase inhibition dramatically increases the motivation to self-administer nicotine in rats. J Neurosci. 2005;25:8593–8600. doi: 10.1523/JNEUROSCI.2139-05.2005. [DOI] [PMC free article] [PubMed] [Google Scholar]
- Henningfield JE, Fant RV, Gitchell J, Shiffman S. Tobacco dependence. Global public health potential for new medications development and indications. Ann N Y Acad Sci. 2000;909:247–256. doi: 10.1111/j.1749-6632.2000.tb06686.x. [DOI] [PubMed] [Google Scholar]
- Hollander JA, Carelli RM. Abstinence from cocaine self-administration heightens neural encoding of goal-directed behaviors in the accumbens. Neuropsychopharmacology. 2005;30:1464–1474. doi: 10.1038/sj.npp.1300748. [DOI] [PubMed] [Google Scholar]
- Hollander JA, Carelli RM. Cocaine-associated stimuli increase cocaine seeking and activate accumbens core neurons after abstinence. J Neurosci. 2007;27:3535–3539. doi: 10.1523/JNEUROSCI.3667-06.2007. [DOI] [PMC free article] [PubMed] [Google Scholar]
- Ikemoto S, Qin M, Liu ZH. Primary reinforcing effects of nicotine are triggered from multiple regions both inside and outside the ventral tegmental area. J Neurosci. 2006;26:723–730. doi: 10.1523/JNEUROSCI.4542-05.2006. [DOI] [PMC free article] [PubMed] [Google Scholar]
- Jones JL, Wheeler RA, Carelli RM. Behavioral responding and nucleus accumbens cell firing are unaltered following periods of abstinence from sucrose. Synapse. 2008;62:219–228. doi: 10.1002/syn.20486. [DOI] [PubMed] [Google Scholar]
- Kauer JA, Malenka RC. Synaptic plasticity and addiction. Nat Rev Neurosci. 2007;8:844–858. doi: 10.1038/nrn2234. [DOI] [PubMed] [Google Scholar]
- Kelley AE, Stinus L. Disappearance of hoarding behavior after 6-hydroxydopamine lesions of the mesolimbic dopamine neurons and its reinstatement with l-dopa. Behav Neurosci. 1985;99:531–545. doi: 10.1037//0735-7044.99.3.531. [DOI] [PubMed] [Google Scholar]
- Kenny PJ, Markou A. The ups and downs of addiction: role of metabotropic glutamate receptors. Trends Pharmacol Sci. 2004;25:265–272. doi: 10.1016/j.tips.2004.03.009. [DOI] [PubMed] [Google Scholar]
- Kenny PJ, Markou A. Nicotine self-administration acutely activates brain reward systems and induces a long-lasting increase in reward sensitivity. Neuropsychopharmacology. 2006;31:1203–1211. doi: 10.1038/sj.npp.1300905. [DOI] [PubMed] [Google Scholar]
- Kenny PJ, Gasparini F, Markou A. Group II metabotropic and alpha-amino-3-hydroxy-5-methyl-4-isoxazole propionate (AMPA)/kainate glutamate receptors regulate the deficit in brain reward function associated with nicotine withdrawal in rats. J Pharmacol Exp Ther. 2003;306:1068–1076. doi: 10.1124/jpet.103.052027. [DOI] [PubMed] [Google Scholar]
- Koob GF, Le Moal M. Drug abuse: hedonic homeostatic dysregulation. Science. 1997;278:52–58. doi: 10.1126/science.278.5335.52. [DOI] [PubMed] [Google Scholar]
- Koob GF, Le Moal M. Drug addiction, dysregulation of reward, and allostasis. Neuropsychopharmacology. 2001;24:97–129. doi: 10.1016/S0893-133X(00)00195-0. [DOI] [PubMed] [Google Scholar]
- Lecca D, Cacciapaglia F, Valentini V, Gronli J, Spiga S, Di Chiara G. Preferential increase of extracellular dopamine in the rat nucleus accumbens shell as compared to that in the core during acquisition and maintenance of intravenous nicotine self-administration. Psychopharmacology (Berl) 2006;184:435–446. doi: 10.1007/s00213-005-0280-4. [DOI] [PubMed] [Google Scholar]
- Lerman C, LeSage MG, Perkins KA, O'Malley SS, Siegel SJ, Benowitz NL, Corrigall WA. Translational research in medication development for nicotine dependence. Nat Rev Drug Discov. 2007;6:746–762. doi: 10.1038/nrd2361. [DOI] [PubMed] [Google Scholar]
- Liechti ME, Lhuillier L, Kaupmann K, Markou A. Metabotropic glutamate 2/3 receptors in the ventral tegmental area and the nucleus accumbens shell are involved in behaviors relating to nicotine dependence. J Neurosci. 2007;27:9077–9085. doi: 10.1523/JNEUROSCI.1766-07.2007. [DOI] [PMC free article] [PubMed] [Google Scholar]
- Mansvelder HD, McGehee DS. Long-term potentiation of excitatory inputs to brain reward areas by nicotine. Neuron. 2000;27:349–357. doi: 10.1016/s0896-6273(00)00042-8. [DOI] [PubMed] [Google Scholar]
- Mansvelder HD, Keath JR, McGehee DS. Synaptic mechanisms underlie nicotine-induced excitability of brain reward areas. Neuron. 2002;33:905–919. doi: 10.1016/s0896-6273(02)00625-6. [DOI] [PubMed] [Google Scholar]
- McClung CA, Ulery PG, Perrotti LI, Zachariou V, Berton O, Nestler EJ. DeltaFosB: a molecular switch for long-term adaptation in the brain. Brain Res Mol Brain Res. 2004;132:146–154. doi: 10.1016/j.molbrainres.2004.05.014. [DOI] [PubMed] [Google Scholar]
- Nestler EJ. Historical review: molecular and cellular mechanisms of opiate and cocaine addiction. Trends Pharmacol Sci. 2004;25:210–218. doi: 10.1016/j.tips.2004.02.005. [DOI] [PubMed] [Google Scholar]
- Nestler EJ. Is there a common molecular pathway for addiction? Nat Neurosci. 2005;8:1445–1449. doi: 10.1038/nn1578. [DOI] [PubMed] [Google Scholar]
- Nestler EJ, Aghajanian GK. Molecular and cellular basis of addiction. Science. 1997;278:58–63. doi: 10.1126/science.278.5335.58. [DOI] [PubMed] [Google Scholar]
- O'Dell LE, Koob GF. “Nicotine deprivation effect” in rats with intermittent 23-hour access to intravenous nicotine self-administration. Pharmacol Biochem Behav. 2007;86:346–353. doi: 10.1016/j.pbb.2007.01.004. [DOI] [PMC free article] [PubMed] [Google Scholar]
- Partridge JG, Apparsundaram S, Gerhardt GA, Ronesi J, Lovinger DM. Nicotinic acetylcholine receptors interact with dopamine in induction of striatal long-term depression. J Neurosci. 2002;22:2541–2549. doi: 10.1523/JNEUROSCI.22-07-02541.2002. [DOI] [PMC free article] [PubMed] [Google Scholar]
- Paterson NE, Markou A. Prolonged nicotine dependence associated with extended access to nicotine self-administration in rats. Psychopharmacology (Berl) 2004;173:64–72. doi: 10.1007/s00213-003-1692-7. [DOI] [PubMed] [Google Scholar]
- Paxinos G, Watson C. Ed 4. New York: Elsevier; 2004. The rat brain in stereotaxic coordinates. [DOI] [PubMed] [Google Scholar]
- Pennartz CM, Groenewegen HJ, Lopes da Silva FH. The nucleus accumbens as a complex of functionally distinct neuronal ensembles: an integration of behavioural, electrophysiological and anatomical data. Prog Neurobiol. 1994;42:719–761. doi: 10.1016/0301-0082(94)90025-6. [DOI] [PubMed] [Google Scholar]
- Peoples LL. Application of chronic extracellular recording to studies of drug self-administration. Methods in drug abuse research. In: Waterhouse BD, editor. New York: CRC; 2003. [Google Scholar]
- Peoples LL, Uzwiak AJ, Gee F, Fabbricatore AT, Muccino KJ, Mohta BD, West MO. Phasic accumbal firing may contribute to the regulation of drug taking during intravenous cocaine self-administration sessions. Ann N Y Acad Sci. 1999;877:781–787. doi: 10.1111/j.1749-6632.1999.tb09322.x. [DOI] [PubMed] [Google Scholar]
- Peoples LL, Lynch KG, Lesnock J, Gangadhar N. Accumbal neural responses during the initiation and maintenance of intravenous cocaine self-administration. J Neurophysiol. 2004;91:314–323. doi: 10.1152/jn.00638.2003. [DOI] [PubMed] [Google Scholar]
- Peoples LL, Kravitz AV, Lynch KG, Cavanaugh DJ. Accumbal neurons that are activated during cocaine self-administration are spared from inhibitory effects of repeated cocaine self-administration. Neuropsychopharmacology. 2007a;32:1141–1158. doi: 10.1038/sj.npp.1301203. [DOI] [PubMed] [Google Scholar]
- Peoples LL, Kravitz AV, Guillem K. The role of accumbal hypoactivity in cocaine addiction. ScientificWorldJournal. 2007b;7:22–45. doi: 10.1100/tsw.2007.266. [DOI] [PMC free article] [PubMed] [Google Scholar]
- Pfaus JG, Phillips AG. Role of dopamine in anticipatory and consummatory aspects of sexual behavior in the male rat. Behav Neurosci. 1991;105:727–743. doi: 10.1037//0735-7044.105.5.727. [DOI] [PubMed] [Google Scholar]
- Pontieri FE, Tanda G, Orzi F, Di Chiara G. Effects of nicotine on the nucleus accumbens and similarity to those of addictive drugs. Nature. 1996;382:255–257. doi: 10.1038/382255a0. [DOI] [PubMed] [Google Scholar]
- Rada P, Avena NM, Hoebel BG. Daily bingeing on sugar repeatedly releases dopamine in the accumbens shell. Neuroscience. 2005;134:737–744. doi: 10.1016/j.neuroscience.2005.04.043. [DOI] [PubMed] [Google Scholar]
- Rank J, Jubie JL, Fox SE, Wolfson RC, Dafny N. Behavioral approaches to brain research. In: Robinson T, editor. New York: Oxford UP; 1983. [Google Scholar]
- Reilly S. Reinforcement value of gustatory stimuli determined by progressive ratio performance. Pharmacol Biochem Behav. 1999;63:301–311. doi: 10.1016/s0091-3057(99)00009-x. [DOI] [PubMed] [Google Scholar]
- Richardson NR, Roberts DC. Progressive ratio schedules in drug self-administration studies in rats: a method to evaluate reinforcing efficacy. J Neurosci Methods. 1996;66:1–11. doi: 10.1016/0165-0270(95)00153-0. [DOI] [PubMed] [Google Scholar]
- Robbins TW, Everitt BJ. A role for mesencephalic dopamine in activation: commentary on Berridge (2006) Psychopharmacology (Berl) 2007;191:433–437. doi: 10.1007/s00213-006-0528-7. [DOI] [PubMed] [Google Scholar]
- Saal D, Dong Y, Bonci A, Malenka RC. Drugs of abuse and stress trigger a common synaptic adaptation in dopamine neurons. Neuron. 2003;37:577–582. doi: 10.1016/s0896-6273(03)00021-7. [DOI] [PubMed] [Google Scholar]
- Salamone JD, Cousins MS, McCullough LD, Carriero DL, Berkowitz RJ. Nucleus accumbens dopamine release increases during instrumental lever pressing for food but not free food consumption. Pharmacol Biochem Behav. 1994;49:25–31. doi: 10.1016/0091-3057(94)90452-9. [DOI] [PubMed] [Google Scholar]
- Schotanus SM, Chergui K. Dopamine D1 receptors and group I metabotropic glutamate receptors contribute to the induction of long-term potentiation in the nucleus accumbens. Neuropharmacology. 2008;54:837–844. doi: 10.1016/j.neuropharm.2007.12.012. [DOI] [PubMed] [Google Scholar]
- Shiffman S, Mason KM, Henningfield JE. Tobacco dependence treatments: review and prospectus. Annu Rev Public Health. 1998;19:335–358. doi: 10.1146/annurev.publhealth.19.1.335. [DOI] [PubMed] [Google Scholar]
- Stein EA, Pankiewicz J, Harsch HH, Cho JK, Fuller SA, Hoffmann RG, Hawkins M, Rao SM, Bandettini PA, Bloom AS. Nicotine-induced limbic cortical activation in the human brain: a functional MRI study. Am J Psychiatry. 1998;155:1009–1015. doi: 10.1176/ajp.155.8.1009. [DOI] [PubMed] [Google Scholar]
- Tran-Nguyen LT, Fuchs RA, Coffey GP, Baker DA, O'Dell LE, Neisewander JL. Time-dependent changes in cocaine-seeking behavior and extracellular dopamine levels in the amygdala during cocaine withdrawal. Neuropsychopharmacology. 1998;19:48–59. doi: 10.1016/S0893-133X(97)00205-4. [DOI] [PubMed] [Google Scholar]
- Volkow ND, Wang GJ, Fowler JS, Telang F. Overlapping neuronal circuits in addiction and obesity: evidence of systems pathology. Philos Trans R Soc Lond B Biol Sci. 2008;363:3191–3200. doi: 10.1098/rstb.2008.0107. [DOI] [PMC free article] [PubMed] [Google Scholar]
- Zahm DS, Brog JS. On the significance of subterritories in the “accumbens” part of the rat ventral striatum. Neuroscience. 1992;50:751–767. doi: 10.1016/0306-4522(92)90202-d. [DOI] [PubMed] [Google Scholar]