Abstract
Passive samplers were deployed across Cleveland, OH and Chicago, IL to evaluate the spatial variability of airborne PCBs in urban areas. We measured ∑PCB concentrations, the sum of 151 congeners or congener groups quantified using tandem mass spectrometry, spatial distributions, and congener profiles in two urban areas in the Great Lakes region. Mean ∑PCB concentrations were significantly different between Cleveland (1.73±1.16 ng m−3) and Chicago (1.13 ± 0.58 ng m−3) during the August 2008 sampling period. Mean congener profiles were compared with commercial Aroclor mixtures and found to be similar to Aroclor 1242 in Cleveland and similar to a mixture of 1242 and 1254 in Chicago. We observed large spatial variation in concentrations and weak or no significant autocorrelation between sites in both cities. ‘Hot spots’ of high ∑PCB concentrations were identified in both urban areas and the congener profile at these locations were most strongly correlated to that of PCB Aroclor mixtures. Congener profiles showed important differences including the enrichment of dioxin-like congeners in Chicago.
Keywords: PCBs, spatial distribution, urban, congener profiles, passive sampling
Introduction
Urban areas are known sources of polychlorinated biphenyls (PCBs) to the regional atmosphere (1-13). Although a number of studies have examined city specific PCBs concentration, little is known about inter- and intra-city variability of PCB concentrations and their emission sources. Only a few studies have examined the spatial distribution of airborne PCBs within large urban areas. Basu et.al (14) measured airborne PCBs at two locations in Chicago, Du et.al (15) measured airborne PCBs at 32 sites across Philadelphia, and Hu et.al (16) measured airborne PCBs at 37 sites across Chicago although they reported only the concentration of one congener (3,3′dichlorobiphenyl). Historically, PCB measurements of urban air have been made using single-site high-volume (Hi-Vols) samplers (1,3-7,9,17). Long-term monitoring studies of temporal trends and regional variations in airborne PCBs have also traditionally used Hi-Vols (18-22) they do not represent spatial trends of PCBs across an urban area.
Recently, researchers have turned to passive sampling to measure the spatial distribution of PCBs. Baek et al.(23) and Yeo et.al (24) report such measurements in South Korea, Jaward et.al (25) in Europe, and Pozo et.al.(26) globally with the GAPS study. Passive sampling can generate important information on the spatial distribution of PCBs across an urban area. First, ‘hot spots’, areas of high concentrations of PCBs can be identified (27-29) and these ‘hot spots’ can form the basis for further studies that pin-point the sources of PCBs and remediation efforts. Second, a more accurate representation of mean PCB concentration for urban areas may be estimated from many passive sampling results rather than single-point measurements. Better understanding of airborne PCBs in cities near the Great Lakes is particularly important because urban areas have been identified as a major source of PCBs now entering the lakes and accumulating in the fish. All the Great Lakes have fish consumption advisories, established primarily because of continued elevated concentrations of PCBs.
This is the first study, to our knowledge, to compare PCB concentrations spatially distributed across two major urban areas with data collected during the same time period. We hypothesized that the two urban areas, Cleveland and Chicago, would exhibit different PCB concentrations and congener profiles. Our specific objectives in this study were to compare the spatial variation of PCBs in Cleveland and Chicago in terms of ∑PCB concentrations, congener profiles, and toxicologically-relevant congener concentrations.
Methods and Materials
Selection of Sampling Sites
Different methods were used to select sampling sites in the two cities. Both methods required a prior knowledge about the pollutant in question to optimize site selection (30-31). Since spatially detailed intra-city PCB data does not exist in either of the selected cities we relied on two different criteria for identifying sample sites. In Cleveland, we used a novel hybrid-regression approach to capture the spatial variability in air pollution while minimizing the number of sites required (30-31). Specifically, we estimated the spatial distribution of mass concentrations of airborne particles smaller than 10 μm (PM10) as a proxy for PCB concentrations. Following Kumar et al. (31), we used land-use and land-cover data, proximity of the site to potential emission sources for PM10, primarily industrial facilities, and aerosol optical depth data taken from satellites and corrected for meteorological conditions. Next, we defined the maximum variance of concentrations within the 21 sample sites (n) that our budget allowed. We calculated the maximum variance using equation [1] as the locations where spatial autocorrelation is near 0 (ρz ~ 0) between a sampling site (Zi) and its neighboring sites (Zj). In the case of PM10, Z has units of μg m−3. K is defined as Zi Zj (36).
| (1) |
In Chicago, site selection was based on opportunity rather than optimization (16). The 17 sites sampled in August were chosen based on existing arrangements with local schools and businesses, all in residential areas, and although the sites provide an extensive spatial distribution in the urban area of Chicago, there was no design to capture maximum variability. The Chicago sample site distribution was designed to identify mean concentrations and ‘hot spots’ within residential areas and to characterize congener profiles in Chicago.
PCB Passive Air Sampling
We used passive air samplers coupled with polyurethane foam (PAS-PUF ) to quantitatively measure airborne PCBs at locations where it is difficult or impractical to install and maintain Hi-Vol vacuum pump samplers. Passive samplers also have the advantage of accumulating high masses of PCBs, resulting in fewer non-detects than Hi-Vols. The collection of higher PCB mass, as well as uptake of particle bound congeners, only at a slower uptake rate (32), with passive samplers can result in a more accurate comparison of congener profiles between sites (33). We have applied the passive sampler design of Harner and coworker (12) and have tested it to determine the sampling flow rates for PCB congeners (34).
PAS-PUF samplers were deployed at both urban locations in the beginning of August 2008, with total deployment periods for Cleveland samples from 20-22 days (Table S1), and Chicago from 13-47 days (Table S2). Concentrations for both Cleveland and Chicago were calculated using sampling rates (m3d−1), called R-values (12,26-27,32,35), derived from the loss of the depuration compounds spiked onto the PUF disks prior to deployment. R-values derived for each individual site in Cleveland ranged from 4.1-6.6 m3d−1 (Table S1), and site specific R-values were applied in order to calculated PCB concentrations. R-values for Chicago were derived from three sites and ranged from 4.8-6.7 m3d−1 (Table S2), with a mean R-value of 5.8 m3d−1 applied to all samples collected from Chicago. Applied R-values are similar to previously reported mean values for PCBs in outdoor air using this passive sampling design (34).
Sampling Media Preparation
PUF disks were cleaned (Soxhlet extraction 24 h in hexane followed by 24 h in acetone), dried in a desiccator, and a subset of the samples was spiked with depuration compounds: 50 ng per congener of PCBs 13C-labeled 28, 13C-labeled 111, 13C-labeled 178 (Cambridge Isotope Laboratories). The method used to spike depuration compounds onto PUF is described previously (34), where depuration compounds are added to hexane and poured onto PUF disks and dried under nitrogen blow-down. PAS-PUF sampling chambers were solvent-rinsed with hexane and acetone just prior to deployment. Exposed PUF disks were placed in sealed zip lock bags and immediately transferred to a freezer.
Sample Extraction and Analysis
All sample media were extracted with pressurized fluid extraction (Dionex ASE-200), using pesticide grade hexane as described previously (34). Extracts were concentrated to 0.5 mL (Caliper TurboVap II). Surrogate standards (50 ng each of PCB 14, 65, 166 from Accustandard) were added just prior to extraction. Internal standards (50 ng of PCB 204 from Accustandard) were added just prior to analysis. All samples were analyzed using a modified EPA Method 1668A on Tandem Mass Spectrometry GC/MS/MS (Quattro Micro™ GC, Micromass MS Technologies) using a Supelco SPB-Octyl (30m × 0.25mm × .25μm) with GC inlet parameters previously reported (34). Using this method we were able to identify 156 unique congeners, with an additional 53 congeners coeluting. Identification of three 13C-labeled congeners (28, 111, and 178 from Accustandard) used as depuration compounds was also achieved using this method. After removal of compounds used as standards, this study quantified 151 PCB peaks.
Quality Assurance and Quality Control
Masses were corrected using surrogate recoveries of PCB 14 and 166. PCB 65 was not used for correction as it occasionally coeluted with PCB congeners 44 and 47, which were subsequently eliminated from our analysis. Surrogate recoveries for Cleveland ranged from 60-80% and for Chicago from 70-99%. Instrument detection limits (IDL) were 0.01ng for mono-trichlorinated congeners, 0.02 ng for tetra-heptachlorinated congeners, and 0.03 ng for octa-decachlorinated. Limit of quantification (LOQ) was calculated as three times the standard deviation of peaks from the method blank plus the background level from instrumental blanks, and was calculated as 0.07 ng per congener. Field, trip, and method blanks were all less than LOQ. The mean field duplicate for Cleveland was 13% relative difference for three sites, Chicago field duplicates were a mean of 9% relative difference for three sites. Instrument duplicates show a 7% relative difference for all samples run.
Results and Discussion
Differences in ∑PCB Concentrations for Cleveland and Chicago Air
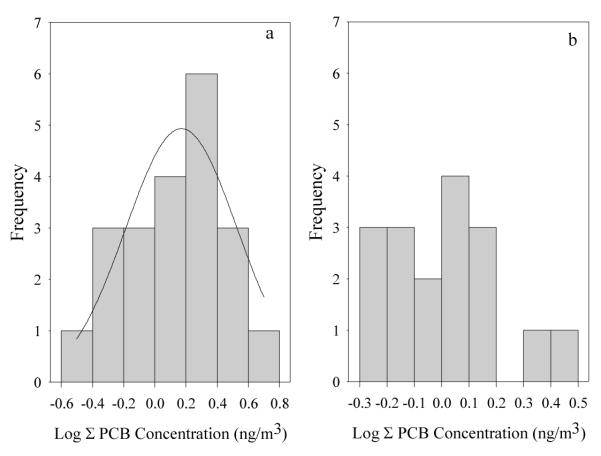
Measured ∑PCB concentrations are summarized in Table 1. The mean concentrations were higher in Cleveland (1.73±1.16 ng m−3) than in Chicago (1.13±0.58 ng m−3) at the 95% confidence level. A Wilcoxon signed rank test was applied to determine significant difference; a t-test could not be applied since ∑PCB concentrations from Chicago do not follow a log normal distribution (Figure 1). Results of the Wilcoxon test conclude that the samples from Cleveland and Chicago are significantly different (p = 0.005781 for α = 0.01).
Table 1.
Statical analysis reporting mean, standard deviation, median, percentiles, and range for ∑PCB concentrations (ng m−3) for Cleveland air and Chicago air. The two cities ∑PCB concentrations were significantly different (p< 0.01) using a Wilcoxon signed rank test.
| Cleveland | Chicago | ||
|---|---|---|---|
| Mean ( ng m−3) | 1.73 | 1.37 (geometric) | 1.13 |
| Standard Deviation (ng m−3) | 1.16 | 2.06 (geometric) | 0.58 |
| Median ( ng m−3) | 1.54 | 1.07 | |
| 95th percentile (ng m−3) | 3.92 | 2.25 | |
| 5th percentile (ng m−3) | 0.52 | 0.60 | |
| Range ( ng m−3) | 0.34-4.24 | 0.57-2.69 |
Figure 1.
Log transformed concentration distribution for ∑PCBs for Cleveland air(a) and Chicago air(b). Concentration distribution for Cleveland has a Gaussian 3-parameter fit applied. Differences in distribution are probably due to differences in sample site land use; Chicago samples represent primarily residential areas where Cleveland represents industrial, residential and rural land uses.
Cleveland exhibited a wider range of concentrations than Chicago, from 0.52-3.92 ng m−3 and 0.60-2.25 ng m−3 for 5th and 95th percentiles, respectively (Table 1). As shown in Figure 1, the concentration distribution for Chicago is skewed to the left of the distribution plot, toward lower concentrations. To test if the difference between Cleveland and Chicago was due to different applications of R-values to calculate concentrations, average for Chicago and site specific for Cleveland, we used a the average R-value for Cleveland applied to all samples. Results still showed greater variation in Cleveland and significantly different concentrations (p<0.01). Since the samples were collected during the same time, R-value application did not affect the difference in variation, and have similar mean temperatures during the deployment (Table S1 and Table S2), the higher variation in concentrations may be due to the sampling sites and land use around the sampler.
The difference in ∑PCB concentrations is probably due to the different distribution of samplers within each city: the Cleveland samplers covered more area and a larger variety of land uses (Figure S1). The area sampled in Cleveland is four times the area of sampler placement in Chicago. Furthermore, the land uses in the area sampled in Cleveland include industrial sites, residential sites, and rural sites. In Chicago, most of the sampling sites were urban residential (Figure S1).
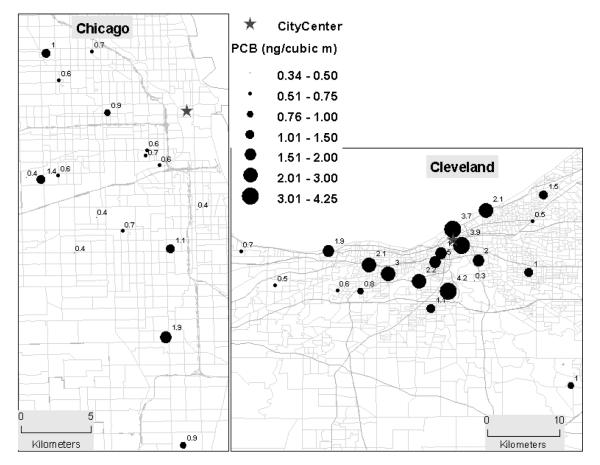
The spatial distribution of ∑PCB concentrations were plotted for both Cleveland and Chicago (Figure 2). The maps show multiple locations of high ∑PCB concentration (‘hot spots’) in both Chicago and Cleveland, similar to results from other studies using passive sampling in urban areas (12,15,27). Interestingly, spatial autocorrelation between sites was not significant in either city as determined using Moran’s I in the R program (R Development Core Team 2006) (Figure S2 and Table S3). For example, consider three sites in western Chicago (Figure 2). Although the sites lie within 1.68 km of each other, PCB concentrations at once site were recorded as 1.4 ng m−3 while its two closest neighbors record 0.4 ng m−3 and 0.6 ng m−3, respectively. Similarly, in Cleveland, site proximity does not predict their similarity. The lack of PCB concentration autocorrelation in the two cities suggests that results from each sampler is representative of only the immediate area near where it is deployed. This suggests that sources of airborne PCBs are distributed across the city and atmospheric dispersion is less important than local emissions.
Figure 2.
Multiple ‘hot spots’ are observed in spatial distributions for ∑PCB airborne concentrations measured in Chicago and Cleveland. The size of the symbol and the number next to the sampling site indicate the concentration of ∑PCB (ng m−3) measured. The lack of significant autocorrelation for the sites in each urban area suggests that atmospheric concentrations are a reflection of highly localized emission sources.
Inter-city Variation in Congener Profiles
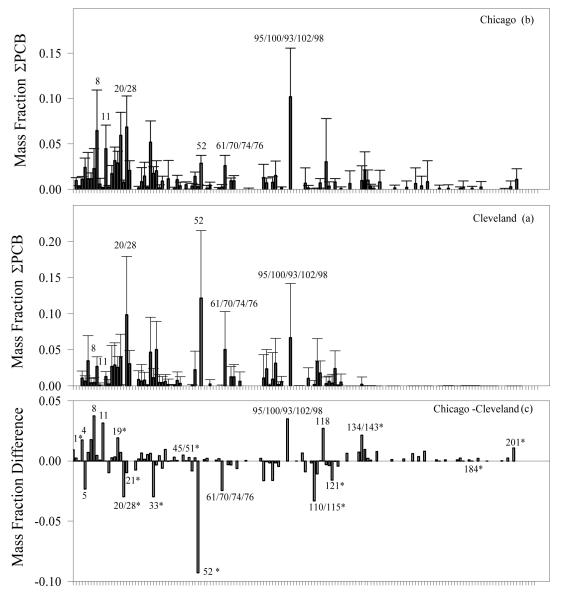
Mean PCB congener profiles measured in Cleveland and Chicago have significantly different individual congeners between the two profiles (Figure 3). These results may be attributed to different potential sources of PCBs, as the mean profiles from each city are well correlated to different Aroclor mixtures. A Wilcoxon signed rank test (p < 0.01) was applied to determine significantly different individual congeners between the two urban areas and fifteen congener/congener pairs were shown to be significantly different (PCBs 1,2, 19, 20/28, 33, 45/51, 50/53, 52, 110/115, 112,121, 134/143, 184, 201).
Figure 3.
Congener profiles of average normalized mass with relative standard deviation error bars plotted for Chicago air(a), Cleveland air(b), and the mean difference, Chicago-Cleveland(c) with congeners enriched in Chicago above the bar and those in Cleveland below the bar, where * indicates a congener that is significantly different. Chicago’s mean profile was correlated to Aroclor mixture of 1242:1254 (65:35) and Cleveland to Aroclor 1242.
Mean congener profiles of both Cleveland and Chicago correlate well to different Aroclor mixtures. A linear regression was applied to a plot comparing the mean congener profile for Cleveland sites against the normalized mass fraction of each congener in Aroclor 1242 (36). The relationship is considered strong with an R2 = 0.789. We compared the Chicago congener profile to a synthetic mixture of congeners (Aroclor 1242:1254 at 65:35 ratio) used in animal studies to mimic the distribution of PCBs in Chicago (37). The 65:35 mixture of Aroclors 1242:1254 plotted against Chicago, also shows a good linear relationship with R2 = 0.672. Other Aroclor mixtures were compared to both Cleveland and Chicago, but resulted in R2 values <0.320.
Intra-city Variation in Congener Profiles
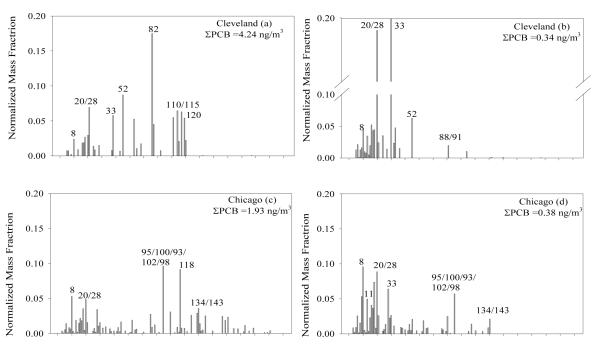
Within both Cleveland and Chicago sites with the highest concentrations, ‘hot spots’ show a congener pattern that is more similar to commercial Aroclor mixtures than the congener patterns observed at locations with low airborne PCB concentrations. Congener profiles for two sites from each urban area are shown in Figure 4, representing sites with lowest and highest ∑PCB concentration. Sites with high ∑PCB concentrations, such as site 15 in Cleveland and site 18 in Chicago (Tables S1 and S2), have congener profiles that have strong linear relationships to Aroclor mixes. Results for Cleveland site 15 against Aroclor 1242 was an R2 of 0.802. Linear regression for Chicago site 18 congener profiles against 65:35 Aroclor 1242:1254 resulted in an R2 value of 0.720. Sites from both Chicago and Cleveland that have low ∑PCB concentrations, sites 45 and site 20 respectively, show enrichment in lower chlorinated PCBs, similar to remote areas (12,15,38). Sites with low ∑PCB concentrations also have a very weak correlation to Aroclors (R2=0.321 Cleveland/1242 and R2 = 0.213 Chicago/1242:1254).
Figure 4.
Site specific congener profiles for Cleveland sites 15(a) and 20(b) and Chicago sites 18(c) and 45(d). Site 15 for Cleveland and site 18 for Chicago represent high ∑ PCB concentrations and are well correlated to Aroclor mixture profiles. Site 20 for Cleveland and site 45 for Chicago represent low ∑ PCB concentrations and are poorly correlated to Aroclors, exemplifying the differences in congener profiles in intra-city environments.
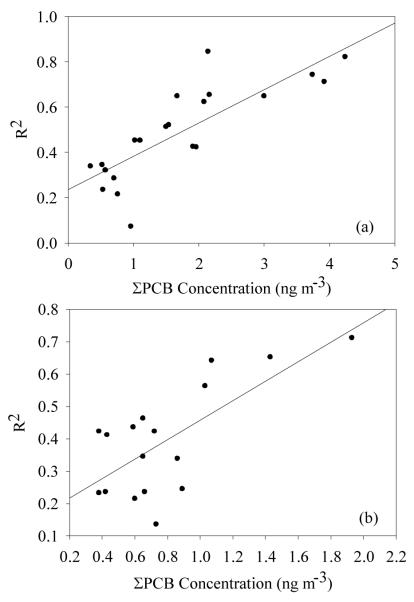
A plot of site specific ∑PCB concentrations against R2 values from linear regressions between the site and 65:35 Aroclor 1242:1254 in Chicago and Aroclor 1242 for Cleveland show a good relationship between ∑PCB concentration and similarity to Aroclors (Figure 5). Results show that site specific congener profiles within urban areas vary spatially and correlations indicate that sites with high ∑PCB concentrations are good indicators of potential sources of PCBs from Aroclors.
Figure 5.
Plot of site specific R2 values calculated from linear regression between site specific congener distributions and Aroclor mixes (Aroclor 1242 for Cleveland samples and 65:35 Aroclor 1242:1254 for Chicago) and site specific ∑ PCB concentrations for Cleveland (a) and Chicago (b), demonstrating the high amount of variability in intra-city congener profiles.
Toxicological Equivalence
Toxicological equivalency factors (TEQ) for PCBs in the air of Cleveland and Chicago were calculated using toxicological equivalence factors (TEF) from the World Health Organization for twelve dioxin-like PCB congeners (39). The presence of toxicologically relevant congeners in air suggests a potential for human exposure to these compounds. Airborne PCBs are deposited into the Great Lakes and accumulate in sport fish which may be consumed by humans. Airborne PCBs in these cities may also indicate the presence of contaminated soils or building materials that may pose direct hazards to humans. The TEQ concentration for airborne PCBs in Chicago was is 9.22 × 10⁻⁷ ng m−3, while Cleveland TEQ is lower at 4.81 × 10⁻⁷ ng m−3; although both are significantly lower than pure Aroclor TEQs which range from 0.14- 46.4 ug g−1 (40). Contributions of individual congeners (Figure S3) show that Chicago TEQ is dominated by PCB 118 at 78% of the total TEQ, followed by PCB 105 at 17%. Cleveland TEQ is dominated primarily by PCB 118 and PCB 123. The differences in TEQs for the two urban areas stress the importance of reporting congener profiles and individual PCB concentrations, because although Cleveland mean ∑PCB concentration is higher than Chicago, the TEQ is lower.
Results from this study show that optimization of sampling, and spatial resolutions over an urban area is important to capture representative ∑PCB concentrations of that urban area. ∑PCB concentration and site specific congener profiles also vary spatially within urban areas. Both Cleveland and Chicago have no significant autocorrelation between sites, suggesting local emissions are important. Sites with high ∑PCB concentrations (‘hot spots’) have a good correlation to known Aroclor mixes, and sites with low ∑PCB concentrations have enrichment in lower chlorinated PCBs and poor correlation to Aroclors within urban areas. Results from this study also suggest that individual congener concentrations, as well as ∑PCB concentrations are important to understanding the potential for deposition of toxicologically relevant PCBs into the Great Lakes from urban areas.
Supplementary Material
Acknowledgements
This work was funded as part of the Iowa Superfund Basic Research Program, NIEHS Grant ES013661. We appreciate the assistance of Mobile Care in Chicago, IL and EPA Region 5 Office, Cleveland, OH for deployment of the passive samplers, the assistance with the Wilcoxon signed rank test from Kai Wang at The University of Iowa, and the assistance of our Laboratory Director, Collin Just.
Footnotes
Brief: Airborne PCBs spatially vary in the urban areas of Cleveland and Chicago and exhibit significantly different inter and intra-city ∑PCB concentrations and congener profiles.
Supporting Information Supporting information contains tables for both Cleveland and Chicago with site name, latitude and longitude, ∑PCB concentration, deployment and collection dates, average temperate, and calculated R-values. Maps of land cover with concentrations are included for both Chicago and Cleveland. Variograms and statistical analysis used to determine autocorrelation between sites in both Chicago and Cleveland are also found in supporting information.
References Cited
- (1).Offenberg JH, Baker JE. Influence of Baltimore’s urban atmosphere on organic contaminants over the northern Chesapeake Bay. Journal of the Air & Waste Management Association. 1999;49:959–965. doi: 10.1080/10473289.1999.10463864. [DOI] [PubMed] [Google Scholar]
- (2).Offenberg J, Simcik M, Baker J, Eisenreich SJ. The impact of urban areas on the deposition of air toxics to adjacent surface waters: A mass budget of PCBs in Lake Michigan in 1994. Aquatic Sciences. 2005;67:79–85. [Google Scholar]
- (3).Totten LA, Gigliotti CL, Vanry DA, Offenberg JH, Nelson ED, Dachs J, Reinfelder JR, Eisenreich SJ. Atmospheric concentrations and deposition of polychorinated biphenyls to the Hudson River Estuary. Environ Sci Technol. 2004;38:2568–2573. doi: 10.1021/es034878c. [DOI] [PubMed] [Google Scholar]
- (4).Totten LA, Brunciak PA, Gigliotti CL, Dachs J, Glenn TR, Nelson ED, Eisenreich SJ. Dynamic air-water exchange of polychlorinated biphenyls in the New York - New Jersey Harbor Estuary. Environ Sci Technol. 2001;35:3834–3840. doi: 10.1021/es010791k. [DOI] [PubMed] [Google Scholar]
- (5).Miller SM, Green ML, Depinto JV, Hornbuckle KC. Results from the Lake Michigan mass balance study: Concentrations and fluxes of atmospheric polychlorinated biphenyls and trans-nonachlor. Environ Sci Technol. 2001;35:278–285. doi: 10.1021/es991463b. [DOI] [PubMed] [Google Scholar]
- (6).Hafner WD, Hites RA. Potential sources pesticides, PCBs, and PAHs to the atmosphere of the Great Lakes. Environ Sci Technol. 2003;37:3764–3773. doi: 10.1021/es034021f. [DOI] [PubMed] [Google Scholar]
- (7).Simcik MF, Zhang HX, Eisenreich SJ, Franz TP. Urban contamination of the Chicago coastal Lake Michigan atmosphere by PCBs and PAHs during AEOLOS. Environ Sci Technol. 1997;31:2141–2147. [Google Scholar]
- (8).Hornbuckle KC, Carlson DL, Swackhamer DL, Baker JE, Eisenreich SJ. Polychlorinated biphenyls in the Great Lakes. In: Hites RA, editor. Persistent Organic Pollutants in the Great Lakes. Springer-Verlag; Heidelberg: 2006. [Google Scholar]
- (9).Brunciak PA, Dachs J, Gigliotti CL, Nelson ED, Eisenreich SJ. Atmospheric polychlorinated biphenyl concentrations and apparent degradation in coastal New Jersey. Atmos Environ. 2001;35:3325–3339. [Google Scholar]
- (10).Gingrich SE, Diamond ML. Atmospherically derived organic surface films along an urban-rural gradient. Environ Sci Technol. 2001;35:4031–4037. doi: 10.1021/es010699o. [DOI] [PubMed] [Google Scholar]
- (11).Helm PA, Bidleman TF. Current combustion-related sources contribute to polychlorinated naphthalene and dioxin-like polychlorinated biphenyl levels and profiles in air in Toronto, Canada. Environ Sci Technol. 2003;37:1075–1082. doi: 10.1021/es020860a. [DOI] [PubMed] [Google Scholar]
- (12).Harner T, Shoeib M, Diamond M, Stern G, Rosenberg B. Using passive air samplers to assess urban - Rural trends for persistent organic pollutants. 1. Polychlorinated biphenyls and organochlorine pesticides. Environ Sci Technol. 2004;38:4474–4483. doi: 10.1021/es040302r. [DOI] [PubMed] [Google Scholar]
- (13).Wethington DM, Hornbuckle KC, Milwaukee WI. as a source of atmospheric PCBs to Lake Michigan. Environ Sci Technol. 2005;39:57–63. doi: 10.1021/es048902d. [DOI] [PubMed] [Google Scholar]
- (14).Basu I, Hafner WD, Mills WJ, Hites RA. Differences in atmospheric persistent organic pollutant concentrations at two locations in chicago. Journal of Great Lakes Research. 2004;30:310–315. [Google Scholar]
- (15).Du S, Wall SJ, Cacia D, Rodenburg LA. Passive Air Sampling for Polychlorinated Biphenyls in the Philadelphia Metropolitan Area. Environ Sci Technol. 2009;43:1287–1292. doi: 10.1021/es802957y. [DOI] [PubMed] [Google Scholar]
- (16).Hu DF, Martinez A, Hornbuckle KC. Discovery of Non-Aroclor PCB (3,3 ′- Dichlorobiphenyl) in Chicago Air. Environ Sci Technol. 2008;42:7873–7877. doi: 10.1021/es801823r. [DOI] [PMC free article] [PubMed] [Google Scholar]
- (17).Halsall CJ, Lee RGM, Coleman PJ, Burnett V, Hardingjones P, Jones KC. PCBS IN UK URBAN AIR. Environ Sci Technol. 1995;29:2368–2376. doi: 10.1021/es00009a032. [DOI] [PubMed] [Google Scholar]
- (18).Simcik MF, Basu I, Sweet CW, Hites RA. Temperature dependence and temporal trends of polychlorinated biphenyl congeners in the Great Lakes atmosphere. Environ Sci Technol. 1999;33:1991–1995. [Google Scholar]
- (19).Hillery BR, Simcik MF, Basu I, Hoff RM, Strachan WMJ, Burniston D, Chan CH, Brice KA, Sweet CW, Hites RA. Atmospheric deposition of toxic pollutants to the Great Lakes as measured by the integrated atmospheric deposition network. Environ Sci Technol. 1998;32:2216–2221. [Google Scholar]
- (20).Sun P, Basu I, Hites RA. Temporal trends of polychlorinated biphenyls in precipitation and air at Chicago. Environ Sci Technol. 2006;40:1178–1183. doi: 10.1021/es051725b. [DOI] [PubMed] [Google Scholar]
- (21).Sun P, Ilora, Basu, Blanchard P, Brice KA, Hites RA. Temporal and spatial trends of atmospheric polychlorinated biphenyl concentrations near the Great Lakes. Environ Sci Technol. 2007;41:1131–1136. doi: 10.1021/es061116j. [DOI] [PubMed] [Google Scholar]
- (22).Carlson DL, Hites RA. Temperature dependence of atmospheric PCB concentrations. Environ Sci Technol. 2005;39:740–747. doi: 10.1021/es049081f. [DOI] [PubMed] [Google Scholar]
- (23).Baek SY, Choi SD, Lee SJ, Chang YS. Assessment of the spatial distribution of coplanar PCBs, PCNs, and PBDEs in a multi-industry region of South Korea using passive air samplers. Environ Sci Technol. 2008;42:7336–7340. doi: 10.1021/es801019k. [DOI] [PubMed] [Google Scholar]
- (24).Yeo HG, Choi M, Chun MY, Kim TW, Cho KC, Young SW. Concentration characteristics of atmospheric PCBs for urban and rural area, Korea. Science of the Total Environment. 2004;324:261–270. doi: 10.1016/j.scitotenv.2003.10.031. [DOI] [PubMed] [Google Scholar]
- (25).Jaward FM, Farrar NJ, Harner T, Sweetman AJ, Jones KC. Passive air sampling of PCBs, PBDEs, and organochlorine pesticides across Europe. Environ Sci Technol. 2004;38:34–41. doi: 10.1021/es034705n. [DOI] [PubMed] [Google Scholar]
- (26).Pozo K, Harner T, Shoeib M, Urrutia R, Barra R, Parra O, Focardi S. Passive-sampler derived air concentrations of persistent organic pollutants on a north-south transect in Chile. Environ Sci Technol. 2004;38:6529–6537. doi: 10.1021/es049065i. [DOI] [PubMed] [Google Scholar]
- (27).Gouin T, Harner T, Blanchard P, Mackay D. Passive and active air samplers as complementary methods for investigating persistent organic pollutants in the Great Lakes basin. Environ Sci Technol. 2005;39:9115–9122. doi: 10.1021/es051397f. [DOI] [PubMed] [Google Scholar]
- (28).Heidtke T, Hartig JH, Zarull MA, Yu BN. PCB levels and trends within the detroit river-western lake erie basin: A historical perspective of ecosystem monitoring. Environmental Monitoring and Assessment. 2006;112:23–33. doi: 10.1007/s10661-006-0212-8. [DOI] [PubMed] [Google Scholar]
- (29).Broughton RK, Osborn D, Shore RF, Wienburg CL, Wadsworth RA. Identifying pollution hot spots from polychlorinated biphenyl residues in birds of prey. Environ Toxicol Chem. 2003;22:2519–2524. doi: 10.1897/02-302. [DOI] [PubMed] [Google Scholar]
- (30).Ott DK, Kumar N, Peters TM. Passive sampling to capture spatial variability in PM10-2.5. Atmos Environ. 2008;42:746–756. [Google Scholar]
- (31).Kumar N. An optimal spatial sampling design for intra-urban population exposure assessment. Atmos Environ. 2009;43:1153–1155. doi: 10.1016/j.atmosenv.2008.10.055. [DOI] [PMC free article] [PubMed] [Google Scholar]
- (32).Chaemfa C, Barber JL, Kim K, Harner T, Jones KC. Further studies on the uptake of persistent organic pollutants POPs by polyurethane foam disk samplers. Atmos Environ. 2009;42:3843–3849. [Google Scholar]
- (33).Gouin T, Jantunen L, Harner T, Blanchard P, Bidleman T. Spatial and temporal trends of chiral organochlorine signatures in Great Lakes air using passive air samplers. Environ Sci Technol. 2007;41:3877–3883. doi: 10.1021/es063015r. [DOI] [PubMed] [Google Scholar]
- (34).Persoon C, Hornbuckle KC. Calculation of passive sampling rates from both native PCBs and depuration compounds in indoor and outdoor environments. Chemosphere. 2009;74:917–923. doi: 10.1016/j.chemosphere.2008.10.011. [DOI] [PMC free article] [PubMed] [Google Scholar]
- (35).Pozo K, Harner T, Wania F, Muir DCG, Jones KC, Barrie LA. Toward a global network for persistent organic pollutants in air: Results from the GAPS study. Environ Sci Technol. 2006;40:4867–4873. doi: 10.1021/es060447t. [DOI] [PubMed] [Google Scholar]
- (36).Frame GM, Wagner RE, Carnahan JC, Brown JF, May RJ, Smullen LA, Bedard DL. Comprehensive, quantitative, congener-specific analyses of eight aroclors and complete PCB congener assignments on DB-1 capillary GC columns. Chemosphere. 1996;33:603–623. [Google Scholar]
- (37).Zhao H, Adamcakova-Dodd A, Hu D, Hornbuckle KC, Just CL, Robertson LW, Thorne PS, Lehmler H-J. Development of a Synthetic PCB Mixture Resembling the Average Polychlorinated Biphenyl Profile in Chicago Air. Environment International. doi: 10.1016/j.envint.2009.03.003. In Press. [DOI] [PMC free article] [PubMed] [Google Scholar]
- (38).Jamshidi A, Hunter S, Hazrati S, Harrad S. Concentrations and chiral signatures of polychlorinated biphenyls in outdoor and indoor air and soil in a major UK conurbation. Environ Sci Technol. 2007;41:2153–2158. doi: 10.1021/es062218c. [DOI] [PubMed] [Google Scholar]
- (39).Van den Berg M, Birnbaum LS, Denison M, De Vito M, Farland W, Feeley M, Fiedler H, Hakansson H, Hanberg A, Haws L, Rose M, Safe S, Schrenk D, Tohyama C, Tritscher A, Tuomisto J, Tysklind M, Walker N, Peterson RE. The 2005 World Health Organization reevaluation of human and mammalian toxic equivalency factors for dioxins and dioxin-like compounds. Toxicol Sci. 2006;93:223–241. doi: 10.1093/toxsci/kfl055. [DOI] [PMC free article] [PubMed] [Google Scholar]
- (40).Rushneck DR, Beliveau A, Fowler B, Hamilton C, Hoover D, Kaye K, Berg M, Smith T, Telliard WA, Roman H, Ruder E, Ryan L. Concentrations of dioxin-like PCB congeners in unweathered Aroclors by HRGC/HRMS using EPA method 1668A. Chemosphere. 2004;54:79–87. doi: 10.1016/S0045-6535(03)00664-7. [DOI] [PubMed] [Google Scholar]
Associated Data
This section collects any data citations, data availability statements, or supplementary materials included in this article.


