Abstract
We describe methods to achieve high sensitivity in voltage-sensitive dye (VSD) imaging from rat barrel and visual cortices in vivo with the use of a blue dye RH1691 and a high dynamic range imaging device (photodiode array). With an improved staining protocol and an off-line procedure to remove pulsation artifact, the sensitivity of VSD recording is comparable to that of local field potential recording from the same location. With this sensitivity, one can record from ~500 individual detectors, each covering an area of cortical tissue 160 μm in diameter (total imaging field ~4 mm in diameter) and a temporal resolution of 1,600 frames/s, without multiple-trial averaging. We can record 80 to 100 trials of intermittent 10 s trials from each imaging field before the VSD signal reduces to one half of its initial amplitude due to bleaching and wash-out. Taken together, the methods described in this report provide a useful tool for visualizing evoked and spontaneous waves from rodent cortex.
Keywords: voltage-sensitive dye, blue dye, optical imaging, propagating waves, rat sensory cortex
Introduction
Voltage-sensitive dye (VSD) imaging, an optical method of measuring transmembrane potential, has developed into a powerful tool for studying brain activity since pioneering work was published over 30 years ago (Cohen et al. 1968; Tasaki et al. 1968). VSD molecules bind to the membranes of excitable cells and report changes in membrane potential by shifting their absorbance or fluorescence spectra. While the optical signal of VSD has excellent linearity with membrane potential (within a range of approximately ± 300 mV) and very fast response time (<1 μs) (Ross et al. 1977), the optical signal is small. Fractional changes in absorption or fluorescence are only about 10-5 to 10-2 of the resting absorption/fluorescence intensity per 100 mV of membrane potential change. In biological experiments, such small signals are quite vulnerable to noise and artifacts. For imaging in vitro preparations such as brain slices and cultured cells, noise and artifact can be controlled well and the sensitivity of VSD imaging rivals that of local field potential recordings (Jin et al. 2002). In contrast, imaging the mammalian cortex in vivo is more difficult because hemoglobin absorbance causes a large pulsation artifact. This artifact can sometimes exceed evoked cortical signals by an order of magnitude (London et al. 1989; Shoham et al. 1999; Grinvald and Hildesheim 2004; Ma et al. 2004).
New ‘blue’ dyes, developed by Amiram Grinvald's group (Shoham et al. 1999), have brought a great advance for in vivo imaging of mammalian cortex. The excitation wavelength of blue dyes has minimal overlap with the absorption of hemoglobin, and hence has minimal pulsation artifact (Shoham et al. 1999). While research reports using blue dyes have been published in recent years, (Slovin et al. 2002; Petersen et al. 2003a; Petersen et al. 2003b; Ferezou et al. 2006), many technical issues have not been examined. These include methods for reaching a high sensitivity, optimum staining, the reduction of residual pulsation artifact, limitations in recording time due to bleaching and photo-toxicity. In the present report, we demonstrate methods to achieve high signal-to-noise ratio recordings using voltage sensitive dye, with sensitivity as good as that of local field potential recording. This sensitivity allows for recording of spontaneous and evoked activity in single trials without spatial or temporal averaging. We will also discuss methodological issues such as elimination of residual pulsation artifacts, the total possible duration of optical recording experiments, and how deep in the cortex the dye can reach, when stained transdurally.
Methods
Surgery
Sprague Dawley and Long Evans rats (250 – 400 g) were used in the experiments. Surgical procedures were approved by Georgetown University Animal Care and Use Committee following NIH guidelines.
Animals were pretreated with atropine sulfate (40 μg/kg IP) approximately 30 min prior to anesthetic induction in order to reduce mucus secretion. The animals were induced with 2 - 3% isoflurane in air, and tracheostomy was performed. A 16G over-the-needle catheter was then inserted into the trachea, and animals were ventilated by a small animal respirator (Harvard Apparatus) with isoflurane in room air. Respiration rate (60 -100 /min) and volume (2 - 4 ml) were adjusted such that inspiratory pressure was approximately 5 cmH2O and the end-tidal carbon dioxide (ETCO2) was maintained at approximately 26-28 mmHg, with a calibrating multigas monitor (BCI 9100). Next, the animal was placed in a stereotaxic frame with a regulated heating pad. As soon as the animal was secure, isoflurane was reduced to 1.5 – 2% for surgery and during recordings unless specified otherwise. In some experiments, the anesthesia level was lowered and xylazine was used to augment the level of anesthesia. The animals were closely monitored to ensure sufficient anesthetic plane, using heartbeat response to tail-pinch. As the depth of isoflurane anesthesia is sensitive to hypothermia (Regan and Eger 1967), care was taken to ensure normothermia throughout recording. Lactated Ringer solution was periodically infused (approx. 2.5 ml/kg/hr SQ) in order to compensate for urination and insensitive fluid loss, and bland ophthalmic ointment was applied periodically to the eyes to prevent corneal desiccation.
The cranial surface was cleaned thoroughly of soft tissue, and a thin layer of surgical adhesive (Vetbond, 3M) was applied in order to prevent dye leakage during staining (next section). Next, a cranial window (~5 mm in diameter) was drilled on the left hemisphere over visual cortex (bregma -4 to -9 mm, lateral 1 to 6 mm) or barrel field (bregma -0 to -5 mm and lateral 2 to 7 mm). Bone was carefully separated from the dura, which was left intact. Leaving dura intact significantly reduces the movement artifact during optical recording (London et al. 1989). Care was taken to avoid irritation of the cortex by heat or pressure during this procedure. The drill tip was immersed in artificial cerebrospinal fluid (ACSF) during drilling, in order to diffuse heat from the drilling. Nontraumatic craniotomy was found to be important for better staining. Irritated brain can appear reddish (due to increased blood flow), or CSF pressure can increase the potential subdural space, which leads to poor staining. In some experiments, dexamethasone sulfate (1 mg/kg IP) was given 24 hrs prior to the experiment, to reduce inflammatory response of the dura.
Staining
Voltage-sensitive dye RH 1691 (Optical Imaging) was dissolved at 2 mg/ml in artificial CSF solution, and staining was done through the intact dura mater.
In order to increase the dural permeability to the dye, we dried the dura before staining. The surface of the dura mater was washed with artificial CSF, after which the fluid was removed thoroughly by suction. The dura mater was allowed to dry completely for 3 - 4 min, with gentle air flow, until the tissue became very transparent and “glassy.” This “glassy” appearance is essential for good staining. Occasionally, longer drying (up to 15 min) was required. The drying procedure did not alter local field potential profiles of the cortex.
A temporary staining chamber was constructed around the craniotomy with a thin layer of silicone valve grease. We used approximately 200 μl of dye solution (approx. 2 mg/ml of RH 1691) to stain an area 5 mm in diameter. During staining, the dye solution was continuously circulated by a custom-made perfusion pump (London et al. 1989). The pump had a battery-powered gear motor which gently pressed the rubber nipple of a Pasteur pipette once every few seconds. The tip of this pipette was placed in the staining solution and performed a gentle, back-and-forth circulation of a small amount of dye (~100 μl). Such circulation was necessary because CSF slowly exudes from the dura and dilutes the dye concentration locally at the dye/dura interface. Staining lasted for 90 min, followed by washing with dye-free ACSF for >15 min.
Physical stabilization of the cortex
By leaving dura mater intact, we have greatly increased the physical stability of the brain, and a sealed chamber was not necessary. In some preparations, we applied high viscosity silicon oil (60,000 centistokes, Sigma DMPS-60M) on top of the dura to further dampen cortical pulsation. This silicon oil was replaced every 30 min - 1 hr, since exuded CSF would accumulate underneath and hinder the dampening effect.
Firm fixation within the stereotaxic frame and maintenance of proper body posture, hydration, and ETCO2 can minimize the movement of the skull due to heartbeat and respiration. In some experiments, we paralyzed the animal with pancuronium bromide (1 mg/kg IM) and paused ventilation during optical recording in order to completely eliminate the respiratory movement. When ventilation was paused during recording, longer intertrial intervals (1 - 2 min) were given.
Imaging apparatus
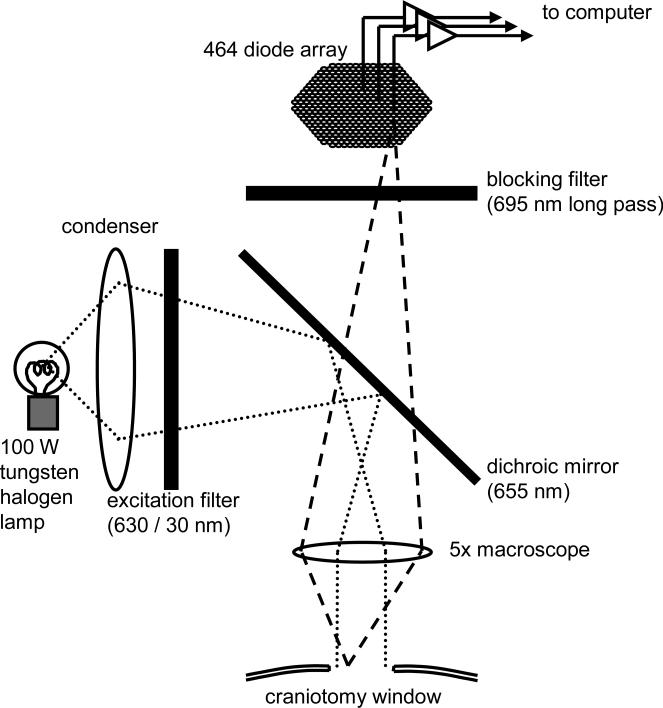
The cortex was imaged by a 5x macroscope with a field of view about 4 mm in diameter (Figure 1), following the designs of Kleinfeld (Kleinfeld and Delaney 1996) and Cohen (Prechtl et al. 1997). The macroscope was assembled from commercial video camera lens (Navitar, 25 mm F0.95) and provides high numerical aperture to effectively collect fluorescent emission from the cortex. The macroscope has a numerical aperture of 0.45, which gathers about 100 times more light than an ordinary 4x microscope objective.
Figure 1. Schematic drawing of the recording apparatus.
Light from the tungsten lamp was filtered with a 630 ± 15 nm band pass filter and reflected via a 655 nm dichroic mirror for illumination. The filament of the lamp is focused onto the back focal plane of the macroscope, to achieve Köhler illumination. Fluorescent light from the cortex is collected with the macroscope, passed through the 695 nm long-pass filter, and forms a real image onto the aperture of the diode array. The field of view on the cortex is approximately 4 mm in diameter. The numerical aperture of the macroscope is about 0.45, with optical magnification of 5X and working distance approximately 20 mm.
A halogen tungsten filament lamp (12 V, 100 W, Zeiss) was used for illumination. This low-cost lamp is a standard component for upright microscopes, and offers stable light with low noise. The light was filtered with a 630 ± 15 nm interference filter (Chroma Technology) and then reflected down onto the cortex via a 655 nm dichroic mirror (Chroma Technology). Köhler illumination was achieved through the macroscope (Figure 1).
The fluorescence of the dye (~700 nm, Optical Imaging) from the stained cortex was collected via the macroscope, filtered through a 695 nm long pass filter (RG-695, Edmund Scientific) and projected onto the fiber optic aperture of a 464-channel photodiode array (WuTech Instruments). Each channel (detector) of the array received light from a cortical area of approximately 160 μm in diameter. The photocurrent from each channel was individually amplified through a two-stage amplifier (Wu and Cohen 1993). The first stage was an I-V converter of 50 V/μA (50 M ohm trans-impedance). The fluorescent resting light intensity (RLI) of the stained cortex was about 1 V (20 nA of photo current) at the output of the I-V converter. The output of the I-V converter was high-pass filtered at 0.1 or 1.4 Hz to remove the DC component of the light or resting florescent light (RLI). The signal was then fed into the second amplifier and amplified 500 times. The second stage amplifier only amplifies the differential component of the light, and is therefore not saturated by the large RLI. An optical signal of typical sensory-evoked cortical activity was about 10-3 of the RLI or about 500 mV (peak to peak) at the output of the second stage amplifier. This signal was low-pass filtered at 400 Hz and then digitized at 1.6 kHz by an A/D converter card (MicroStar DAP-4000) on a PC. Because the RLI is subtracted before the second stage amplifier, the full 12 bit range of the A/D converter is available to digitize the optical signal. The effective dynamic range can thus reach approximately 19 bits (see discussion). The apparatus was mounted on a high-performance isolation stage (Minus K Technology) in order to remove floor vibrations.
Stimuli
For visual stimulation, we used a flash from a white LED, positioned in front of the contralateral eye. The stimulus lasted for 10 ms and covered about 40° of the visual field of the animal. The light path was shielded in order to avoid contamination of the stimulation light into the optical recordings. For whisker stimulation, we used a 200 ms ramp-and-hold deflection in the anterior direction. The stimulator consisted of a galvanometer with a small loop on the needle tip, holding the whisker at 10 mm from the base, and provided rapid deflections of 3 mm (~15°).
Local field potential recording
Electrodes were placed on the edge of the optical recording field to record the epidural local field potential. Figure 2 uses a tungsten microelectrode, Figure 4 uses a silver ball electrode. The signal was amplified 1000 times using a custom-made amplifier with frequency range of 1 Hz to 100 Hz. Local field potential was digitized concurrently with optical channels, along with ECG and driving voltage of the stimuli. The ECG was used to remove pulsation artifacts offline (see below).
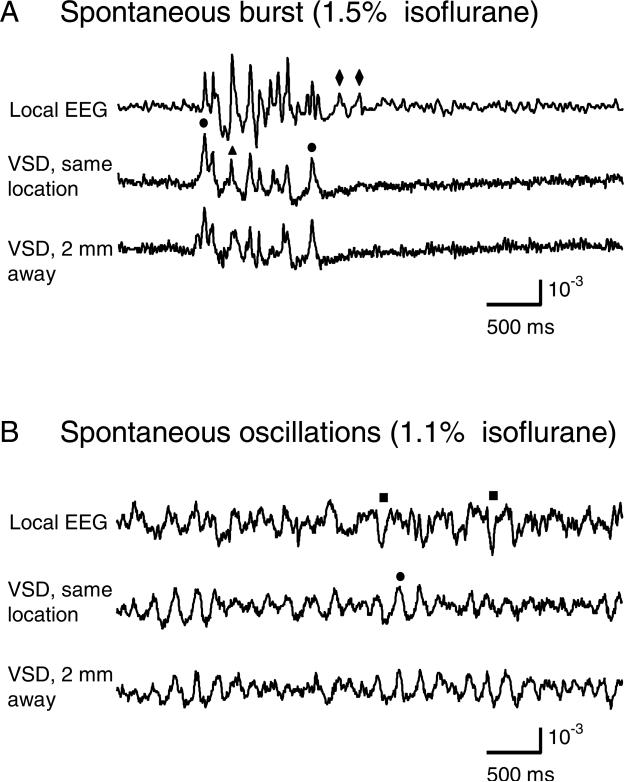
Figure 2. Sensitivity of VSD recordings.
The top two traces in each panel are local field potential and VSD recordings from the same location in the visual cortex. Another VSD recording (bottom trace in each panel) was 2 mm away from this location. A. Under 1.5% isoflurane, there are spontaneous spindle-like bursts. Dots mark events in which VSD has higher amplitude than local field potential. Triangles mark events in which local field potential has higher amplitude than VSD. Diamonds mark events seen in local field potential but not in VSD. B. Recordings from the same animal as in A, about 5 min later, with isoflurane anesthesia lowered to 1.1%. Most of the peaks in local field potential are also seen in VSD, but the correlation between the two signals is lower. The baseline fluctuations cannot be attributed to noise, since the analogous recordings had much less fluctuation when anesthesia was elevated (A).
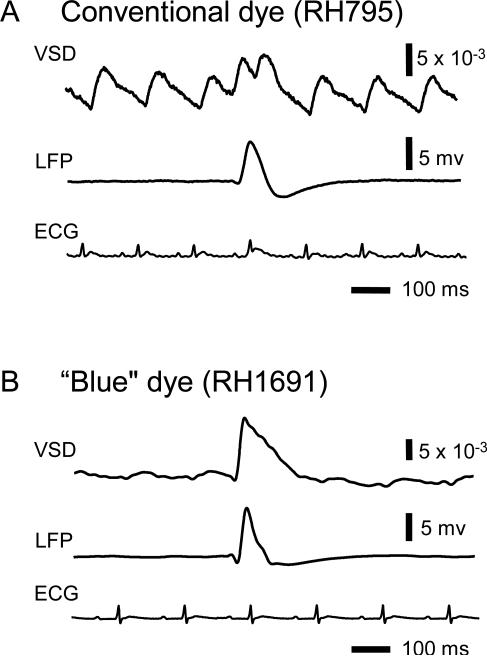
Figure 4. Comparison of RH795 and RH1691.
Recordings from two separate animals stained with RH795 and RH1691 (A and B, respectively). Epileptiform spikes induced by bicuculline had large signals in both VSD and local field potential recordings (top and middle traces on each panel). Pulsation artifact was time locked to the electrocardiogram (ECG, bottom traces on each panel). VSD signal from RH795-stained cortex had large pulsation artifact, comparable in amplitude to the epileptiform spike (A), while the artifact was much smaller in the VSD signal from RH1691-stained cortex.
Subtraction of brain pulsation artifact
While the blue dyes have greatly reduced the artifact due to hemoglobin absorption (Shoham et al. 1999), movement artifact from brain pulsation is still a major contributor to recording noise. Since pulsation artifact is time locked to the ECG, it can be largely subtracted from each individual trial in order to observe single trials of VSD activity (Arieli et al. 1995). We used an offline algorithm for this subtraction based on previous methods from our lab (Ma et al. 2004). In this subtraction algorithm, the peak of QRS waves was obtained from the ECG recorded simultaneously with the imaging trial. An average QRS interval was obtained for each trial, and ECG-triggered averages for each optical detector were obtained spanning three average QRS intervals, 1.5 intervals before the peak and 1.5 intervals after. This “averaged pulsation artifact” was repeatedly concatenated in synchrony with each QRS peak, to reconstruct an average trace for each detector. Since the QRS interval varies subtly from heartbeat to heartbeat, simply concatenating the average waveform would produce small jumps at the point of each concatenation. In order to eliminate such jumps, the concatenation was done with a linear-weighted transition—at QRS peak number n, the averaged waveform aligned to peak n was weighted 100%; midway between QRS peak number n and n+1, the waveform aligned to peak n and n+1 were weighted at 50% each; at QRS peak number n+1, the waveform aligned to peak n+1 is weighted 100%. The resulting concatenated average pulsation artifact for each optical detector was subtracted from the raw data for that detector (Figure 5). The subtracted signals were analyzed with a fast Fourier transform, and show virtually no energy peak at the heartbeat frequency. Matlab code for the procedure is available upon request.
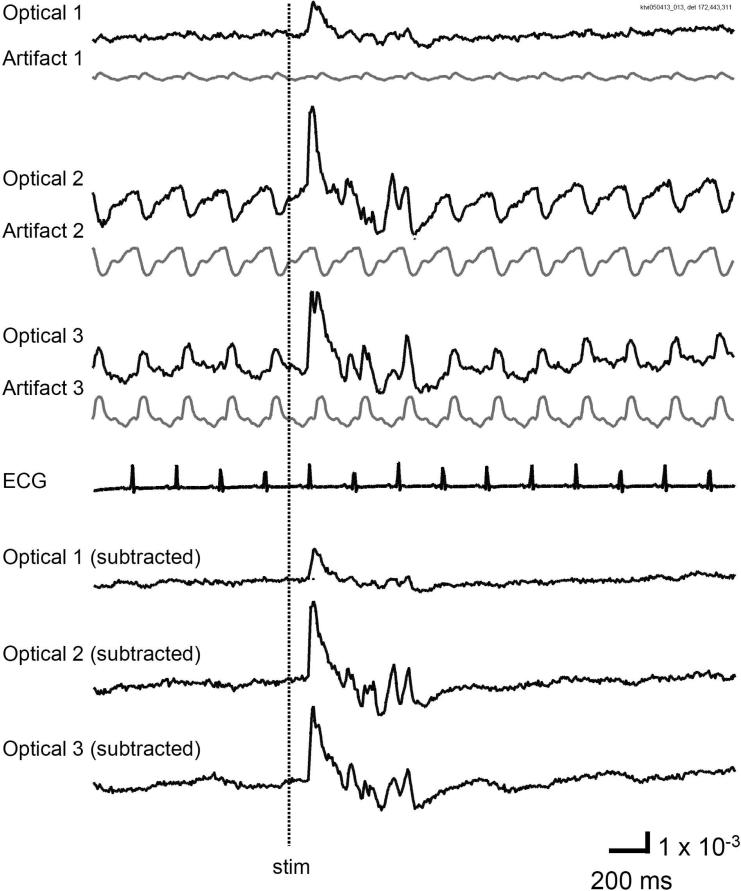
Figure 5. Pulsation artifact of RH1691.
VSD signals from three locations of visual cortex are shown (Optical 1-3, black traces on the top). Visually evoked cortical activity was seen at all three locations when the contralateral eye was stimulated by a light flash (stim). The gray trace under each raw black trace is the pulsation artifact, reconstructed with an ECG triggered averaging procedure (see text). Note that in one location (Optical 1), there was virtually no pulsation artifact. The pulsation artifact is time-locked to the ECG and contains virtually no components from the recorded activity. After subtraction, the signals from the three locations had similar waveform and contained almost no artifact (bottom three traces).
Data analysis
Data were processed in Neuroplex (RedShirt Imaging), Matlab (Mathworks) and Mathematica (Wolfram Research). Scripts are available upon request. Pseudocolor movies were generated such that each detector was individually scaled to a linear color scale (Grinvald et al. 1982; Jin et al. 2002).
Results
Sensitivity of VSD recordings
With our methods to eliminate pulsation artifact, the sensitivity of VSD recording was comparable to that of local field potential recordings (Figure 2). In this experiment, we recorded cortical activity by VSD imaging and local field potential simultaneously from the same tissue. Comparing the two signals, we found most of the peaks in the local field potential showed a corresponding event in the VSD trace. Under 1.5% isoflurane anesthesia, infrequent bursts of spontaneous activity occurred on both electrical and optical recordings and most events within each burst correlated well between local field potential and VSD signals (Figure 2A). However, local field potential and VSD signals were frequently disproportionate in amplitude. In Figure 2A, events labeled with dots had higher amplitude in VSD trace compared to that in the local field potential trace, while events labeled with triangles had larger amplitude in the local field potential trace compared to that in the VSD trace. Events labeled with diamonds were seen in the local field potential but not in the VSD signals. Adjusting the level of anesthesia allows us to further verify the correlation between local field potential and the VSD signals. When the level of anesthesia was lowered, both VSD and local field potential signals show continuous spontaneous fluctuations (Figure 2B). The fluctuations in the VSD signals are unlikely to be baseline noise, since the baseline noise is much smaller in the quiescent segments of Figure 2A, which were obtained from the same location in the same animal. Instead, these fluctuations are likely to be biological signals from local cortical activity, probably sleep-like oscillations or up/down states (Petersen et al. 2003b). While the correlation between the local field potential and VSD recordings decreased, many events in local field potential were also seen in the VSD traces (exceptions are marked with squares in Figure 2B). VSD recordings made from two adjacent locations also show good correlation (bottom two traces in each panel of Figure 2), further indicating that the fluctuations on the VSD traces were not noise. Since almost every event in the local field potential can be seen in the VSD recordings, the sensitivity of the VSD measurement is comparable to that of local field potential recordings. However, VSD and local field potential signals have a low overall correlation of ~0.2 between 3 to 30 Hz (which includes 90% of the power). This low overall correlation is probably because some local field potential peaks originated from deep cortical layers or subcortical sources.
The correlation between optical traces is much higher and each peak in the signal appears at many locations (Figure 2 A, B, bottom traces). This high correlation between optical traces is not from light scattering or optical blurring between channels, because there is a small timing difference between locations, resulting globally in a propagating wave. The spatiotemporal pattern of the waves will be further discussed in later sections.
Staining and the source of the VSD signal
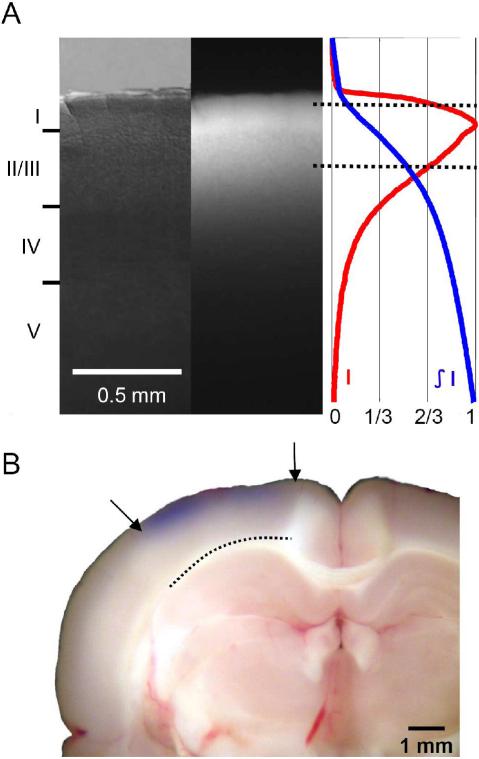
Cortex was stained well after 90 min of staining with RH1691 through the dura mater (Figure 3A). We sliced the cortex after staining and found that the fluorescence of the dye reached a depth of 500 μm from the cortical surface (Figure. 3A). The fluorescence intensity (Fig. 3A, right) shows that most of the dye fluorescence originates from layer I and II/III; these layers contain approximately 70% of the fluorescence signal. The highest intensity is in layer I, which contributes approximately 30% to the overall fluorescence. This dye distribution in cortical tissue is similar to that stained with dura removed in rat (Kleinfeld and Delaney 1996; Petersen et al. 2003a) and mice (Ferezou et al. 2006). The distribution of the fluorescence intensity indicates that the VSD signals mostly originate from the layer I - III. In addition, since illumination intensity will decrease with depth while scattering/reabsorption of the dye fluorescence will increase with depth, activity in layer IV and deeper layers have little contribution to the signal. Therefore, the VSD signal described here is most likely a combination of synaptic and spiking activity in layer I to II/III. Since the fluorescence of RH1691 is in the near infrared range, visual evaluation from the dural/cortical surface may not reveal the quality of staining. When cortex was visually inspected under room light, only a light blue hue was seen in the tissue (Figure 3B). However, even with this light visual appearance (as shown in Figure 3), the stained cortex yields excellent optical signals during imaging (Figures 4, 5, 7, 8).
Figure 3. Staining depth.
A. Left, Visible light image of the stained cortex. Middle, fluorescence image from the same cortical section showing distribution of RH1691 staining. Right, fluorescence intensity (red) and integrated fluorescence intensity (blue). Broken lines mark the tissue depth with fluorescent intensity higher than 2/3 of the maximum intensity. B. Photograph of a stained cortical section. Arrows indicate boundary of the cranial window. Broken line indicates the border between gray and white matter. Staining of RH1691 can be seen by eye as a light blue hue.
Figure 7. Sensory evoked response.
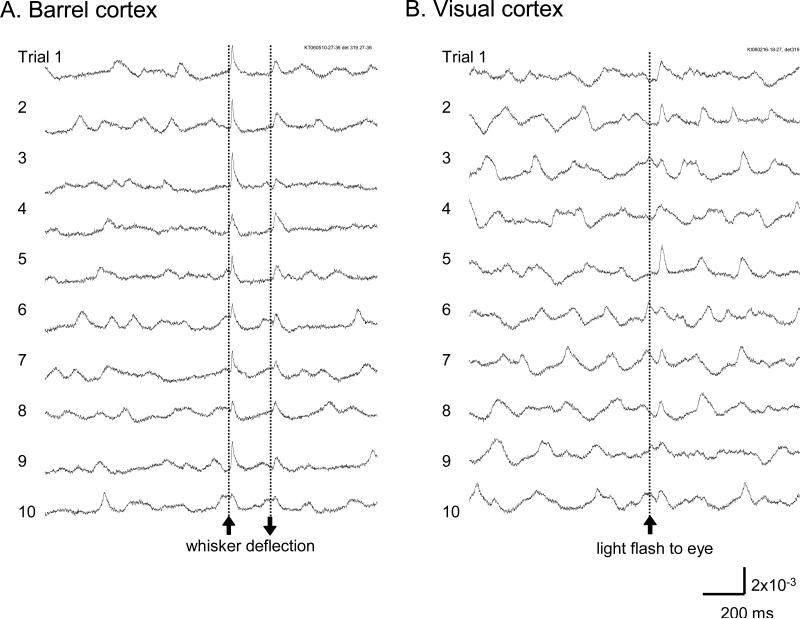
A. Signal from a single detector viewing a cortical area of 160 μm in diameter near the principal barrel in the barrel cortex. Ten trials are displayed from 105 trials with identical whisker stimuli. B. Signal from a single detector viewing a cortical area of 160 μm in diameter in the V1 area. Ten trials are displayed from ~30 trials recorded with identical light stimuli, to the contralateral eye.
Fig. 8. Propagating waves in barrel and visual cortices.
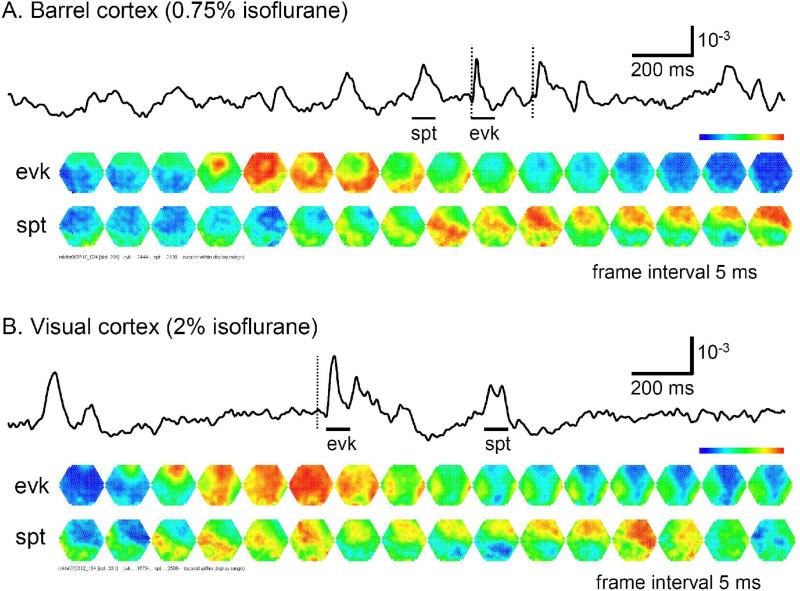
The top traces in panels A and B are signals from a single detector in the recording field. Bars under each trace mark the time of a spontaneous event (spt) and an evoked response (evk) during the recording trial. The vertical broken lines mark the time of stimulation. The bottom images in each panel are frames showing the spatiotemporal patterns of the evoked (top row) and spontaneous events (bottom row). The imaging field is ~4 mm in diameter. Each image is a 0.625 ms snap shot, with every 8th frame displayed (5 ms frame intervals). The bars under the top trace mark the duration of the images. A. In barrel cortex, the evoked response started from the principal barrel and spread as a propagating wave to the entire imaging field within 15 ms. The spontaneous event started from the bottom of the field and propagated as a slow wave across the field. B. In visual cortex, the sensory evoked wave is slower than that in the barrel cortex. Note that the spontaneous wave in visual cortex was initiated from the bottom of the field, propagated upward and reflected near the top to propagate downward.
Comparison of RH 1691 and RH795
The pulsation artifact of RH1691 was very small compared to that of RH795 (Figure 4, Shoham et al. 1999). In this comparison, we used spontaneous epileptiform spikes as the source of VSD signal. Applying bicuculline methiodide to the cortex induces spontaneous epileptiform spikes at a frequency of 1 spike/sec (Gutnick et al. 1982). The spikes provide a large VSD signal (~10-2 of resting fluorescent intensity) and the signal is relatively stable from trial-to-trial and from animal-to animal (Ma et al. 2004). We stained with each dye in independent experiments and found both RH1691 and RH795 had similar signal amplitude of epileptiform spikes (Figure 4). However, the pulsation artifact of RH1691 was much smaller. The amplitude of the pulsation artifact in RH795 was similar to that of the epileptiform spikes, while the artifact of RH1691 was only about 1/7 of the signal amplitude. This comparison demonstrates a great potential for in vivo imaging using the new blue dyes, as shown in recent reports (Shoham et al. 1999; Spors and Grinvald 2002; Derdikman et al. 2003; Petersen et al. 2003a; Petersen et al. 2003b; Grinvald and Hildesheim 2004; Ferezou et al. 2006).
Removal of residual pulsation artifact
In our experiments, we frequently observe large VSD signals with negligible pulsation artifact (e.g., Figure 5, Optical 1). However, residual pulsation artifact can still be large compared to small signals such as spontaneous and sensory evoked cortical activity. Figure 5 compares residual pulsation artifact at various locations within the visual cortex. At some locations, the pulsation artifact was almost absent (Figure 5, Optical 1). Other locations had pulsation artifact of varying waveform and polarities (Figure 5 Optical 2, 3). These traces suggest that the artifact is mainly contributed by movement due to pulsation, because movement artifact can have either polarity at various locations while the polarity of hemoglobin absorption should be consistent at all cortical locations.
In order to remove residual pulsation artifact, an off-line subtraction procedure is necessary. The procedure can effectively remove artifact which is time locked with the ECG, regardless of polarity and waveform (Figure 5). There were about ~50 heartbeats in each 10 second recording trial; therefore, in the averaged artifact trace (see methods), signal and noise components which are not correlated to the heartbeat were reduced to ~1/50 of their original amplitude, and ~98% of the artifact can be removed (bottom traces in Figure 5).
Total recording time
In brain slices, the recording time of VSD imaging is mainly limited only by dye bleaching (Momose-Sato et al. 1999; Jin et al. 2002). Using absorption dyes in brain slices, the total optical recording time is about ~1800 s before the VSD signal declines to the half of the initial amplitude (Jin et al. 2002). Under in vivo conditions, other factors such as washing out of the dye by blood circulation may also reduce the total recording time. Therefore, the total recording time must be determined empirically.
To determine the feasible total recording time, we have measured the decrease of VSD signal (RH1691) under an illumination intensity of ~1.5 × 10¹¹ photo-electrons/mm2 ms (at this intensity, the sensitivity of VSD imaging is comparable to that of local field potential recordings). We used spontaneous epileptiform spikes induced by bicuculline methiodide as the source of VSD signal. Epileptiform spikes provide a large VSD signal (~10-2) and the signal is relatively stable from trial-to-trial and from animal-to animal (Ma et al. 2004). The cortex was illuminated intermittently, with 20 s of light exposure each minute. The amplitude of the VSD signal was plotted along with exposure time in Figure 6.
Figure 6. Total recording time.
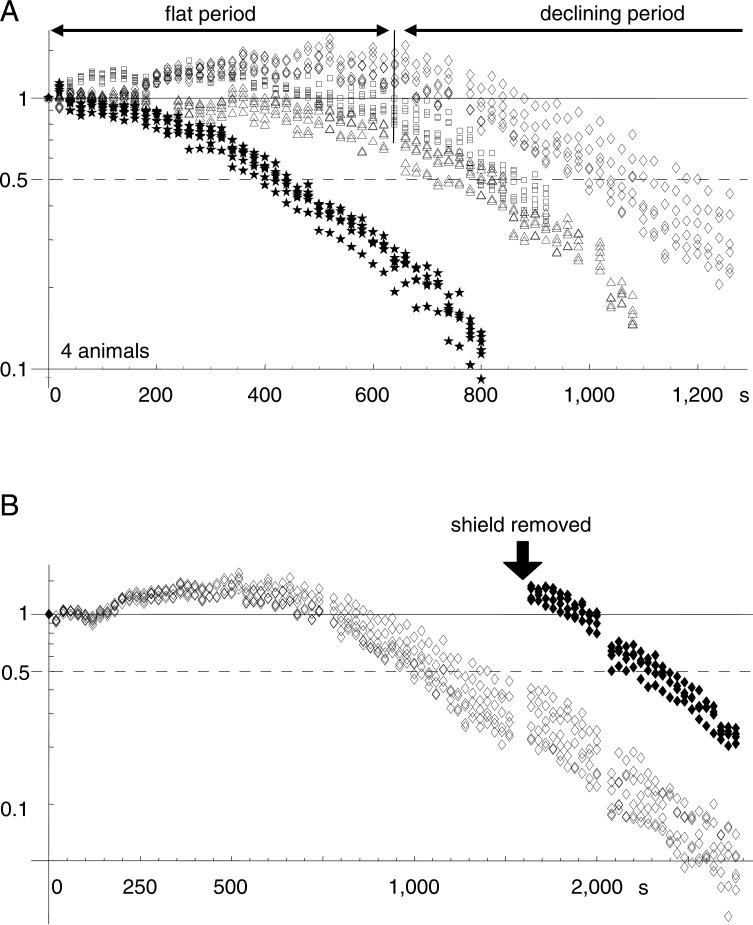
A. Amplitude of VSD signal (bicuculline induced spikes) is plotted against light exposure time. Data from four animals were normalized to the amplitude of the first recording trial. In three animals (diamonds, triangles, squares), the signal amplitude remained stable (or slightly increased) for a period (flat period). After the flat period, the signal had a higher rate of decline with light exposure (declining period). Note that one animal did not have optimum staining, and the stable time was much shorter (stars). B. Data from another animal, in which part of the cortex was shielded from light exposure. In the shielded area, the signal amplitude remained unchanged (solid diamonds), while signal in unshielded area declined (empty diamonds), suggesting that the signal decline was related to light exposure. The shielded area did not have a flat period after the shielding was removed, suggesting that the flat period may be related to dye wash-out.
Decay of VSD signal did not follow a simple exponential process. Instead, a flat period followed by a declining period was observed. The flat period lasted for 300 to 800 s of light exposure (Figure 6A). During this period, no apparent decay in the signals was seen, while in some areas the signal amplitude actually increased. Following the flat period, the amplitude of the signal had a steady declining (Figure 6A). The length of the flat period varies from animal to animal. In one (out of four) animals, the staining was less optimal and the flat period was much shorter (stars in Figure 6A), suggesting that the flat period is related to the wash-out of the dye from the stained tissue. Since the boundary between flat and declining periods was not clearly distinguishable, we use the “half-time”, i.e., the duration of exposure for the signal to reduce to 50% of its beginning amplitude, as the total recording time. In three animals with good staining, the total recording time was 800 - 1,000 s. This time should allow for 80 to 100 recording trials of 10 s each, which is sufficient for most experiments.
To further distinguish dye wash-out from light-related amplitude reduction, we shielded part of the cortex from light during a light exposure experiment (Figure 6B). After the signal in the exposed area transitioned to the declining period, the shield was removed. Signal from the previously shielded area had similar amplitude as that in the flat period. (Figure 6B, solid dots). However, the signal in the shielded area did not show a flat period, instead, the signal declined at a similar rate as the unshielded regions. This suggests that the flat period was related to the dye wash-out, which only occurred within a certain period after the staining.
Our data indicates that one can collect 800 - 1000 s of data before the VSD signal reduced to one half of the initial amplitude. This estimated time was shorter than previous reports (Shoham et al. 1999), probably because we use higher illumination intensity for higher sensitivity (Figure 7).
Sensory evoked activity
We were able to reliably detect sensory evoked cortical activity in single trials. Signals in Figure 7 were recorded from individual detectors (160 μm in diameter) in single trials, demonstrating the ability to achieve a high spatiotemporal resolution. The evoked activity had lower amplitude when evoked at certain phases of spontaneous activity (Figure 7A, traces 8, 10; B, traces 3, 6). Variations in evoked cortical activity also occurred in spatial pattern (discussed below).
Propagating waves
Both spontaneous and evoked cortical activity manifested as propagating waves (Figure 8). Sensory evoked waves followed a consistent propagation pattern, initiating from the location of the thalamic afferents and spreading to large areas of the cortex. In barrel cortex, the whisker evoked waves initiated from within the corresponding barrel and propagated to the entire barrel cortex (Figure 8A, top row images), with an overall velocity of 0.2 ± 0.1 m/sec, (n= 6 animals). In visual cortex, flash evoked waves started from V1 and propagated to other visual areas (Figure 8B, top row images). Visually evoked waves had a similar overall velocity as those in the barrel cortex. Spontaneous events originated from various locations and propagated with larger variations in direction and velocity (Figure 8A and B, bottom rows of images). The spontaneous event in Figure 8B appears as two waves, one propagating from the bottom left to upper right and followed immediately by another wave in the opposite direction. The spontaneous and evoked waves we have observed are consistent with reports from other groups (Derdikman et al. 2003; Petersen et al. 2003b).
Trial-to-trial variations
Obtaining data with high signal-to-noise ratio, from hundreds of trials from each animal, allows us to examine trial-to-trial variations of cortical activity evoked by identical sensory stimuli. Large trial-to-trial variations were observed in both visual and barrel cortex (Figure 7). In the barrel cortex, the evoked wave started from the correspondent whisker barrel in all trials, and propagated to the entire barrel field. However, individual trials showed large trial-to-trial variations in signal amplitude (Figure 7) and propagation pattern (Figure 9).
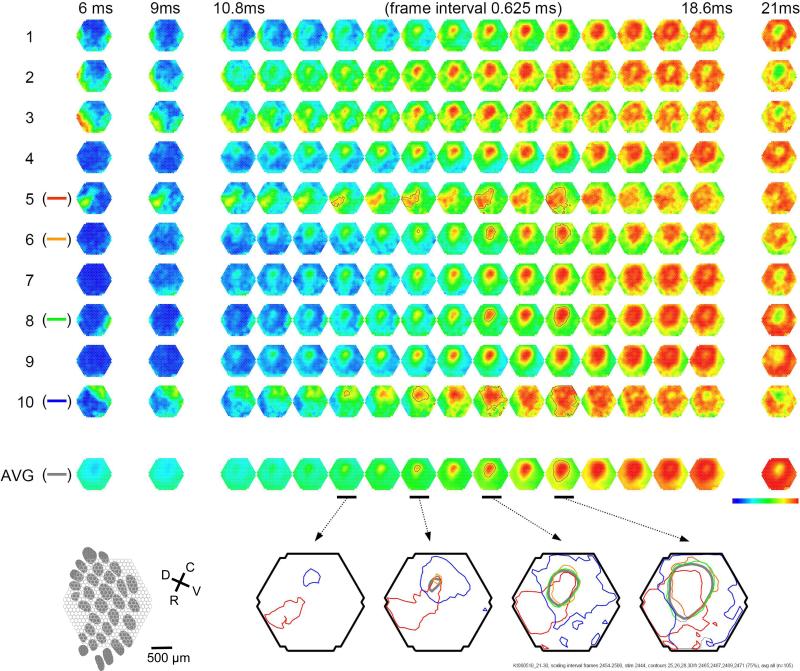
Fig. 9. Trial-to-trial variations in barrel cortex.
Image rows 1-10: Ten consecutive trials with identical whisker deflection. The bottom images (AVG) are averaged from 105 trials from the same animal. Bottom row left: schematic diagram of the barrel pattern and the imaging field. Bottom row right: Isochromatic contour lines were superimposed from trials 5 (red), 6 (orange), 8 (green) and 10 (blue), along with contour lines from the averaged data (gray).
Trial-to-trial variations in propagation pattern manifest as anisotropy of propagating pattern and velocity (Figure 9). In Figure 9, the propagation pattern of individual trials was compared with that of the multiple trial average. While all trials show a similar overall spatiotemporal pattern, significant trial-to-trial variations can be seen in individual trials: The onset times for trials 2, 3 and 10 are shorter than the average, while in trials 1 and 8, the onset times are longer. In the bottom row of Figure 9, the contour lines of the propagation patterns for trials 5, 6, 8, 10 are superimposed, in order to compare them with the contours of the average pattern. The contour lines are highly variable, suggesting that the propagation of an evoked wave is highly dynamic. Since spontaneous waves occurred frequently, they may interact with the evoked response and contribute to anisotropic propagation patterns. In trial 5, the evoked activity appeared to merge with a spontaneous event and propagated faster in the direction toward the spontaneous event (Figure 9).
Overall, the blue dye RH1691 exhibited an excellent signal and low pulsation artifact, allowing the use of a high dynamic range imaging device to achieve sensitivity comparable to that of local field potential recordings. Such ability provides a useful tool to examine spatiotemporal dynamics in the cortex when multi-trial averaging is not possible.
Discussion
Imaging of mammalian cortex in vivo has benefited greatly from the ‘blue’ dyes developed by the Grinvald group (Shoham et al. 1999), which provide a signal largely devoid of pulsation artifact related to hemoglobin (Figure 4, Shoham et al. 1999; Ferezou et al. 2006). Therefore the sensitivity of the VSD recording can be greatly enhanced, to the limit of shot noise—which is the quantal unevenness the light flux. Using a photodiode array can take full advantage of the blue dyes to achieve high sensitivity recordings, limited only by shot noise. The main point of this paper is to demonstrate that the sensitivity of VSD recordings under these conditions can be comparable to that of local field potential recordings (Figure 2) when photodiode arrays are used in combination with “blue” dyes.
Saturation intensity and dynamic range of the imaging device
Visualizing spatiotemporal dynamics in single trials requires higher sensitivity than mapping the active areas in the cortex. In order to visualize VSD signals of 10-4 to 10-3 of the resting fluorescent intensity (e.g., Figures 2b, 7 and 8), the imaging device needs to have high saturation intensity, i.e., a well size of 100 million photons. In addition, an effective dynamic range of 17-19 bits is needed to digitize a 10-4 signal. Ordinary CCD/CMOS cameras with a well size of 1-10 million photons and 10 - 14 bits of dynamic range will not be able to record the small signals shown in the Figures 2b, 7 and 8. Diode arrays offer an exceptional effective dynamic range by a parallel amplification design, i.e., each detector (pixel) has a dedicated two-stage amplifier (Cohen and Lesher 1986, for circuit diagram and additional information see Wu and Cohen 1993 and Jin et al. 2002.). Using the measurement of Figure 2b as an example, the resting light intensity was about 1 V at the output of the first stage. The signal, at approximately 10-3 of the resting light intensity, therefore produced a change of ~ 1 mV riding atop this resting 1 V. With a dedicated second stage amplifier for each pixel, the DC component (resting light intensity) can be easily removed by an analog circuit. After removing the DC component, the 1 mV signal is then amplified 500 times to 500 mV. This signal is digitized with an A/D converter of 12 bits at a range of ±10 V, resulting in the 500 mV signal being represented by ~8 bits. Such high dynamic range is essential for the overall sensitivity of optical recordings (Figures 2b, 7 and 8). The dark noise of the photodiode array is very small compared to shot noise (< 1/10), and therefore, instrumentation noise can be ignored. In the measurements of this report, we have achieved a signal-to-noise ratio of ~5 from each single detector (0.016 mm2, with total 464 detectors in an area of 4 mm in diameter) at 1600 frames/sec (Figure 7).
Spatiotemporal resolution
Spatial and temporal resolutions are closely linked, and limited by shot noise. Higher spatiotemporal resolution leads to lower photon flux because of the smaller volume of tissue under each detector, and because of the shorter sampling time. Lower photon flux has higher proportional shot noise and therefore lower signal-to-noise ratio. Increasing illumination intensity may further increase spatiotemporal resolution; however, phototoxicity might become a concern. While RH1691 does not show toxicity under moderate light (Slovin et al. 2002; Petersen et al. 2003a), our illumination intensity was higher than previous reports, and we did observe rapid signal decline (Figure 6). To address the concern of phototoxicity, results from later recording trials should be compared with those from the beginning of the experiment for verification.
Differences between local field potential signal and VSD signal
Figure 2 shows that VSD and local field potential recordings show good event-to-event correlation but a poor overall correlation. We speculate that the poor correlation in the waveforms was caused by the difference in origin of the two signals. The VSD signals originate from superficial cortical layers as indicated by the staining profile (Figure 3). Local field potential signals, on the other hand, derive from local current flow, and therefore, may contain volume-conducted signal from deeper cortical layers or strong subcortical sources. While quantitative analyses of the correlation between the VSD and local field potential signals are beyond the scope of this method paper, we believe that the issue may be important for understanding how subcortical input manifests in the cortex. Our data suggests a useful method for separating superficial and deep cortical components in local field potential recordings.
Visualizing propagating waves
Many cortical activities are spatiotemporally organized as propagating waves (a.k.a. “traveling waves”, Ermentrout and Kleinfeld 2001). Propagating waves have been extensively examined in cortical slices (Chervin et al. 1988; Chagnac-Amitai and Connors 1989; Tanifuji et al. 1994; Albowitz and Kuhnt 1995; Wadman and Gutnick 1993; Golomb and Amitai 1997; Demir et al. 1998; Tsau et al. 1998; Fleidervish et al. 1998; Wu et al. 1999; Wu et al. 2001; Bao and Wu 2003; Miyakawa et al. 2003; Huang et al. 2004). Since the velocity and direction of propagation are highly dynamic, the ability to record from single trials is essential for studying wave propagation. Before introduction of the blue dyes, sensory-evoked waves could only be imaged in the brain of turtle (Prechtl et al. 1997; Senseman and Robbins 1999; Senseman and Robbins 2002; Lam et al. 2000; Lam et al. 2003), salamander (Cinelli et al. 1995), and invertebrate (Delaney et al. 1994; Kleinfeld et al. 1994), where heartbeat is not present or can be paused with cooling. The pulsation artifact of red dye RH795 had an amplitude of 0.5 – 1% of resting light intensity, similar to that of epileptiform spikes induced by bicuculline (Figure 4A), and about ten times larger than the sensory evoked cortical activity (London et al. 1989). With the use of blue dyes, pulsation artifact is greatly reduced and sensory evoked waves can be seen in mammalian cortex (Derdikman et al. 2003; Petersen et al. 2003a; Petersen et al. 2003b; Ferezou et al. 2006).
Pulsation artifact
RH 1691 shows virtually no hemoglobin absorption artifact (Figures, 4 5; Shoham et al. 1999; Ferezou et al. 2006 ) but pulsating movement artifact may still be large. Imaging with dura mater intact increased stability and ECG-triggered subtraction further removed residual movement artifact time-locked to the heartbeat (Figure 5). In a 10 second recording trial there are about 50 heartbeats; therefore, signals that are not time-locked to the ECG would be distorted by less than 2%. The results are similar to other advanced mathematical methods, such as independent component analysis and advanced frequency domain analysis (Mitra and Pesaran 1999; Pesaran et al. 2005; Reidl et al. 2007).
Limitations of the method
The main limitation of VSD imaging methods is that the signals are from the superficial layers of the cortex (Figure 3). Further improvements in this regard will await newer staining methods or bioengineered VSDs. Our transdural staining and imaging is also limited in species, since carnivores and primates have thicker and less translucent dura. The Grinvald group and others have described artificial dural implants (Chen et al. 2002; Slovin et al. 2002), which may provide sufficient mechanical stability in those species to obtain a large number of stable single-trial recordings. Another limitation is that VSD recording is not a preferred way to measure DC signal. This is mainly because the DC component in VSD signal is contaminated by dye bleaching. In the process of making pseudo color maps in this report, the signals were digitally filtered above 2-3 Hz to emphasize the propagating wave front. However, our cutoff at low frequency can be as low as 0.06 Hz, which is low enough to capture all low frequency components reflected in conventional EEG signals. The third limitation to our present method is the use of anesthetized and firmly fixed animals. Elimination of motion is necessary for high sensitivity recordings. This could perhaps be alleviated by novel and humane awake fixation methods, or by optical-fiber based tether method (Ferezou et al. 2006).
In conclusion, the methods described in this report offer high signal-to-noise ratio recordings for a number of applications, such as the investigation of trial-to-trial variability of sensory evoked waves, interaction between evoked and spontaneous activity, event-related activity in higher cortical areas, the interactions between individual neurons and local population, and the complex dynamics of epileptic activity.
Acknowledgements
We are grateful to Drs. Shigeru Tanaka, Lawrence Cohen, and Amiram Grinvald for helpful comments.
Grants: This study was supported by NIH R01NS036447 to JW, and fellowships from the German National Academic Foundation to MTL and the Epilepsy Foundation to XH.
Reference List
- 1.Albowitz B, Kuhnt U. Epileptiform activity in the guinea-pig neocortical slice spreads preferentially along supragranular layers--recordings with voltage-sensitive dyes. Eur J Neurosci. 1995;7:1273–1284. doi: 10.1111/j.1460-9568.1995.tb01117.x. [DOI] [PubMed] [Google Scholar]
- 2.Arieli A, Shoham D, Hildesheim R, Grinvald A. Coherent spatiotemporal patterns of ongoing activity revealed by real-time optical imaging coupled with single-unit recording in the cat visual cortex. J Neurophysiol. 1995;73:2072–2093. doi: 10.1152/jn.1995.73.5.2072. [DOI] [PubMed] [Google Scholar]
- 3.Bao W, Wu JY. Propagating wave and irregular dynamics: spatiotemporal patterns of cholinergic theta oscillations in neocortex in vitro. J Neurophysiol. 2003;90:333–341. doi: 10.1152/jn.00715.2002. [DOI] [PMC free article] [PubMed] [Google Scholar]
- 4.Chagnac-Amitai Y, Connors BW. Horizontal spread of synchronized activity in neocortex and its control by GABA-mediated inhibition. J Neurophysiol. 1989;61:747–758. doi: 10.1152/jn.1989.61.4.747. [DOI] [PubMed] [Google Scholar]
- 5.Chen LM, Heider B, Williams GV, Healy FL, Ramsden BM, Roe AW. A chamber and artificial dura method for long-term optical imaging in the monkey. J Neurosci Methods. 2002;113:41–49. doi: 10.1016/s0165-0270(01)00475-7. [DOI] [PubMed] [Google Scholar]
- 6.Chervin RD, Pierce PA, Connors BW. Periodicity and directionality in the propagation of epileptiform discharges across neocortex. J Neurophysiol. 1988;60:1695–1713. doi: 10.1152/jn.1988.60.5.1695. [DOI] [PubMed] [Google Scholar]
- 7.Cinelli AR, Neff SR, Kauer JS. Salamander olfactory bulb neuronal activity observed by video rate, voltage-sensitive dye imaging. I. Characterization of the recording system. J Neurophysiol. 1995;73:2017–2032. doi: 10.1152/jn.1995.73.5.2017. [DOI] [PubMed] [Google Scholar]
- 8.Cohen LB, Keynes RD, Hille B. Light scattering and birefringence changes during nerve activity. Nature. 1968;218:438–441. doi: 10.1038/218438a0. [DOI] [PubMed] [Google Scholar]
- 9.Cohen LB, Lesher S. Optical monitoring of membrane potential: methods of multisite optical measurement. Soc Gen Physiol Ser. 1986;40:71–99. [PubMed] [Google Scholar]
- 10.Delaney KR, Gelperin A, Fee MS, Flores JA, Gervais R, Tank DW, Kleinfeld D. Waves and stimulus-modulated dynamics in an oscillating olfactory network. Proc Natl Acad Sci U S A. 1994;91:669–673. doi: 10.1073/pnas.91.2.669. [DOI] [PMC free article] [PubMed] [Google Scholar]
- 11.Demir R, Haberly LB, Jackson MB. Voltage imaging of epileptiform activity in slices from rat piriform cortex: onset and propagation. J Neurophysiol. 1998;80:2727–2742. doi: 10.1152/jn.1998.80.5.2727. [DOI] [PubMed] [Google Scholar]
- 12.Derdikman D, Hildesheim R, Ahissar E, Arieli A, Grinvald A. Imaging spatiotemporal dynamics of surround inhibition in the barrels somatosensory cortex. J Neurosci. 2003;23:3100–3105. doi: 10.1523/JNEUROSCI.23-08-03100.2003. [DOI] [PMC free article] [PubMed] [Google Scholar]
- 13.Ermentrout GB, Kleinfeld D. Traveling electrical waves in cortex: insights from phase dynamics and speculation on a computational role. Neuron. 2001;29:33–44. doi: 10.1016/s0896-6273(01)00178-7. [DOI] [PubMed] [Google Scholar]
- 14.Ferezou I, Bolea S, Petersen CC. Visualizing the cortical representation of whisker touch: voltage-sensitive dye imaging in freely moving mice. Neuron. 2006;50:617–629. doi: 10.1016/j.neuron.2006.03.043. [DOI] [PubMed] [Google Scholar]
- 15.Fleidervish IA, Binshtok AM, Gutnick MJ. Functionally distinct NMDA receptors mediate horizontal connectivity within layer 4 of mouse barrel cortex. Neuron. 1998;21:1055–1065. doi: 10.1016/s0896-6273(00)80623-6. [DOI] [PubMed] [Google Scholar]
- 16.Golomb D, Amitai Y. Propagating neuronal discharges in neocortical slices: computational and experimental study. J Neurophysiol. 1997;78:1199–1211. doi: 10.1152/jn.1997.78.3.1199. [DOI] [PubMed] [Google Scholar]
- 17.Grinvald A, Hildesheim R. VSDI: a new era in functional imaging of cortical dynamics. Nat Rev Neurosci. 2004;5:874–885. doi: 10.1038/nrn1536. [DOI] [PubMed] [Google Scholar]
- 18.Grinvald A, Manker A, Segal M. Visualization of the spread of electrical activity in rat hippocampal slices by voltage-sensitive optical probes. J Physiol. 1982;333:269–291. doi: 10.1113/jphysiol.1982.sp014453. [DOI] [PMC free article] [PubMed] [Google Scholar]
- 19.Gutnick MJ, Connors BW, Prince DA. Mechanisms of neocortical epileptogenesis in vitro. J Neurophysiol. 1982;48:1321–1335. doi: 10.1152/jn.1982.48.6.1321. [DOI] [PubMed] [Google Scholar]
- 20.Huang X, Troy WC, Yang Q, Ma H, Laing CR, Schiff SJ, Wu JY. Spiral waves in disinhibited mammalian neocortex. J Neurosci. 2004;24:9897–9902. doi: 10.1523/JNEUROSCI.2705-04.2004. [DOI] [PMC free article] [PubMed] [Google Scholar]
- 21.Jin W, Zhang RJ, Wu JY. Voltage-sensitive dye imaging of population neuronal activity in cortical tissue. J Neurosci Methods. 2002;115:13–27. doi: 10.1016/s0165-0270(01)00511-8. [DOI] [PubMed] [Google Scholar]
- 22.Kleinfeld D, Delaney KR. Distributed representation of vibrissa movement in the upper layers of somatosensory cortex revealed with voltage-sensitive dyes. J Comp Neurol. 1996;375:89–108. doi: 10.1002/(SICI)1096-9861(19961104)375:1<89::AID-CNE6>3.0.CO;2-K. [DOI] [PubMed] [Google Scholar]
- 23.Kleinfeld D, Delaney KR, Fee MS, Flores JA, Tank DW, Gelperin A. Dynamics of propagating waves in the olfactory network of a terrestrial mollusk: an electrical and optical study. J Neurophysiol. 1994;72:1402–1419. doi: 10.1152/jn.1994.72.3.1402. [DOI] [PubMed] [Google Scholar]
- 24.Lam YW, Cohen LB, Wachowiak M, Zochowski MR. Odors elicit three different oscillations in the turtle olfactory bulb. J Neurosci. 2000;20:749–762. doi: 10.1523/JNEUROSCI.20-02-00749.2000. [DOI] [PMC free article] [PubMed] [Google Scholar]
- 25.Lam YW, Cohen LB, Zochowski MR. Odorant specificity of three oscillations and the DC signal in the turtle olfactory bulb. Eur J Neurosci. 2003;17:436–446. doi: 10.1046/j.1460-9568.2003.02457.x. [DOI] [PubMed] [Google Scholar]
- 26.London JA, Cohen LB, Wu JY. Optical recordings of the cortical response to whisker stimulation before and after the addition of an epileptogenic agent. J Neurosci. 1989;9:2182–2190. doi: 10.1523/JNEUROSCI.09-06-02182.1989. [DOI] [PMC free article] [PubMed] [Google Scholar]
- 27.Ma HT, Wu CH, Wu JY. Initiation of spontaneous epileptiform events in the rat neocortex in vivo. J Neurophysiol. 2004;91:934–945. doi: 10.1152/jn.00274.2003. [DOI] [PMC free article] [PubMed] [Google Scholar]
- 28.Mitra PP, Pesaran B. Analysis of dynamic brain imaging data. Biophys J. 1999;76:691–708. doi: 10.1016/S0006-3495(99)77236-X. [DOI] [PMC free article] [PubMed] [Google Scholar]
- 29.Miyakawa N, Yazawa I, Sasaki S, Momose-Sato Y, Sato K. Optical analysis of acute spontaneous epileptiform discharges in the in vivo rat cerebral cortex. Neuroimage. 2003;18:622–632. doi: 10.1016/s1053-8119(02)00056-3. [DOI] [PubMed] [Google Scholar]
- 30.Momose-Sato Y, Sato K, Arai Y, Yazawa I, Mochida H, Kamino K. Evaluation of voltage-sensitive dyes for long-term recording of neural activity in the hippocampus. J Membr Biol. 1999;172:145–157. doi: 10.1007/s002329900592. [DOI] [PubMed] [Google Scholar]
- 31.Pesaran B, Sornborger AT, Nishimura N, Kleinfeld D, Mitra PP. Analysis of Dynamic Optical Imaging Data. In: Yuste R, Konnerth A, editors. Imaging in Neuroscience and Development: A Laboratory Manual. Cold Spring Harbor Laboratory Press; Cold Spring Harbor, New York: 2005. pp. 815–826. [Google Scholar]
- 32.Petersen CC, Grinvald A, Sakmann B. Spatiotemporal dynamics of sensory responses in layer 2/3 of rat barrel cortex measured in vivo by voltage-sensitive dye imaging combined with whole-cell voltage recordings and neuron reconstructions. J Neurosci. 2003a;23:1298–1309. doi: 10.1523/JNEUROSCI.23-04-01298.2003. [DOI] [PMC free article] [PubMed] [Google Scholar]
- 33.Petersen CC, Hahn TT, Mehta M, Grinvald A, Sakmann B. Interaction of sensory responses with spontaneous depolarization in layer 2/3 barrel cortex. Proc Natl Acad Sci U S A. 2003b;100:13638–13643. doi: 10.1073/pnas.2235811100. [DOI] [PMC free article] [PubMed] [Google Scholar]
- 34.Prechtl JC, Cohen LB, Pesaran B, Mitra PP, Kleinfeld D. Visual stimuli induce waves of electrical activity in turtle cortex. Proc Natl Acad Sci U S A. 1997;94:7621–7626. doi: 10.1073/pnas.94.14.7621. [DOI] [PMC free article] [PubMed] [Google Scholar]
- 35.Regan MJ, Eger EI. Effect of hypothermia in dogs on anesthetizing and apneic doses of inhalation agents. Determination of the anesthetic index (Apnea/MAC). Anesthesiology. 1967;28:689–700. doi: 10.1097/00000542-196707000-00015. [DOI] [PubMed] [Google Scholar]
- 36.Reidl J, Starke J, Omer DB, Grinvald A, Spors H. Independent component analysis of high-resolution imaging data identifies distinct functional domains. Neuroimage. 2007;34:94–108. doi: 10.1016/j.neuroimage.2006.08.031. [DOI] [PubMed] [Google Scholar]
- 37.Ross WN, Salzberg BM, Cohen LB, Grinvald A, Davila HV, Waggoner AS, Wang CH. Changes in absorption, fluorescence, dichroism, and Birefringence in stained giant axons: : optical measurement of membrane potential. J Membr Biol. 1977;33:141–183. doi: 10.1007/BF01869514. [DOI] [PubMed] [Google Scholar]
- 38.Senseman DM, Robbins KA. Modal behavior of cortical neural networks during visual processing. J Neurosci. 1999;19:RC3. doi: 10.1523/JNEUROSCI.19-10-j0004.1999. [DOI] [PMC free article] [PubMed] [Google Scholar]
- 39.Senseman DM, Robbins KA. High-speed VSD imaging of visually evoked cortical waves: decomposition into intra- and intercortical wave motions. J Neurophysiol. 2002;87:1499–1514. doi: 10.1152/jn.00475.2001. [DOI] [PubMed] [Google Scholar]
- 40.Shoham D, Glaser DE, Arieli A, Kenet T, Wijnbergen C, Toledo Y, Hildesheim R, Grinvald A. Imaging cortical dynamics at high spatial and temporal resolution with novel blue voltage-sensitive dyes. Neuron. 1999;24:791–802. doi: 10.1016/s0896-6273(00)81027-2. [DOI] [PubMed] [Google Scholar]
- 41.Slovin H, Arieli A, Hildesheim R, Grinvald A. Long-term voltage-sensitive dye imaging reveals cortical dynamics in behaving monkeys. J Neurophysiol. 2002;88:3421–3438. doi: 10.1152/jn.00194.2002. [DOI] [PubMed] [Google Scholar]
- 42.Spors H, Grinvald A. Spatio-temporal dynamics of odor representations in the mammalian olfactory bulb. Neuron. 2002;34:301–315. doi: 10.1016/s0896-6273(02)00644-x. [DOI] [PubMed] [Google Scholar]
- 43.Tanifuji M, Sugiyama T, Murase K. Horizontal propagation of excitation in rat visual cortical slices revealed by optical imaging. Science. 1994;266:1057–1059. doi: 10.1126/science.7973662. [DOI] [PubMed] [Google Scholar]
- 44.Tasaki I, Watanabe A, Sandlin R, Carnay L. Changes in fluorescence, turbidity, and birefringence associated with nerve excitation. Proc Natl Acad Sci U S A. 1968;61:883–888. doi: 10.1073/pnas.61.3.883. [DOI] [PMC free article] [PubMed] [Google Scholar]
- 45.Tsau Y, Guan L, Wu JY. Initiation of spontaneous epileptiform activity in the neocortical slice. J Neurophysiol. 1998;80:978–982. doi: 10.1152/jn.1998.80.2.978. [DOI] [PubMed] [Google Scholar]
- 46.Wadman WJ, Gutnick MJ. Non-uniform propagation of epileptiform discharge in brain slices of rat neocortex. Neuroscience. 1993;52:255–262. doi: 10.1016/0306-4522(93)90154-8. [DOI] [PubMed] [Google Scholar]
- 47.Wu JY, Cohen LB. Fast Multisite Optical Measurement of Membrane Potential. In: Mason WT, editor. Fluorescent and Luminescent Probes of Biological Activity. Academic Press; San Diego: 1993. pp. 389–404. [Google Scholar]
- 48.Wu JY, Guan L, Bai L, Yang Q. Spatiotemporal properties of an evoked population activity in rat sensory cortical slices. J Neurophysiol. 2001;86:2461–2474. doi: 10.1152/jn.2001.86.5.2461. [DOI] [PubMed] [Google Scholar]
- 49.Wu JY, Guan L, Tsau Y. Propagating activation during oscillations and evoked responses in neocortical slices. J Neurosci. 1999;19:5005–5015. doi: 10.1523/JNEUROSCI.19-12-05005.1999. [DOI] [PMC free article] [PubMed] [Google Scholar]


