

Abstract
Large-scale, systems biology approaches now allow us to systematically map synergistic and antagonistic interactions between drugs. Consequently, drug antagonism is emerging as a powerful tool to study biological function and relatedness between cellular components as well as to uncover mechanisms of drug action. Furthermore, theoretical models and new experiments suggest that antagonistic interactions between antibiotics can counteract the evolution of drug resistance.
Since the early days of Mendelian genetics, in the early 1900s, investigators have realized that interactions between alleles (or epistasis) often indicate that alleles are functionally related1. Epistatic interaction can be classified as synergistic, additive or antagonistic, depending on whether the combined effect of two perturbations is greater than, equal to or less than predicted on the basis of the individual effects2–9 (BOX 1). With the advent of molecular genomics, which makes it possible to systematically knock out or impair genes alone and in combination, and to conduct high-throughput phenotypic screens, epistasis can now be used to establish functional connections between genes and genetic modules in microbial systems.
Box 1. Defining drug interactions: bliss independence and loewe additivity.
Interactions between drugs are, in principle, analogous to genetic interactions, except for the additional complexity of dosage variability. There has been debate about the appropriate way to define drug interactions (reviewed in REF. 4). Antagonistic and synergistic classifications usually rely on deviations from additivity. Properly defining additivity is therefore crucial for classification of drug interactions. There are two main methods for defining additivity.
Bliss independence
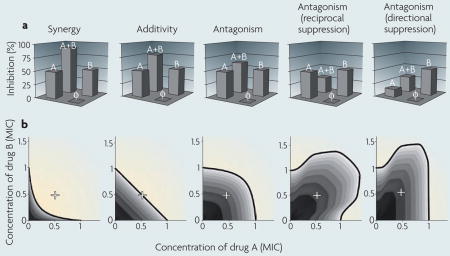
Bliss independence3 assumes that the relative effect of a drug at a particular concentration is independent of the presence of the other drug. For example, if drugs A and B individually cause growth inhibition of 50% each, then Bliss independence predicts that, in combination, drugs A and B decrease growth by 1–0.5*0.5, or 75%. Positive or negative deviations from this prediction describe synergistic and antagonistic interactions, respectively (see the figure, part a; φ represents no drug). A special class of antagonism, called suppression (or hyper-antagonism), occurs when the combined effect of the two drugs is weaker not only compared with their expected additive effect, but also compared with one (directional suppression) or both (reciprocal suppression) of their individual effects.
The Bliss definition is simple, easy to measure and provides an exact analogy to the definition of epistasis that is conventionally used for genetic perturbations7,9. However, it does not account for nonlinearity in the dose response curve of each of the individual drugs and therefore conflates deviation from additivity due to the interactions between the drugs with deviations due to the increase in total drug dosage.
Loewe additivity
Loewe additivity2 defines a drug as non-interacting with itself. If drugs A and B are in fact the same or similar drugs, then we expect their combined effect at equal concentrations to be identical to the effect of one of the drugs in double the dose. For example, 0.5 minimum inhibitory concentration (MIC) of drug A combined with 0.5 MIC of drug B (+ in the figure, part b) is equivalent to 1 MIC of drug A or 1 MIC of drug B in an additive drug pair. In other words, drugs are additive according to Loewe if their inhibition is constant along lines of equal effective dosage in the drug concentration space. Lines of constant inhibition, called isoboles, can be measured by acquiring phenotypic data across a two-dimensional range of dosages of the drugs. Linear isoboles define non-interacting drugs; concave isoboles define a synergistic drug pair, which in combination provide the same effect for less dosage; convex isoboles define an antagonistic drug pair, which in combination requires increased dosage to achieve the same effect; and non-monotonic isoboles define reciprocal and directional suppression (see the figure, part b).
Drugs, like genetic perturbations, can have synergistic, additive or antagonistic effects. Importantly, the analytical tools that were developed to assess genetic epistatic interactions are now starting to be applied to drug interactions, providing the means for both uncovering the action of uncharacterized drugs based on their patterns of interactions with well understood antimicrobials and for understanding the relationships between pathways targeted by different drugs. While perturbations are combined in the laboratory to probe biological systems, drugs are also combined for therapeutic purposes. In these settings, synergistic combinations of drugs are typically used to achieve maximum therapeutic effect. Nevertheless, until recently, the effect of drug interactions on the evolution of resistance to drugs has not received much attention. Recent studies have suggested that antagonistic drug pairs can slow down and potentially even reverse the evolution of drug resistance10–12.
The main premise of this article is that antagonistic interactions between drugs, which have been somewhat overlooked, are invaluable tools for uncovering biological function and underlying network architecture, and can generate a fitness landscape that slows down the evolution of antibiotic resistance. We first focus on interactions between genes, which provide a useful analogy to drug interactions and help introduce some of the principal concepts of the relationship between antagonistic interactions and biological function. We then shift to drug interactions and emphasize similarities and differences to the genetic case. Establishing the basic concepts of drug interactions then allows us to explore the impact of these interactions on the evolution of drug resistance. We provide empirical evidence and theoretical insight into how antagonistic drug interactions, somewhat counter-intuitively, restrain the evolution of drug resistance.
Uncovering biological functions
Measuring synergy and antagonism
Systematic screens for synergy between double gene knockouts have been successfully used to understand biological systems in bacteria and yeast13–17. Whereas such synergistic interactions can be identified qualitatively by viability scoring, the identification of antagonistic interactions requires quantitative measurements that are more accurate. For example, if a knockout of gene A decreases fitness by 1% and a knockout of gene B decreases fitness by 2%, then we expect the fitness of the doubly perturbed organism to be ~0.97 if the perturbations were additive (1–0.01) (1–0.02) (BOX 1). Identifying a synergistic relationship can therefore be as simple as discriminating fitness values close to 0 from the predicted value of 0.97. Identifying antagonism is more difficult, however, as even small positive deviations from the 0.97 prediction profoundly change the interaction type: a fitness of 0.98 in the doubly perturbed organism means that perturbation A is completely masked by perturbation B, which is a strong type of antagonistic interaction (BOX 1). Although this asymmetry between identification of synergy and antagonism is reversed if mutations have large effects on fitness (for example, if one gene deletion is lethal but its effect is suppressed by another deletion, resulting in a viable double mutant), most gene deletions practically considered in double knockout studies produce minor effects. Because of this difficulty in identifying antagonistic interactions, high-throughput experiments have mostly chronicled synergistic interactions13–15,18–20.
Owing to recent technical advancements, we can now measure fitness precisely, enabling identification of antagonistic interactions21–28. Such techniques are based on quantitative measurements of optical density time curves25, on quantitation of colony images24,27,29,30 or on measuring direct competition between mutants and reference strains using differential fluorescence labelling31,32. It now seems that antagonistic interactions are as common as synergistic ones21,22,25,26.
Synergy and antagonism provide functional insight
Epistasis can reveal two types of relationships between two genes: direct relationships (specific epistasis between the two genes) and indirect relationships (the pattern of their epistasis with other genes). In the direct relationship, synergy between two perturbations generally suggests that the two targets carry out the same function. For example, they may be enzymes that catalyse reactions that generate the same product (FIG. 1a). Antagonism in the direct relationship could occur in two different ways. First, if each of the two mutations individually causes complete loss of function in the same non-essential pathway, then the effect of each of the individual deletions will be identical and will be equal to the effect of their combination (FIG. 1a). This type of antagonistic interaction, called co-equality25 or non-directional buffering33, can be found, for example, between two enzymes in the same linear metabolic pathway33 or between two components of the same protein complex25,34. Second, perturbations that cause partial loss in two different functions that are each individually essential for growth can result in another type of antagonism, called directional buffering, in which the combined effect of the two perturbations is equal to the most limiting of the two33 (FIG. 1a). For example, two mutations that reduce the rates of synthesis of two building blocks of an essential product will have such an antagonistic effect, as if one of these rates becomes limiting for growth then it effectively masks perturbations in the other, non-limiting, rate.
Figure 1. A functional relationship between pathways can be revealed by the direct epistasis link between them and by the similarity of their epistasis interaction patterns with other pathways.

a| Perturbations in different simple architectures of metabolic networks. Synergy is formed between perturbations in two alternative pathways that produce the same product. Each perturbation alone has little effect, as the flux can continue through the alternative pathway33,65. Together, however, their effect is stronger, as their joint product can no longer be formed. Antagonism can occur in partial loss of function of two parallel pathways for building blocks of a single essential product. The most limiting pathway masks perturbation in the other pathway. A special type of antagonistic interaction, called co-equality, is formed when two perturbations completely inhibit two different targets within a linear pathway of an important but unessential metabolite. Each perturbation alone completely stops the flux through the pathway, neutralizing the effect of the other perturbation. b | Functional relatedness between two perturbed pathways can be inferred by the similarity of their interactions with other perturbations. The schematic on the left shows eight drugs (A–H) for which drug pairs interact synergistically (red lines), antagonistically (green lines) or additively (no lines). The middle schematic shows how drugs can be grouped into functional classes (dashed ovals) that interact with each other monochromatically (that is, with purely antagonistic or purely synergistic interactions between any two clusters). The schematic on the right shows a simplified network of a system-level view, showing the main groups and the interactions among them. c | This concept was used to generate a system-level view of antibiotic interactions based on data for all pair-wise combinations of 21 drugs. Figure modified, with permission, from Nature Genetics REF. 35 © (2006) Macmillan Publishers Ltd. All rights reserved.
Functional relatedness between two genes can also be inferred from their indirect relationships. Similarity in the way in which two genes interact with other genes has been used to suggest functional relatedness in metabolic networks33, secretory pathways23 and multiprotein complexes29. A related concept is the idea of ‘monochromatic’ modularity, whereby genes are grouped into classes such that members of one class interact with members of another class in only one way — either synergistically or antagonistically33. This approach highlights the idea that epistasis at the gene level reflects epistasis at a higher hierarchical level (that is, between the two biological functions that are perturbed). All genes contributing to one function should then interact in a similar way with all genes participating in another function (FIG. 1b). Thus, this approach extends the concept of epistasis from the gene level to the system level of interactions between functional modules.
Pharmacalogical interactions
The above ideas can be extended to pharmacological interaction networks (see Further information for a link to the Literature-curated Drug Network). Similarly to genes, drug interactions can be classified based on the deviation of their combined effect from a predictive additive effect of their individual outcomes. Such drug interaction networks could be used to classify drugs by the cellular function they inhibit, namely by their underlying mechanism of action. Consider several subsets of drugs — 1, 2 and 3 — in which all drugs in group 1 interact antagonistically with all drugs in group 2 and synergistically with all drugs in group 3 (FIG. 1b). Now, consider a new drug, X, with an unknown function that also interacts antagonistically with all drugs in group 2 and synergistically with all drugs in group 3. This would suggest that drug X functions similarly to drugs from group 1 (FIG. 1b). Alternatively, if a new drug Y cannot be placed in any known group without violating the monochromaticity of the interaction of this group with all other groups, this could indicate that drug Y has a novel, as-yet-unidentified mechanism of action. Finally, if a drug cannot be placed in any group and cannot be placed alone without a mixed synergistic–antagonistic interaction pattern with one of the existing groups, this could indicate that the drug has multiple mechanisms of action. These ideas and methodologies have been used to classify antibiotics in a pair-wise interaction network35 (FIG. 1c).
There are important differences between genetic and drug interactions. Most notably, genetic studies often focus on gene deletions, which confer complete loss of function. Drugs, by contrast, carry an inherent variability owing to dosage. That is, genetic perturbations can be considered as on–off switches, and pharmacological perturbations as continuous ‘dimmers’. The variability of drug dosage complicates the basic question of how to define interactions between drugs, especially as the type of interaction can vary with dosage. Bliss independence (which ignores this variability and only considers interactions between fixed drug dosages) and Loewe additivity (which considers the full dose-by-dose two-dimensional response function) are two commonly used approaches (BOX 1). The richness of the dose-by-dose interaction pattern contains valuable information on the underlying connectivity between the molecular targets of two drugs36,37.
Slowing evolution of resistance
Although antagonistic interactions have begun to be appreciated for their ability to uncover gene and drug functions, they are generally avoided in the clinical world of antimicrobials. As synergistic drug combinations generate increased efficacy at lower doses, synergy has long been used by clinicians38. This may explain the bias observed towards synergy in the antibiotic interaction literature compared with the roughly equal frequencies of synergy and antagonism found in systematic studies35. This bias, together with recent in vitro laboratory studies showing that antagonism can slow down the evolution of drug resistance10,12, provides motivation to explore the possibility that antagonism might have some unappreciated effects on the evolution of drug resistance.
An extreme example that illustrates the impact of antagonism on the evolution of resistance is suppression, or ‘hyper-antagonism’, in which the combined effect of two drugs is smaller than that of one of the drugs alone (BOX 1). Suppressive interactions between drugs were first documented in 1872 by Fraser39, who noticed that the toxic effect of physostigma, a toxin that causes paralysis and death, can be relieved by another drug, atropia. Fraser called this interaction ‘physiological antidote’ to emphasize that the drugs do not inhibit each other through direct chemical interaction, but rather that the suppressive interaction reflects specific relationships between the two physiological pathways inhibited by the drugs39.
Suppressive drug combinations select against resistant bacteria
Although suppressive interactions have received attention in pharmacology, they have been almost completely neglected in the context of antimicrobials. Nevertheless, such suppressive interactions between antibiotics, although uncommon, are not very rare. A systematic study of interactions between antibiotics showed that suppression often occurs between protein synthesis inhibitors and DNA synthesis inhibitors. Although the specific mechanistic reasons for this effect are not understood, it is worth mentioning a different, yet potentially related, phenomenon called the Eagle effect40. Eagle and Musselman40 first pointed out that the dose response curve of a single antibiotic is not always monotonic; for some drugs, increased dosage beyond a certain point actually decreases their effects. This effect is most strikingly observed as an isolated ring of growing bacteria around the inhibition zone in a disc-diffusion assay. This phenomenon is most pronounced when DNA synthesis inhibitors, such as ciprofloxacin, are used41,42. Similarly to suppressive drug combinations, the inhibitory effect of a DNA synthesis drug is cancelled, but owing to its own presence rather than that of a second drug.
Suppressive drug combinations have been shown to reduce inhibition power at fixed drug dosage, but their impact on the evolution of drug resistance (FIG. 2) has received little attention until the past few years. Recently, it has been shown that suppressive interactions have the potential advantage of selecting against resistant bacteria10 (FIG. 2a–c). Consider a case in which drug A partially suppresses the effect of drug B. What selection advantage would be conferred to a mutant that becomes resistant to drug A? To begin with, we can adopt the simplified assumption that resistance to a particular drug is effectively equivalent to the bacteria ‘not seeing’ the drug at all. Under this assumption, bacteria that acquire resistance to drug A lose its partial protectiveness against drug B, and therefore lose in competition with the drug-sensitive wild type (FIG. 2b,c). This simple idea was recently explored in a study of selection for doxycycline resistance10. As expected, bacteria resistant to doxycycline outcompeted their sensitive wild-type cousins when exposed to doxycycline. The selective advantage of resistance is even further enhanced when doxycycline is combined with the synergistic drug partner erythromycin, as in this case resistance to doxycycline effectively removes both the burden of doxycycline and the doxycycline-enhanced burden of erythromycin (FIG. 2f). However, when ciprofloxacin, a drug suppressed by doxycycline (known as directional suppression; FIG. 2c) is added, bacteria resistant to doxycycline are outcompeted by sensitive wild-type cells (FIG. 2g). Suppressive drug combinations can therefore invert selection and select against mutants resistant to one of the drugs.
Figure 2. Suppressive drug combinations can reverse selection for resistance.

a| In synergistic drug pairs, the effect of antibiotics is larger when combined together. Resistance mutations to either drug (for example, drug A) are favourable for the bacteria and allow a subsequent favourable resistance mutation to the other drug (for example, drug B). Development of multidrug resistance could occur by sequential single-drug resistance steps. φ represents no drug. b | Resistance is less likely to occur in reciprocally suppressive drug combinations, as each single-drug resistance step (dashed arrows) is unfavourable. c | Although the ideal case of reciprocal suppression has not been observed in antibiotics, unidirectional suppression (one drug suppresses the effect of the other) is not very rare. Here, drug B reverses selection for resistance to drug A, but drug A does not reverse selection for resistance to drug B. In such cases, the population is not fully locked in a sensitive state (as occurs in b), but this tactic could slow resistance. d,e | The same idea can be understood in a more refined model that accounts for drug dosages. As drug resistance means that the bacteria effectively see a reduced concentration of the drug, the growth region of resistant mutants could be approximated as a geometrical rescaling of the growth region of the wild type. This same rescaling leads to profoundly different outcomes in synergy versus antagonism. In the synergistic case (d), the growth region of the resistant mutant is completely inclusive of that of the wild type. In the antagonistic case (e), however, there is a region of drug concentrations (asterisk) where the wild-type strain can grow, but the resistant mutant cannot10. f,g | Direct competition of doxycycline-sensitive (doxs) and doxycycline-resistant (doxr) Escherichia coli strains revealed selection against resistance. Resistant and sensitive cells were differentially labelled, inoculated at 1:1 into an array of drug environments (black dots) and counted by flow cytometry after 24 hours. In the drug environment of the synergistic pair doxycycline–erythromycin, the resistant strain always wins (f), but in the antagonistic pair of doxycycline–ciprofloxacin, the sensitive strain outcompetes the resistant strain under certain drug ratios (g).
Antibiotic resistance can occur through various mechanisms, including enzymatic modification or degradation of a drug, pumping of a drug out of the cell by efflux pumps and modification of a drug target. All of these mechanisms decrease the effective concentration of a drug, as encountered by the bacteria. Thus, a more refined approximation of resistance is that drug-resistant bacteria effectively ‘experience’ a lower drug dosage. Consequently, resistance can be approximated as a rescaling of drug concentrations (FIG. 2d,e). In synergistic interactions, the rescaled area of growth of resistant mutants in the two-drug dosage space includes the entire area of growth of the wild-type strain; resistant cells can grow in any of the drug concentrations at which the sensitive bacteria can grow (FIG. 2d,f). In the suppressive case, the impact of this same rescaling is profoundly different: resistant bacteria cannot grow in part of the drug space that allows growth of the sensitive bacteria (asterisk in FIG. 2e). In this area, resistant strains lose in competition against wild-type drug-sensitive strains (FIG. 2g). This geometric rescaling model explains why the selection against resistant bacteria is largely independent of the specific mechanism by which resistance is encoded; it works effectively against resistance encoded by an efflux pump, enzymatic degradation or target modification10.
Antagonism may reduce evolution of resistance
Do different drug interactions increase or decrease the overall potential for the evolution of resistance? For environments involving a single drug, a key factor that affects the propensity for evolution of resistance is the frequency of resistant mutations as a function of drug dosage (FIG. 3a). Typically, as drug dosage increases, bacteria exhibit a step-wise decrease in the number of resistant colonies (FIG. 3a), with an initial drop at the minimum inhibitory concentration (MIC) — owing to selection against the wild type — followed by one or more subsequent plateaus and steps that reflect selection against different common mutants. The drug concentration that corresponds to the final step, at which the frequency of resistant mutations drops below a detectable level, is termed the mutant prevention concentration (MPC). As evolution requires both mutations and selection, resistance is thought to evolve primarily at drug concentrations below the MPC but above the MIC43,44, a region termed the mutant selection window (MSW)45,46 (FIG. 3a). As drug concentrations fluctuate in time and space in and out of the MSW, the size of the MSW is thought to influence the chance that resistant bacteria will evolve45–55. It is worth noting, however, that in addition to the time within the MSW56, other factors, such as the time spent at low and high drug concentrations within the MSW, are also important57.
Figure 3. Drug interactions affect the mutant selection window.

a| Schematic of the frequency of spontaneous resistance mutations as a function of drug concentrations for a single-drug environment46. The point at which the frequency drops to undetectable values is called the mutant prevention concentration (MPC). As evolution requires both mutations and selection, evolution is thought to proceed primarily below the MPC and above the minimum inhibitory concentration (MIC). This region is called the mutant selection window (MSW). b | The concept of the MSW can be extended to multidrug combinations, for which it becomes the area (red) between the MIC line (solid) and MPC line (dashed) in the drug–drug concentration space. A fixed drug ratio corresponds to a linear line with angle θ that extends from the origin and is associated with an effective MSW. c | Data for fusidic acid and erythromycin show that some drug ratios can decrease the MSW, compared with the MSW of single drugs. Recent experiments and modelling suggest that the best reduction in MSW can be achieved by greater antagonistic interactions and lower cross-resistance12.
The concept of the MSW can be naturally extended from single-drug to multidrug treatments (FIG. 3a,b). But how is the size of the MSW affected by multidrug treatment? A few studies examined the MSW in several drug pairs and demonstrated that although some drug combinations can substantially narrow the MSW12,58 (FIG. 3c), others cannot. To understand the impact of drug combinations and of the interaction between drugs on the size of the MSW, we need to consider a model that can predict the number of resistant colonies appearing in a multidrug environment.
The simplest model for the mutant fraction of the population that can survive and grow in a multidrug environment assumes that the probability of mutations that allow growth to a particular concentration in drugs A and B is equal to the multiplication of the probabilities of mutations that allow growth to drug A alone and drug B alone at their particular concentrations. It is easy to see how this simplified model fails when mutations confer resistance to both drugs simultaneously (known as pleiotropy or positive cross-resistance) or when resistance to one drug confers hypersensitivity to another (known as negative cross-resistance). However, even with no cross-resistance (when the mutations that confer resistance to each of the two drugs are completely independent), the simple multiplication model does not work. Consider, for example, an environment in which both drug A and drug B are at a concentration of half their MIC (+ in BOX 1, figure). If the drug combination is synergistic, wild-type bacteria cannot grow and the fraction of cells that can grow will be much smaller than one. By contrast, if the drug combination is antagonistic, wild-type bacteria can grow and the frequency of cells able to grow in the presence of the drugs will approach 1. In both cases, however, the ability of the bacteria to grow in the presence of either of the individual drugs at the assumed 0.5 MIC concentrations is 1 (as even the wild type can grow), and therefore the prediction for the ability of the bacteria to grow in the multidrug environment based on multiplication will also be 1. A predictive model for the number of resistant colonies in multidrug combinations must therefore account both for cross-resistance between the drugs and for drug interactions (synergy or antagonism).
A first attempt to develop such a model was described by Michel and colleagues12. Their model incorporates drug interactions and cross-resistance, making the assumption that each mutant experiences the same drug interactions as the wild type. That is, resistant mutants see an effective reduction in drug concentrations, and their region of growth in the two-drug space can be approximated by rescaling the region of growth measured for the wild type (FIG. 2d,e). This assumption yields a model that predicts the frequency of mutations allowing growth in multidrug environments based on the profile of resistance to each of the single drugs as a function of drug dosage, the level of cross-resistance between the drugs and the type and extent of their interaction. Model predictions agreed with high-throughput measurements of resistance frequencies over the two-dimensional, drug-dose space for several different drug pairs. Importantly, this model suggests that, for fixed levels of cross-resistance, antagonistic drugs decrease the size of the MSW more than do synergistic drugs.
At drug concentrations below the MPC, resistant mutants will appear, but how long will it take for the whole population to become resistant? As shown in FIG. 2, mutations that confer resistance to a single drug may be more beneficial for bacteria in multidrug synergistic treatments than in antagonistic treatments. With synergistic drugs, single-drug resistance mutations not only remove the effect associated with one of the drugs, but also remove the synergy with the other drug. With antagonistic drugs, by contrast, removing the effect of one of the drugs will actually reveal the previously suppressed effect of the other drug (FIG. 2b,c). These expected differences in the fitness advantage that resistant mutations confer in multidrug environments suggest that the rate of adaptation of the population may actually be faster in synergistic drug environments (we define the rate of adaptation as the rate at which the average fitness of the population increases as resistant mutants spread in the population; FIG. 4a). A study designed to test this prediction has used automated parallel evolutionary adaptation experiments, in which bacterial populations are propagated in different drug combinations over hundreds of generations while their fitness increase is monitored continuously11. Results of this study showed that synergy accelerates the rate of adaptation relative to antagonistic drug combinations (FIG. 4b).
Figure 4. Evolution in various antibiotic combinations reveals an accelerated rate of adaptation in synergistic drug pairs.

Bacterial populations were grown in an automatic robotic system with daily dilutions in different drug pairs and concentration ranges (~200 different conditions). a | Growth rate of one typical population, showing adaptation time (T1/2) and fitness gain (Δ). The inset shows the daily growth rates, which were measured by continuous optical density (OD) monitoring (first day, green; eighth day, red). b | The adaptation rate (Δ/T1/2) is negatively correlated with drug interactions; synergistic drug pairs accelerate the rate of adaptation. Figure modified, with permission, from REF. 11 © (2008) National Academy of sciences.
Microbial adaptation in multidrug environments provides a fascinating case of evolution in multidimensional phenotypic space, where the fitness could be a strongly nonlinear function of the phenotypic axes. These nonlinearities can generate interesting and non-intuitive dynamics, including inversion of selection towards sensitivity and away from resistance. The implications of these population genetic findings to clinical settings are not trivial. It is unclear whether antagonistic drug combinations will be effective at forestalling the evolution of resistance in vivo and to what extent they could be applied more generally to other diseases, such as HIV59, malaria60 and cancer66. Many factors affect the success of clinical treatments, including pharmacokinetics, heterogeneous drug concentrations, horizontal gene transfer, interactions with other microbial species and host interactions61–63. Of course, one important consideration against the use of antagonistic drug combinations is their reduced efficacy, which leads to longer time for infectious clearance, thereby increasing the chance for the evolution of resistance64. Furthermore, ethical considerations, such as balancing the interests of populations versus individuals, must inform the choice between antagonistic and synergistic drugs in treatments.
Conclusion
New technological advances, including automated parallel measurements of bacterial growth in competition assays, now allow us to make accurate classifications of epistatic interactions between drugs, leading to a richer understanding of the function of elements in biological networks. Having both synergistic and antagonistic interactions mapped in the same system allows us to find patterns that would be missed if only one class of interaction were considered. Laboratory experiments and theoretical modelling show that antagonistic interactions select against resistant alleles, narrow the range of drug concentrations in which evolution of resistance occurs and slow down the rate of evolution through spontaneous mutations. Further study of antagonistic drug combinations may be useful when evaluating effective multidrug treatments. The choice between synergy and antagonism may involve a trade-off between immediate efficacy of inhibition of microbial growth and future forestalment of the evolution of resistance.
Acknowledgments
We thank A. DeLuna, J.-B. Michel, R. Chait, N. Shoresh and T. Bollenbach for helpful discussion and comments on the manuscript. R. Chait contributed many of the figures for BOX 1. This work was supported in part by a National Institutes of Health postdoctoral fellowship to P.J.Y., by National Science Foundation and National Defense Science and Engineering graduate fellowships to A.P.A. and by National Institutes of Health Grant R01GM081617 to R.K.
Footnotes
FURTHER INFORMATION
Roy Kishony’s homepage: http://kishony.med.harvard.edu
Literature-curated Drug Network: http://kishony.med.harvard.edu/DrugNetwork
ALL LINKS ARE ACTIVE IN THE ONLINE PDF
References
- 1.Hickman M, Cairns J. The centenary of the one-gene one-enzyme hypothesis. Genetics. 2003;163:839–841. doi: 10.1093/genetics/163.3.839. [DOI] [PMC free article] [PubMed] [Google Scholar]
- 2.Loewe S. Die quantitation probleme der pharmakologie. Ergeb Physiol. 1928;27:47–187. [Google Scholar]
- 3.Bliss CI. The toxicity of poisons applied jointly. Ann Appl Biol. 1939;26:585–615. [Google Scholar]
- 4.Greco WR, Bravo G, Parsons JC. The search for synergy: a critical review from a response surface perspective. Pharmacol Rev. 1995;47:331–385. [PubMed] [Google Scholar]
- 5.Frankel WN, Schork NJ. Who’s afraid of epistasis? Nature Genet. 1996;14:371–373. doi: 10.1038/ng1296-371. [DOI] [PubMed] [Google Scholar]
- 6.Phillips PC. The language of gene interaction. Genetics. 1998;149:1167–1171. doi: 10.1093/genetics/149.3.1167. [DOI] [PMC free article] [PubMed] [Google Scholar]
- 7.Phillips PC, Otto SP, Whitlock MC. Epistasis and the Evolutionary Process. Oxford Univ. Press; New York: 2000. [Google Scholar]
- 8.Brodie ED., III . Epistasis and the Evolutionary Process. Oxford Univ. Press; New York: 2000. [Google Scholar]
- 9.Mani R, Onge RPS, Hartman JL, Giaever G, Roth FP. Defining genetic interaction. Proc Natl Acad Sci USA. 2008;105:3461–3466. doi: 10.1073/pnas.0712255105. [DOI] [PMC free article] [PubMed] [Google Scholar]
- 10.Chait R, Craney A, Kishony R. Antibiotic interactions that select against resistance. Nature. 2007;446:668–671. doi: 10.1038/nature05685. [DOI] [PubMed] [Google Scholar]
- 11.Hegreness M, Shoresh N, Damian D, Hartl D, Kishony R. Accelerated evolution of resistance in multidrug environments. Proc Natl Acad Sci USA. 2008;105:13977–13981. doi: 10.1073/pnas.0805965105. [DOI] [PMC free article] [PubMed] [Google Scholar]
- 12.Michel JB, Yeh P, Chait R, Moellering RC, Kishony R. Drug interactions modulate the potential for evolution of resistance. Proc Natl Acad Sci USA. 2008;105:14918–14923. doi: 10.1073/pnas.0800944105. [DOI] [PMC free article] [PubMed] [Google Scholar]
- 13.Tong AHY, et al. Systematic genetic analysis with ordered arrays of yeast deletion mutants. Science. 2001;294:2364–2368. doi: 10.1126/science.1065810. [DOI] [PubMed] [Google Scholar]
- 14.Tong AHY, et al. Global mapping of the yeast genetic interaction network. Science. 2004;303:808–813. doi: 10.1126/science.1091317. [DOI] [PubMed] [Google Scholar]
- 15.Pan XW, et al. A DNA integrity network in the yeast Saccharomyces cerevisiae. Cell. 2006;124:1069–1081. doi: 10.1016/j.cell.2005.12.036. [DOI] [PubMed] [Google Scholar]
- 16.Lehner B, Crombie C, Tischler J, Fortunato A, Fraser AG. Systematic mapping of genetic interactions in Caenorhabditis elegans identifies common modifiers of diverse signaling pathways. Nature Genet. 2006;38:896–903. doi: 10.1038/ng1844. [DOI] [PubMed] [Google Scholar]
- 17.Tischler J, Lehner B, Fraser AG. Evolutionary plasticity of genetic interaction networks. Nature Genet. 2008;40:390–391. doi: 10.1038/ng.114. [DOI] [PubMed] [Google Scholar]
- 18.Ye P, et al. Gene function prediction from congruent synthetic lethal interactions in yeast. Mol Syst Biol. 2005;1:2005.0026. doi: 10.1038/msb4100034. [DOI] [PMC free article] [PubMed] [Google Scholar]
- 19.Ooi SL, et al. Global synthetic-lethality analysis and yeast functional profiling. Trends Genet. 2006;22:56–63. doi: 10.1016/j.tig.2005.11.003. [DOI] [PubMed] [Google Scholar]
- 20.Meluh PB, et al. Analysis of genetic interactions on a genome-wide scale in budding yeast: diploid-based synthetic lethality analysis by microarray. Methods Mol Biol. 2008;416:221–247. doi: 10.1007/978-1-59745-321-9_15. [DOI] [PubMed] [Google Scholar]
- 21.Sanjuan R, Moya A, Elena SF. The contribution of epistasis to the architecture of fitness in an RNA virus. Proc Natl Acad Sci USA. 2004;101:15376–15379. doi: 10.1073/pnas.0404125101. [DOI] [PMC free article] [PubMed] [Google Scholar]
- 22.Drees BL, et al. Derivation of genetic interaction networks from quantitative phenotype data. Genome Biol. 2005;6:R38. doi: 10.1186/gb-2005-6-4-r38. [DOI] [PMC free article] [PubMed] [Google Scholar]
- 23.Schuldiner M, et al. Exploration of the function and organization of the yeast early secretory pathway through an epistatic miniarray profile. Cell. 2005;123:507–519. doi: 10.1016/j.cell.2005.08.031. [DOI] [PubMed] [Google Scholar]
- 24.Collins SR, Schuldiner M, Krogan NJ, Weissman JS. A strategy for extracting and analyzing large-scale quantitative epistatic interaction data. Genome Biol. 2006;7:R63. doi: 10.1186/gb-2006-7-7-r63. [DOI] [PMC free article] [PubMed] [Google Scholar]
- 25.St Onge RP, et al. Systematic pathway analysis using high-resolution fitness profiling of combinatorial gene deletions. Nature Genet. 2007;39:199–206. doi: 10.1038/ng1948. [DOI] [PMC free article] [PubMed] [Google Scholar]
- 26.Jasnos L, Korona R. Epistatic buffering of fitness loss in yeast double deletion strains. Nature Genet. 2007;39:550–554. doi: 10.1038/ng1986. [DOI] [PubMed] [Google Scholar]
- 27.Typas A, et al. High-throughput, quantitative analyses of genetic interactions in E. coli. Nature Methods. 2008;5:781–787. doi: 10.1038/nmeth.1240. [DOI] [PMC free article] [PubMed] [Google Scholar]
- 28.Roguev A, et al. Conservation and rewiring of functional modules revealed by an epistasis map in fission yeast. Science. 2008;322:405–410. doi: 10.1126/science.1162609. [DOI] [PMC free article] [PubMed] [Google Scholar]
- 29.Collins SR, et al. Functional dissection of protein complexes involved in yeast chromosome biology using a genetic interaction map. Nature. 2007;446:806–810. doi: 10.1038/nature05649. [DOI] [PubMed] [Google Scholar]
- 30.Roguev A, Wiren M, Weissman JS, Krogan NJ. High-throughput genetic interaction mapping in the fission yeast Schizosaccharomyces pombe. Nature Methods. 2007;4:861–866. doi: 10.1038/nmeth1098. [DOI] [PubMed] [Google Scholar]
- 31.DeLuna A, et al. Exposing the fitness contribution of duplicated genes. Nature Genet. 2008;40:676–681. doi: 10.1038/ng.123. [DOI] [PubMed] [Google Scholar]
- 32.Breslow DK, et al. A comprehensive strategy enabling high-resolution functional analysis of the yeast genome. Nature Methods. 2008;5:711–718. doi: 10.1038/nmeth.1234. [DOI] [PMC free article] [PubMed] [Google Scholar]
- 33.Segre D, DeLuna A, Church GM, Kishony R. Modular epistasis in yeast metabolism. Nature Genet. 2005;37:77–83. doi: 10.1038/ng1489. [DOI] [PubMed] [Google Scholar]
- 34.Bandyopadhyay S, Kelley R, Krogan NJ, Ideker T. Functional maps of protein complexes from quantitative genetic interaction data. PloS Comput Biol. 2008;4:e1000065. doi: 10.1371/journal.pcbi.1000065. [DOI] [PMC free article] [PubMed] [Google Scholar]
- 35.Yeh P, Tschumi AI, Kishony R. Functional classification of drugs by properties of their pairwise interactions. Nature Genet. 2006;38:489–494. doi: 10.1038/ng1755. [DOI] [PubMed] [Google Scholar]
- 36.Lehar J, et al. Chemical combination effects predict connectivity in biological systems. Mol Syst Biol. 2007;3:80. doi: 10.1038/msb4100116. [DOI] [PMC free article] [PubMed] [Google Scholar]
- 37.Yeh P, Kishony R. Networks from drug–drug surfaces. Mol Syst Biol. 2007;3:85. doi: 10.1038/msb4100133. [DOI] [PMC free article] [PubMed] [Google Scholar]
- 38.Pillai SK, Moellering RC, Eliopoulos GM. In: Antibiotics in Laboratory Medicine. Lorian V, editor. Lippincott Williams & Wilkins; Philadelphia: 2005. pp. 365–440. [Google Scholar]
- 39.Fraser TR. The antagonism between the actions of active substances. Br Med J. 1872;2:485–487. doi: 10.1136/bmj.2.618.485. [DOI] [PMC free article] [PubMed] [Google Scholar]
- 40.Eagle H, Musselman AD. The rate of bactericidal action of penicillin in vitro as a function of its concentration, and its paradoxically reduced activity at high concentrations against certain organisms. J Exp Med. 1948;88:99–131. doi: 10.1084/jem.88.1.99. [DOI] [PMC free article] [PubMed] [Google Scholar]
- 41.Smith JT. The mode of action of 4-quinolones and possible mechanisms of resistance. J Antimicrob Chemother. 1986;18:21–29. doi: 10.1093/jac/18.supplement_d.21. [DOI] [PubMed] [Google Scholar]
- 42.Lewin CS, Morrissey I, Smith JT. The mode of action of quinolones: the paradox in activity of low and high concentrations and activity in the anaerobic environment. Eur J Clin Microbiol Infect Dis. 1991;10:240–248. doi: 10.1007/BF01966996. [DOI] [PubMed] [Google Scholar]
- 43.Baquero F. Resistance to quinolones in gram-negative micororganisms: mechanisms and prevention. Eur Urol. 1990;17:3–12. doi: 10.1159/000464084. [DOI] [PubMed] [Google Scholar]
- 44.Baquero F, Negri MC. Strategies to minimize the development of antibiotic resistance. J Chemother. 1997;9:29–37. [PubMed] [Google Scholar]
- 45.Dong YZ, Zhao XL, Domagala J, Drlica K. Effect of fluoroquinolone concentration on selection of resistant mutants of Mycobacterium bovis BCG and Staphylococcus aureus. Antimicrob Agents Chemother. 1999;43:1756–1758. doi: 10.1128/aac.43.7.1756. [DOI] [PMC free article] [PubMed] [Google Scholar]
- 46.Drlica K. The mutant selection window and antimicrobial resistance. J Antimicrob Chemother. 2003;52:11–17. doi: 10.1093/jac/dkg269. [DOI] [PubMed] [Google Scholar]
- 47.Dong YZ, Zhao XL, Kreiswirth BN, Drlica K. Mutant prevention concentration as a measure of antibiotic potency: studies with clinical isolates of Mycobacterium tuberculosis. Antimicrob Agents Chemother. 2000;44:2581–2584. doi: 10.1128/aac.44.9.2581-2584.2000. [DOI] [PMC free article] [PubMed] [Google Scholar]
- 48.Blondeau JM, Zhao XL, Hansen G, Drlica K. Mutant prevention concentrations of fluoroquinolones for clinical isolates of Streptococcus pneumoniae. Antimicrob Agents Chemother. 2001;45:433–438. doi: 10.1128/AAC.45.2.433-438.2001. [DOI] [PMC free article] [PubMed] [Google Scholar]
- 49.Zhao XL, Drlica K. Restricting the selection of antibiotic-resistant mutant bacteria: measurement and potential use of the mutant selection window. J Infect Dis. 2002;185:561–565. doi: 10.1086/338571. [DOI] [PubMed] [Google Scholar]
- 50.Randall LP, Cooles SW, Piddock LJV, Woodward MJ. Mutant prevention concentrations of ciprofloxacin and enrofloxacin for Salmonella enterica. J Antimicrob Chemother. 2004;54:688–691. doi: 10.1093/jac/dkh360. [DOI] [PubMed] [Google Scholar]
- 51.Metzler K, et al. Comparison of minimal inhibitory and mutant prevention drug concentrations of 4 fluoroquinolones against clinical isolates of methicillin-susceptible and -resistant Staphylococcus aureus. Int J Antimicrob Agents. 2004;24:161–167. doi: 10.1016/j.ijantimicag.2004.02.021. [DOI] [PubMed] [Google Scholar]
- 52.Linde HJ, Lehn N. Mutant prevention concentration of nalidixic acid, ciprofloxacin, clinafloxacin, levofloxacin, norfloxacin, ofloxacin, sparfloxacin or trovafloxacin for Escherichia coli under different growth conditions. J Antimicrob Chemother. 2004;53:252–257. doi: 10.1093/jac/dkh036. [DOI] [PubMed] [Google Scholar]
- 53.Li XY, Mariano N, Rahal JJ, Urban CM, Drlica K. Quinolone-resistant Haemophilus influenzae: determination of mutant selection window for ciprofloxacin, garenoxacin, levofloxacin, and moxifloxacin. Antimicrob Agents Chemother. 2004;48:4460–4462. doi: 10.1128/AAC.48.11.4460-4462.2004. [DOI] [PMC free article] [PubMed] [Google Scholar]
- 54.Marcusson LL, Olofsson SK, Lindgren PK, Cars O, Hughes D. Mutant prevention concentrations of ciprofloxacin for urinary tract infection isolates of Escherichia coli. J Antimicrob Chemother. 2005;55:938–943. doi: 10.1093/jac/dki136. [DOI] [PubMed] [Google Scholar]
- 55.Rodriguez-Martinez JM, et al. Mutant prevention concentrations of fluoroquinolones for Enterobacteriaceae expressing the plasmid-carried quinolone resistance determinant qnrA1. Antimicrob Agents Chemother. 2007;51:2236–2239. doi: 10.1128/AAC.01444-06. [DOI] [PMC free article] [PubMed] [Google Scholar]
- 56.Firsov AA, et al. In vitro pharmacodynamic evaluation of the mutant selection window hypothesis using four fluoroquinolones against Staphylococcus aureus. Antimicrob Agents Chemother. 2003;47:1604–1613. doi: 10.1128/AAC.47.5.1604-1613.2003. [DOI] [PMC free article] [PubMed] [Google Scholar]
- 57.Firsov AA, Lubenko IY, Smirnova MV, Strukova EN, Zinner SH. Enrichment of fluoroquinolone-resistant Staphylococcus aureus: oscillating ciprofloxacin concentrations simulated at the upper and lower portions of the mutant selection window. Antimicrob Agents Chemother. 2008;52:1924–1928. doi: 10.1128/AAC.01371-07. [DOI] [PMC free article] [PubMed] [Google Scholar]
- 58.Zhanel GG, Mayer M, Laing N, Adam HJ. Mutant prevention concentrations of levofloxacin alone and in combination with azithromycin, ceftazidime, colistin (polymyxin E), meropenem, piperacillin-tazobactam, and tobramycin against Pseudomonas aeruginosa. Antimicrob Agents Chemother. 2006;50:2228–2230. doi: 10.1128/AAC.01620-05. [DOI] [PMC free article] [PubMed] [Google Scholar]
- 59.Deeks SG. Treatment of anti retroviral-drug- resistant HIV-1 infection. Lancet. 2003;362:2002–2011. doi: 10.1016/S0140-6736(03)15022-2. [DOI] [PubMed] [Google Scholar]
- 60.Nosten F, Brasseur P. Combination therapy for malaria: the way forward? Drugs. 2002;62:1315–1329. doi: 10.2165/00003495-200262090-00003. [DOI] [PubMed] [Google Scholar]
- 61.Klein M, Schorr SE. The role of bacterial resistance in antibiotic synergism and antagonism. J Bacteriol. 1953;65:454–465. doi: 10.1128/jb.65.4.454-465.1953. [DOI] [PMC free article] [PubMed] [Google Scholar]
- 62.Jawetz E. Infectious diseases: problems of antimicrobial therapy. Ann Rev Med. 1954;5:1–26. doi: 10.1146/annurev.me.05.020154.000245. [DOI] [PubMed] [Google Scholar]
- 63.Lipsitch M, Levin BR. The population dynamics of antimicrobial chemotherapy. Antimicrob Agents Chemother. 1997;41:363–373. doi: 10.1128/aac.41.2.363. [DOI] [PMC free article] [PubMed] [Google Scholar]
- 64.Lepper MH, Dowling HF. Treatment of pneumococcic meningitis with penicillin compared with penicillin plus aureomycin; studies including observations on an apparent antagonism between penicillin and aureomycin. AMA Arch Intern Med. 1951;88:489–494. doi: 10.1001/archinte.1951.03810100073006. [DOI] [PubMed] [Google Scholar]
- 65.Kishony R, Leibler S. Environmental stresses can alleviate the average deleterious effect of mutations. J Biol. 2003;2:14. doi: 10.1186/1475-4924-2-14. [DOI] [PMC free article] [PubMed] [Google Scholar]
- 66.Blagosklonny MV. Drug-resistance enables selective killing of resistant leukemia cells: exploiting of drug resistance instead of reversal. Leukemia. 1999;13:2031–2035. doi: 10.1038/sj.leu.2401623. [DOI] [PubMed] [Google Scholar]