

Abstract
Interruptions of Matrix Metalloproteinase-2 (MMP-2) and Matrix Metalloproteinase-9 (MMP-9) have been shown to reduce the ensuing threatening risk factors of vascular complications of diabetes by alteration in Extracellular Matrix (ECM). We hypothesized that minocycline induced MMP-2 and MMP-9 inhibition can be enhanced by aspirin, a non-selective COX and tPA inhibitor and this combination can reduce progression of diabetic retinopathy. Diabetes was induced in male Wistar rats by streptozotocin (55 mg/kg i.p.). Four weeks after diabetes induction rats were treated with minocycline (50 mg/kg, p.o.) per se, aspirin (50 mg/kg, p.o.) per se, or minocycline in combination with aspirin for a period of four weeks. At the end of eighth week rats were anesthetized and electroretinograms were recorded. B-wave latency, B-wave amplitude and retinal permeability were measured. Histology was done and retinal thickness was measured. Zymography was carried out for MMP-2 and MMP-9 level determinations. B-wave amplitude was significantly decreased while B- wave latency was significantly increased in diabetic group when compared with normo-glycemic rats. Treatment with combination of minocycline and aspirin significantly reversed B-wave amplitude and latency compared with vehicle-treated diabetic controls. Blood retinal permeability and retinal thickness were also significantly attenuated by the treatment of minocycline in combination with aspirin. Results of the present study suggest that MMP-2 and MMP-9 inhibition in presence of COX inhibitor prevents the development of experimental diabetic retinopathy in rats and can be a potential approach for the treatment.
Keywords: Matrix metalloproteinase 2, matrix metalloproteinase 9, extracellular matrix, diabetic retinopathy
Introduction
Early diabetic retinopathy both in humans and in experimental animal models is characterized by increased vascular permeability and capillary closure [1-4]. It is a progressive neurological disease characterized by degeneration of neurons and microglia and accompanied by profound vascular changes that eventually lead to legal blindness. The direct cause of diabetic retinopathy is still largely unknown. Diabetic retinopathy comprises both microangiopathy and neuronopathy, which starts at very early stage [5-7]. Strict glycemic control as well as early treatment has been shown to improve outcomes for diabetic patients [8, 9]. Unfortunately, there are no known treatments identified specifically for mild to moderate diabetic retinopathy [10, 11]. Then, additional treatment based on the pathogenic mechanisms becomes necessary. Chronic hyperglycaemia affects cellular and matrix function by a variety of mechanisms such as increased polyol pathway activity, altered intracellular redox state, activation of protein kinase C and non-enzymatic glycation [12-14]. Hyperglycemia also leads to intravascular alterations that can be linked to vascular occlusions.
Matrix metalloproteinase (MMPs) are a family of zinc dependent endopeptidase that mediate the degradation or remodeling of the extracellular matrix (ECM) [15]. The ECM is a multifunctional complex of proteins and proteoglycans assembled in a highly organized manner that contributes to the structural integrity of cells and tissue within an organ system [16]. The basement membrane which provides structural support to the vasculature is composed of ECM molecules such as type IV collagen, laminin, and fibronectin [17]. Various factors are involved in maintaining the integrity of the ECM and the tissues it supports. However, in certain pathological circumstances the ECM is modulated such that the structure of the tissue becomes damaged or destroyed [18, 19]. Two groups of extracellular proteinases that have been shown to play a role in the retinal revascularization seen in the later stages of diabetic retinopathy, are the matrix metalloproteinase 2 (MMP-2) and matrix metalloproteinase 9 (MMP-9). Plasmin in turn degrades components of the matrix and can be involved in the activation of the latent MMPs.
Regulation of MMPs in diabetes has been widely investigated. It has been shown that hy-perglycemia increased activity and expression of MMP-2 and MMP-9 in rat aortic smooth muscle cells and mouse vascular tissue and plasma [20, 21]. Further it was reported that MMP-2 & MMP-9 are increased in the epiretinal neovas-cular membranes of patients with proliferative diabetic retinopathy [22], as well as in retinas in an animal model of retinal neovascularization [23]. MMP-2 and MMP-9 have also been shown to have significantly increased levels of activation in vitreous samples from individuals with proliferative diabetic retinopathy [24]. These extracellular proteinases play a role in early diabetic retinopathy and alteration of the blood retinal barrier (BRB).
We hypothesized that Minocycline induced inhibition of MMP-2 and MMP-9 can be enhanced by Aspirin because of its COX and tissue plasmi-nogen activator (tPA) inhibitory action. This enhanced inhibition of MMP-2 and MMP-9 by this combination could be used for the treatment of diabetic retinopathy. In the present study we have targeted MMP-2 and MMP-9 overactivation in diabetic retinoopathy using a known MMP-2 and MMP-9 inhibitor, Minocycline with a non-selective COX inhibitor aspirin. Though Aspirin is nonselective COX inhibitor it is selected because of its inhibitory effect on tPA. This finding may indicate the potential benefit of enhanced MMP inhibition in easing the chronic consequences of diabetic retinopathy.
Materials and methods
Chemicals and drug solution preparation
Streptozotocin was purchased from Sigma (St. Louis, MO, USA). Mynocycline was procured from US Vitamins, India as a gift sample. Aspirin was purchased from Central Drug House India. Glucose oxidase-peroxidase (GOD/POD) glucose kit was purchased from Erba, India. All other chemicals were purchased from Merck (India). Minocycline was dissolved in distilled water. Aspirin was suspended in aqueous solution of 0.5% carboxy methyl cellulose. STZ was freshly dissolved in ice cold citrate buffer (pH 4.5) solution.
Animals
Male Wistar rats (210-250g) were purchased from the Haffkine Institue, Mumbai, India and were housed at a temperature of 25 ± 1°C and relative humidity of 45 to 55% in a clean environment under 12:12h light and dark cycle. The animals had free access to food pellets and filtered water was made available ad libitum. The research protocol was approved by Institutional Ethical Committee (IEC) of School of Pharmacy and Technology Management, NMIMS University Mumbai, constituted under Committee for the Purpose of Control and Supervision of Experiments on Animals (CPCSEA).
Induction of diabetes
A single dose (55 mg/kg, i.p.) of Streptozotocin (STZ) was used for induction of diabetes in rats. Age matched control rats received the equal volume of vehicle. Diabetes was confirmed after 48 h of STZ injection and again on weekly basis during the experiment. Plasma glucose levels were estimated using GOD/POD kit and rats with plasma glucose level > 350 mg/dl were considered for further studies.
Experimental design and drug treatment
Four weeks after the diabetic induction treatments were given for further 4 weeks (5th, 6th, 7th and 8th week). After 4 weeks, normoglycemic and diabetic rats were randomly divided into experimental groups and treated with drugs as follows: Diabetic vehicle treated Group 1 (DB + DW) was treated with distilled water 4 ml/kg, p.o.); Diabetic vehicle treated Group 2 (DB + 0.5 % CMC) was treated with 0.5% carboxymethyl cellulose solution (1 ml/kg, p.o.); Diabetic Group 3 (DB + MINO) was treated with minocycline alone (MINO, 50mg/kg p.o.); Diabetic Group 4 (DB + ASP) was treated with asprin alone (ASP, 50mg/kg p.o.); Diabetic Group 5 (DB + MINO + ASP) was treated with combination of minocycline (MINO, 50mg/kg p.o.) and aspirin (ASP, 50mg/kg p.o.); Age matched Normal Group 6 was untreated.
Electroretinography
Animals were dark-adapted for 12 h and prepared under dim red illumination. Rats were anesthetized with pentobarbital sodium at the dose of 70 mg/kg body weight and placed on a heating pad that maintained their body temperature at 35-36°C throughout the experiments. The pupils were dilated with a mixed solution of 0.5% tropicamide and 0.5% phenylephrine. The recording electrode was mounted in a Plexiglas ‘one-point-touch’ tube and placed on the corneal margin, just above the sulcus sclerae of the nasal canthus. The reference electrode was placed at the contrary (temporal) canthus, below the eyelid, just below the sclera rim, in contact with the conjunctiva. Recordings were performed with Power Lab system 2/25 (AD Instruments, New South Wales, Australia). Responses were differentially amplified at the gain of 1,000 times using an AC (alternate current)-coupled bioamplifier ML132 (AD Instruments) and filtered through a bandpass filter ranging from 0.3 to 500 Hz to yield b-waves. The amplitude and implicit time of the b-waves were measured and compared among age-matched nondiabetic controls and 8-week diabetic animals treated with vehicle, MINO per se, ASP per se and MINO plus ASP.
Sample preparation for morphological studies
The rats were killed under deep anesthesia. The eyes were enucleated and fixed in PBS-buffered 4% paraformaldehyde for 24 h. The orientation was marked at 12 clock of the limbus. The eyes were embedded in paraffin. Serial sections (5 μm) that passed through the optic nerve head and cutting marker were analyzed after staining with hematoxylin and eosin (HE) for light microscopy.
Measurement of the retinal thickness
The sectioned retinas were stained with HE. The thickness of the different retinal layers was measured at a 200× magnification, including: (1) outer limiting membrane to inner limiting membrane (OLM-ILM), (2) outer nuclear layer (ONL), and (3) inner nuclear layer (INL). Two measurements were taken on each section, at the two reference lines which were 1 mm away from the optic nerve on both superior and inferior sides.
SDS-PAGE zymography
Rats from each group were anesthetized deeply and then perfused transcardially with icecold PBS, pH 7.4. The left eye was removed quickly and frozen immediately on dry ice, and stored at -80°C. Eye samples were homogenized, centrifuged, supernatant was collected. Prepared protein samples were loaded and separated by 10% Tris-glycine gel. After separation by electrophoresis, the gel was stained with 0.5% Coomassie Blue R-250 for 30 min and then destained appropriately.
Quantitative assessment of BRB permeability
Vascular permeability in the retina was measured at 12 weeks of diabetes using an Evans blue quantitation technique [25]. Rats were anesthetized with ketamine (120 mg/kg) and acepromazine (1 mg/kg). The left femoral artery and vein were exposed and cannulated using a 0.28-mm diameter tubing (Scientific Commodities Inc., Lake Havasu City, AZ, USA) filled with heparinized normal saline (200 U/ml NS). Evans blue (45 mg/kg) was injected into the femoral vein. The animal was subsequently perfused via the left ventricle with approximately 60ml citrate buffered paraformaldehyde (1% wt/vol) at 37 ± 1° C over a 2 min interval to clear Evans blue from the circulation. The retina from the remaining eye was collected, dried for 2 h and weighed. The Evans blue dye was extracted by incubating each retina in 120 ml of formamide for 18 h at 70°C. The extract was centrifuged at 14000 g for 12 min at 25°C (Eppendorf, Hamburg, Germany). The absorbance of 80 ml of the supernatant was measured by spectrophotometry. To determine the time-averaged Evans blue plasma concentration, 0.2 ml of blood was withdrawn from the femoral artery 2 min after Evans blue injection. At 15-min intervals, 0.1 ml of blood was withdrawn concluding with a 0.2 ml sample of blood at the 2-h mark. The blood samples were centrifuged at 12000 r.p.m. for 30 min and the plasma diluted 1/10000 in formamide. Absorbance was measured by spectrophotometry at 620 and 740 nm, the absorbance maximum and minimum, respectively, of Evans blue in formamide. The concentration of dye in the plasma was calculated from a standard curve of Evans blue in formamide. The BRB permeability was calculated as follows:
[Evans blue (μg)/retina dry weight (g)] / [Time - averaged Evans blue concentration (μg)/plasma (μl) x circulation time (h)]
Statistics
Data are expressed as mean ± S.E.M. Statistical analysis was performed using Graph Pad Prism (version 4.0, Graph Pad Inc., San Diego, (CA) software. For multiple comparisons, one-way analysis of variance (ANOVA) was used. In case ANOVA shows significant differences, post-hoc analysis was performed with Tukey's test or Dunnet test, p<0.05 was considered statistically significant.
Results
Plasma glucose levels and body weight
STZ-induced diabetic rats showed approximately five-fold increase in the blood glucose levels after STZ administration, which was consistent throughout the study period (Table 1). Diabetic rats showed significant decrease in body weight as compared to age-matched control rats. Treatment with MINO, ASP or with combination of MINO and ASP did not produce any change in plasma glucose levels (Table 1).
Table 1.
Blood Sugar levels and body weights in diabetic and normal rats at 8th week after diabetes induction*
| Group | Blood Sugar Level | Body Weight |
|---|---|---|
| NORMO | 113 ± 15.1 | 271 ± 16.2 |
| DB+DW | 440 ± 23.7 ** | 219 ± 14.6 ** |
| DB + MINO | 449 ± 11.8 ** | 216 ± 19.7 ** |
| DB + ASP | 457 ± 12.4 ** | 222 ± 14.2 ** |
| DB + MINO + ASP | 447 ± 12.5 ** | 226 ± 17.1 ** |
Treatment with MINO, ASP and MINO in combination with ASP was not able to reduce BSL and showed no change in hyperglycemia. (n = 6 for all groups)
p<0.01 vs normal rats. DB + DW (Diabetic group treated with distilled water), DB + MINO (Diabetic group treated with Minocycline per se), DB + ASP (Diabetic group treated with Aspirin per se), DB + ASP + MINO (Diabetic group treated with Minocycline and Aspirin), DB + 0.05 % CMC (Diabetic group treated with 0.5 % Carboxymethyl Cellulose solution).
Electroretinography
ERG was performed as an objective assessment of retinal function of the rats. B-wave amplitudes were significantly reduced in diabetes rats. For 2-month diabetic rats, the B wave amplitude is about 55% of that of the normoglycemic control group (Figure 1) indicating the decreased function of the retina in diabetic rats. Treatment with combination of MINO and ASP significantly improved B-wave amplitude (457.2 ± 37.46 mV, n= 6, p<0.05) when compared with diabetic groups (321.8 ± 23.76 mV, n=6). B wave latency was increased significantly in diabetic group when compared with normoglycemic group (Figure 2). Treatment with MINO and ASP significantly attenuated B wave latency (152 ± 11 ms, n=6) when compared with vehicle treated diabetic group (140.62 ± 14.1 ms, n=6). Treatment with ASP per se and MINO per se also improved B wave amplitude and B wave latency. However it was not significantly different from vehicle treated diabetic group.
Figure 1.

Effect of four week treatment with MINO, ASP and MINO in combination with ASP on B wave amplitude. ** p<0.01 vs vehicle treated diabetic rats, (n = 6 for all groups). DB + DW (Diabetic group treated with distilled water), DB + MINO (Diabetic group treated with Minocycline per se), DB + ASP (Diabetic group treated with Aspirin per se), DB + ASP + MINO (Diabetic group treated with Minocycline and Aspirin), DB + 0.05 % CMC (Diabetic group treated with 0.5 % Carboxymethyl Cellulose solution)
Figure 2.

Effect of four week treatment with MINO, ASP and MINO in combination with ASP on B wave latency. * p<0.05 vs vehicle treated diabetic rats, (n = 6 for all groups) DB + DW (Diabetic group treated with distilled water), DB + MINO (Diabetic group treated with Minocycline per se), DB + ASP (Diabetic group treated with Aspirin per se), DB + ASP + MINO (Diabetic group treated with Minocycline and Aspirin), DB + 0.05 % CMC (Diabetic group treated with 0.5 % Carboxymethyl Cellulose solution).
Histology
Morphometric examination of HE-stained retinal paraffin sections demonstrated significantly reduced total retinal thickness in diabetic rats 2 month after diabetes onset in comparison with non-diabetic control rats (Figure 3). Primarily, the reduction in thickness occurred in the ONL in diabetic rats up to 2 month (n= 6; p<0.05, Figure 3). For INL in diabetes, there is no significant difference in 2-month diabetes compared with normal controls. Treatment with MINO plus ASP significantly attenuate ONL thickness when compared with vehicle treated diabetic group. There is no significant difference in the thickness of the inner or outer plexiform layers between diabetic and control rats (data not shown).
Figure 3.

Effect of four week treatment with MINO, ASP and MINO in combination with ASP on retinal thickness. * p<0.05, ** p<0.01 vs vehicle treated diabetic rats. (n = 6 for all groups) OLM -ILM (Outer Limiting Membrane to Inner Limiting Membrane), ONL (Outer Nuclear Layer), DB + DW (Diabetic group treated with distilled water), DB + MINO (Diabetic group treated with Minocycline per se), DB + ASP (Diabetic group treated with Aspirin per se), DB + ASP + MINO (Diabetic group treated with Minocycline and Aspirin), DB + 0.05 % CMC (Diabetic group treated with 0.5 % Carboxymethyl Cellulose solution).
SDS-PAGE zymography
Zymogram of eye homogenate showed high level of 72 kDa protein and 92 kDa protein in vehicle treated diabetic animals compared to normal animals (Figure 4 and 5). Treatment with MINO per se, ASP per se and MINO plus ASP reduced increased level of 72 kDa protein and 92 kDa protein levels. Reduction in 72 kDa and 92 kDa protein level is more with MINO plus ASP treated group compared to MINO per se and ASP per se treated group (Figure 4 and 5).
Figure 4.
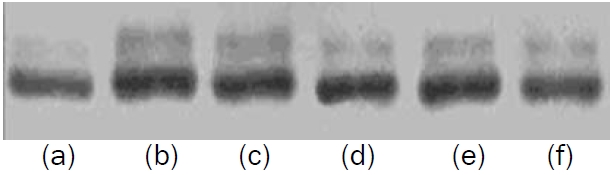
Effect of three week treatment with MINO, ASP and MINO in combination with ASP on retinal protein (72 KDa) level. (a) Normal (b) Diabetic + DW (Diabetic group treated with distilled water), (c) Diabetic + 0.5 % CMC (Diabetic group treated with 0.5 % Carboxymethyl Cellulose solution) (d) Diabetic + ASP (Diabetic group treated with Aspirin per se) (e) Diabetic + MINO (Diabetic group treated with Minocycline per se) (f) Diabetic + ASP + MINO (Diabetic group treated with Minocycline and Aspirin)
Figure 5.

Effect of three week treatment with MINO, ASP and MINO in combination with ASP on retinal protein (92 KDa) level. (a) Normal (b) Diabetic + DW (Diabetic group treated with distilled water), (c) Diabetic + 0.5 % CMC (Diabetic group treated with 0.5 % Carboxymethyl Cellulose solution) (d) Diabetic + ASP (Diabetic group treated with Aspirin per se) (e) Diabetic + MINO (Diabetic group treated with Minocycline per se) (f) Diabetic + ASP + MINO (Diabetic group treated with Minocycline and Aspirin).
BRB permeability increases in response to diabetes
One eye from each animal was used to quantitate the degree of vascular permeability of the retinal vessels. Evans blue dye was used to determine the extent of vascular permeability, a technique that effectively measures the movement of albumin from the plasma into the surrounding tissues. Following 8 weeks of diabetes, vehicle treated diabetic rats were found to have a nearly two-fold increase in retinal vascular permeability, 2.52 ± 0.15 μl/gh group, compared to normoglycemic rats 1.51 ± 0.21 μl/gh (Figure 6). The differences observed were statistically significant (P>0.05). Treatment with MINO plus ASP significantly attenuated vascular permeability (1.86 ± 0.15, n=6) when compared with vehicle treated diabetic group (Figure 6).
Figure 6.

Effect of four week treatment with MINO, ASP and MINO in combination with ASP on retinal permeability. * p<0.05, ** p<0.01 vs vehicle treated diabetic rats. (n = 6 for all groups) DB + DW (Diabetic group treated with distilled water), DB + MINO (Diabetic group treated with Minocycline per se), DB + ASP (Diabetic group treated with Aspirin per se), DB + ASP + MINO (Diabetic group treated with Minocycline and Aspirin), DB + 0.05 % CMC (Diabetic group treated with 0.5 % Carboxymethyl Cellulose solution)
Discussion
Grant et al. stated that diabetic retinopathy is the most severe ocular complication of diabetes [26]. The earliest clinical signs are microaneurysms and haemorrhages followed by dilated, tortuous irregular veins, and retinal nonperfusion, leading to retinal ischemia that ultimately results in neovascularisation. Diabetic macular oedema involves the breakdown of the bloodretinal barrier. Chronic hyperglycemia leads to oxidative injury, microthrombi formation, cell adhesion molecule activation, leukostasis, and cytokine activation [27]. The STZ-induced diabetic rat displays similar retinal morphologic and functional changes to those observed in the early stage of human diabetic retinopathy [7]. Diabetic rats induced by STZ have mostly been used as the animal model of type 1 diabetes.
In our study four week treatment with ASP per se, MINO per se and ASP plus MINO did not alter blood sugar level and body weight compared to vehicle treated diabetic group showed that treatment with combination is attenuating diabetic retinopathy through other than glucose lowering mechanism. It has been reported that electrophysiological changes in diabetes occur before the appearance of visible lesions [28-30]. Thus, an electrophysiological assessment of retinal function could be valuable in diabetics. Layton demonstrated that the B-wave amplitude was reduced in early diabetes [31]. Holopigian et al. reported that the B-wave was a sensitive indicator of diabetic retinopathy [32]. We observed 46% deficit in B wave amplitude in 8 weeks diabetic rats as compared to non-diabetic rats. These results are in accordance with the other reports, wherein similar reduction of b wave amplitude in streptozotocin-induced diabetic rats was reported [33]. MMP-2 and MMP-9 degrade the ECM components of the basement membrane. Their substrates include type IV collagen, fibronectine, elastin and denatured interstitial collagen [34]. In diabetics, hyperglycemia induces activation and expression of MMP-2 and MMP-9. Increased level of MMP-2 and MMP-9 leads to degradation of extracellular matrix and thickening of basement membrane [35]. This may lead to constriction of arteries. Nerve injury caused by constriction of arteries, results in ischemia of nerve tissue and ultimately neural cell death [36]. In our study decreased b wave amplitude and increased b wave latency in diabetic animals showed neuronal dysfunction. It has been shown that COX-2 inhibitors can influence MMP expression [37]. Studies suggest that presence of COX-2 induce biosynthesis of MMP-2 and MMP-9 from vasculature smooth muscle, endothelial cells and macrophages [35]. The stimulus for induction of COX-2 in diabetes is likely hyperglycemia, which has been shown to increase oxidative stress in variety of cells [38].
In our study we use MINO in combination with ASP to reduce increased concentration of MMP-2 and MMP-9 in diabetic rats. MINO is an inhibitor of MMP-2 and MMP-9. ASP can inhibit MMP-2 and MMP-9 biosynthesis by inhibiting COX-2 and by inhibiting tissue plasmiogen activator (tPA). In diabetics, hyperglycemia induces fibronectin (Fn) overexpression which degraded into proangiogenic Fn fragments (Fn-f). Fn-f has been shown to stimulate tPA catalyzed plasminogen activation. The plasmin produced activates proform of MMP-2 and MMP-9 [35]. Results of Zymography suggest that level of 72 kda protein and 92 kDa protein which are molecular weights of MMP-2 and MMP-9 are reduced with treatment of MINO plus ASP. Further these reductions were higher as compared to per se treated groups.
Histological studies were done to explore effect of MINO plus ASP to prevent or delay retinal neuronal apoptosis. Our results showed that the retinal thickness of the diabetic rats treated with MINO plus ASP were improved significantly. These data suggested that this combination might have the potential of rescuing the degenerating neurons of diabetic retinopathy.
Giebel et al suggested that elevated expression of MMPs in the retina of diabetic animals may facilitate an increase in vascular permeability [39]. In our study BRB permeability was increased in vehicle treated diabetic group which is in accordance with previous studies. MMPs are secreted as proenzymes that are activated autocatalytically or by other proteases such as uPA and plasmin. The serine proteinase uPA, through its conversion of plasminogen to plasmin, may directly affect the tight junction proteins between adjacent endothelial cells, or may function to activate MMP-2 and MMP-9 resulting in a breakdown of the tight junction protein occludin by these enzymes [39]. Treatment with MINO in combination with ASP attenuated the BRB permeability suggested that enhanced inhibition of MMP-2 and MMP-9 by the combination is responsible for improvement.
In conclusion, combination of MINO and ASP showed significant protection in diabetic neuropathy as evident from improvement in B wave amplitude and latency, retinal thickness and blood retinal permeability. This improvement is due to enhanced inhibition of MMP-2 and MMP-9 by the combination of MINO and ASP. This study suggests beneficial effects of treatment with combination of MINO and ASP in experimental diabetic neuropathy in rats and can be a potential approach for the treatment.
Acknowledgments
Authors wish to thank SPTM, NMIMS Management for providing all necessary facilities.
References
- 1.Cunha-Vaz JG, Fonseca JR, de Abreu JF, Ruas MA. Detection of early retinal changes in diabetes by vitreous fluorophotometry. Diabetes. 1979;28:16–19. [PubMed] [Google Scholar]
- 2.Ishibashi T, Tanaka K, Taniguchi Y. Disruption of blood-retinal barrier in experimental diabetic rats: An E.M. study. Exp Eye Res. 1980;30:401–410. doi: 10.1016/0014-4835(80)90055-x. [DOI] [PubMed] [Google Scholar]
- 3.Cogan DG, Toussaint D, Kuwabara T. Retinal vascular pattern. IV. Diabetic retinopathy. Arch Ophthalmol. 1961;66:366–378. doi: 10.1001/archopht.1961.00960010368014. [DOI] [PubMed] [Google Scholar]
- 4.Papachristodoulou D, Heath H, Kang SS. The development of retinopathy in sucrose-fed and streptozotocindiabetic rats. Diabetologia. 1976;12:367–374. doi: 10.1007/BF00420981. [DOI] [PubMed] [Google Scholar]
- 5.Antonetti DABA, Bronson SK, Freeman WM, Gardner TW, Jefferson LS, Kester M, Kimball SR, Krady JK, LaNoue KF, Norbury CC, Quinn PG, Sandirasegarane L, Simpson IA. JDRF Diabetic Retinopathy Center Group (2006) Diabetic retinopathy: seeing beyond glucose-induced mi-crovascular disease. Diabetes. 2006;55:2401–2411. doi: 10.2337/db05-1635. [DOI] [PubMed] [Google Scholar]
- 6.Gardner TW, Antonetti DA, Barber AJ, LaNoue KF, Levison SW. (2002) Diabetic retinopathy: more than meets the eye. Surv Ophthalmol. 2002;47:S253–262. doi: 10.1016/s0039-6257(02)00387-9. [DOI] [PubMed] [Google Scholar]
- 7.Zhang J, Wu Y, Jin Y, Ji F, Sinclair SH, Luo Y, Xu G, Lu L, Dai W, Yanoff M, Li W, Xu G-T. In-travitreal injection of erythropoietin protects both retinal vascular and neuronal cells in early diabetes. Invest Ophthalmol Vis Sci. 2008;49:732–742. doi: 10.1167/iovs.07-0721. [DOI] [PubMed] [Google Scholar]
- 8.Pradeepa R, Anitha B, Mohan V, Ganesan A, Rema M. Risk factors for diabetic retinopathy in a South Indian Type 2 diabetic population—the Chennai Urban Rural Epidemiology Study (CURES) Eye Study 4. Diabet Med. 2008;25:536–542. doi: 10.1111/j.1464-5491.2008.02423.x. [DOI] [PubMed] [Google Scholar]
- 9.Wong TY, Cheung N, Tay WT, Wang JJ, Aung T, Saw SM, Lim SC, Tai ES, Mitchell P. Prevalence and Risk Factors for Diabetic Retinopathy. The Singapore Malay Eye Study. Ophthalmology. 2008;115:1869–75. doi: 10.1016/j.ophtha.2008.05.014. [DOI] [PubMed] [Google Scholar]
- 10.Madsen-Bouterse SA, Kowluru RA. Oxidative stress and diabetic retinopathy: Pathophysiological mechanisms and treatment perspectives. Rev Endocr Metab Disord. 2008;9:315–327. doi: 10.1007/s11154-008-9090-4. [DOI] [PubMed] [Google Scholar]
- 11.Sundling V, Gulbrandsen P, Jervell J, Straand J. Care of vision and ocular health in diabetic members of a national diabetes organization: a cross-sectional study. BMC Health Serv Res. 2008;8:159. doi: 10.1186/1472-6963-8-159. [DOI] [PMC free article] [PubMed] [Google Scholar]
- 12.Kador PF, Robison WG, Kinoshita JH. The pharmacology of aldose reductase inhibitors. Ann Rev Pharmacol Toxico. 125:691–714. doi: 10.1096/fasebj.6.11.1644256. Ruderman NN, Williamson JR, Brownlee M (1992) Glucose and diabetic vascular disease 1985; FASEB J 6:2905-2914. [DOI] [PubMed] [Google Scholar]
- 13.Greene DA, Lattimer SA, Sima AAF. Sorbitol, phosphoinositide and the sodium-potassium ATPase in the pathogenesis of diabetic complications. New Engl J Med. 1987;316:599–606. doi: 10.1056/NEJM198703053161007. [DOI] [PubMed] [Google Scholar]
- 14.Lee TS, Saltsman KA, Ohashi K, King GL. Activation of protein kinase C by elevation of glucose concentration. Proposal for a mechanism in the development of diabetic vascular complications. Proc Natl Acad Sci USA. 1989;86:5141–5145. doi: 10.1073/pnas.86.13.5141. [DOI] [PMC free article] [PubMed] [Google Scholar] [Research Misconduct Found]
- 15.Massova I, Kotra LP, Fridman R, Mobashery S. Matrix metalloproteinases: structures, evolution, and diversification. FASEB J. 1998;12:1075–1095. [PubMed] [Google Scholar]
- 16.Yurchenko PD, Schittney JC. Molecular architecture of the basement membrane. FASEB J. 1990;4:1577–1590. doi: 10.1096/fasebj.4.6.2180767. [DOI] [PubMed] [Google Scholar]
- 17.Petitclerc E, Boutaud A, Prestayko A, Xu J, Sado Y, Ninomiya Y, Sarras MP, Jr, Hudson BG, Brooks PC. New functions for non-collagenous domains of human collagen type IV. Novel integrin ligands inhibiting angiogenesis and tumor growth in vivo. J Biol Chem. 2000;275(11):8051–8061. doi: 10.1074/jbc.275.11.8051. [DOI] [PubMed] [Google Scholar]
- 18.Woessner JF. Matrix metalloproteinases and their inhibitors in connective tissue remodeling. FASEB J 5. 1991;5:2145–2154. [PubMed] [Google Scholar]
- 19.Matresian LM. The matrix-degrading metalloproteinases. Bioassays. 1992;14:455–463. doi: 10.1002/bies.950140705. [DOI] [PubMed] [Google Scholar]
- 20.Hao F, Yu JD. High glucose enhance expression of matrix metalloproteinase-2 in smooth muscle cells. Acta Pharmacol Sin. 2003;24:534–538. [PubMed] [Google Scholar]
- 21.Uemura S, Matsushita H, Li W, Glassford AJ, Asagami T, Lee KH, Harrison DG, Tsao PS. Diabetes mellitus enhances vascular matrix metalloproteinase activity. Role of oxidative stress. Circ Res. 2001;88:1291–1298. doi: 10.1161/hh1201.092042. [DOI] [PubMed] [Google Scholar]
- 22.Das A, McGuire PG, Eriqat C, et al. Human diabetic neovascular membranes contain high levels of urokinase and metalloproteinase enzymes. Invest Ophthalmol Vis Sci. 1999;40:809–813. [PubMed] [Google Scholar]
- 23.Das A, McLemore A, Song WS, et al. Retinal neovascularisation is suppressed with a matrix metalloproteinase inhibitor. Arch Ophthalmol. 1998;117:498–503. doi: 10.1001/archopht.117.4.498. [DOI] [PubMed] [Google Scholar]
- 24.Noda K, Ishida S, Inoue M, et al. Production and activation of matrix metalloproteinase-2 in proliferative diabetic retinopathy. Invest Ophthalmol Vis Sci. 2003;44:2163–2170. doi: 10.1167/iovs.02-0662. [DOI] [PubMed] [Google Scholar]
- 25.Xu Q, Qaum T, Adamis AP. Sensitive blood-retinal barrier breakdown quantitation using Evans blue. Invest Ophthalmol Vis Sci. 2001;42:789–793. [PubMed] [Google Scholar]
- 26.Grant MB, Afzal A, Spoerri P, Pan H, Shaw LC, Mames RN. The role of growth factors in the pathogenesis of diabetic retinopathy. Expert Opin Investig Drugs. 2004;13(10):1275–1293. doi: 10.1517/13543784.13.10.1275. [DOI] [PubMed] [Google Scholar]
- 27.Qazi Y, Maddula S, Ambati BK. Mediators of ocular angiogenesis. J. Genet. 2009;88:495–515. doi: 10.1007/s12041-009-0068-0. [DOI] [PMC free article] [PubMed] [Google Scholar]
- 28.Fletcher EL, Phipps JA, Ward MM, Puthussery T, Wilkinson-Berka JL. Neuronal and glial cell abnormality as predictors of progression of diabetic retinopathy. Curr Pharm Des. 2007;13:2699–2712. doi: 10.2174/138161207781662920. [DOI] [PubMed] [Google Scholar]
- 29.Juen S, Kieselbach GF. Electrophysiological changes in juvenile diabetics without retinopathy. Arch Ophthalmol. 1990;108:372–375. doi: 10.1001/archopht.1990.01070050070033. [DOI] [PubMed] [Google Scholar]
- 30.Vadala M, Anastasi M, Lodato G, Cillino S. Electroretinographic oscillatory potentials in insulin-dependent diabetes patients: A long-term follow-up. Acta Ophthalmol Scand. 2002;80:305–309. doi: 10.1034/j.1600-0420.2002.800314.x. [DOI] [PubMed] [Google Scholar]
- 31.Layton CJ, Safa R, Osborne NN. Oscillatory potentials and the b-Wave: partial masking and interdependence in dark adaptation and diabetes in the rat. Graefes Arch Clin Exp Ophthalmol. 2007;245:1335–1345. doi: 10.1007/s00417-006-0506-0. [DOI] [PubMed] [Google Scholar]
- 32.Holopigian K, Greenstein VC, Seiple W, Hood DC, Ritch R. Electrophysiologic assessment of photoreceptor function in patients with primary open-angle glaucoma. J Glaucoma. 2000;9:163–168. doi: 10.1097/00061198-200004000-00006. [DOI] [PubMed] [Google Scholar]
- 33.Zhang Y, Wang Q, Zhang J, Lei X, Xu GT, Ye W. Protection of exendin-4 analogue in early experimental diabetic retinopathy. Graefes Arch Clin Exp Ophthalmol. 2009;247:699–706. doi: 10.1007/s00417-008-1004-3. [DOI] [PubMed] [Google Scholar]
- 34.Rundhaug JE. Matrix metalloproteinases, angiogenesis, and cancer. Clin Cancer Res. 2003;9(2):551–4. [PubMed] [Google Scholar]
- 35.Martin A, Komada MR, Sane DC. Abnormal angiogenesis in diabetes mellitus. Med Res Rev. 2003;23(2):117–45. doi: 10.1002/med.10024. [DOI] [PubMed] [Google Scholar]
- 36.Low PI. Pathogenesis of Diabetic Neuropathy. In: Joslin EP, Ronald CK, editors. Joshlin's Diabetes Mellitus, 2005. 14th edn. Philadelphia: Lippincott, Williams and Wilkins; pp. 841–842. [Google Scholar]
- 37.Ito H, Duxbury M, Benoit E, Farivar RS, Gardner-Thorpe J, Zinner MJ, Ashley SW, Whang EE. Fibronectin-induced COX-2 mediates MMP-2 expression and invasiveness of rhabdomyosarcoma. Biochem Biophys Res Commun. 2004;28:594–600. doi: 10.1016/j.bbrc.2004.04.070. [DOI] [PubMed] [Google Scholar]
- 38.Kadoglou NP, Daskalopoulou SS, Perrea D, Liapis CD. Matrix metalloproteinases and diabetic vascular complications. Angiology. 2005;56(2):173–89. doi: 10.1177/000331970505600208. [DOI] [PubMed] [Google Scholar]
- 39.Giebel1 SJ, Menicucci1 G, McGuire1 PG, Das A. Matrix metalloproteinases in early diabetic retinopathy and their role in alteration of the blood-retinal barrier. Laboratory Investigation. 2005;85:597–607. doi: 10.1038/labinvest.3700251. [DOI] [PubMed] [Google Scholar]