



Abstract
Study Design
In vivo measurement of lumbar facet joint surface area.
Objectives
To investigate lumbar facet joint surface area in relation to age and the presence of chronic low back pain.
Summary of Background Data
Facet joint surface area is an important parameter for understanding facet joint function and pathology, but information on the lumbar facet joint is limited especially in relation with age and low back pain symptoms.
Methods
In vivo measurements of the lumbar facet joints (L3/L4-L5/S1) were performed on 90 volunteers (57 asymptomatic subjects, 33 chronic low back pain subjects) using subject-based three-dimensional facet joint surface CT models.
Results
The facet joint surface area increased significantly at each successive inferior level. In the low back pain subjects over 40 years old, both superior and inferior facet surface areas increased except superior facets at L5/S1 compared to younger subjects. In the asymptomatic subjects over 40 years old, only the superior facets showed an increase in the L3/4 facet surface area compared to younger subjects.
Conclusions
The lumbar facet areas measured in vivo in the current study were similar to previous cadaveric studies. The lumbar facet area was significantly greater at the inferior lumbar levels and also increased with age. This age related increase in the facet joint surface was observed more in the low back pain subjects compared to asymptomatic subjects. The increase in the area of the facet joint surface is probably secondary to increased load-bearing in the lower lumbar segments and facet joint osteoarthritis.
Introduction
Increases in load transmission through the facet joints have been considered as important factors in osteoarthritic changes of the facet joint following intervertebral disc degeneration.1–3 The facet joint surface has significant effects on loading and stress transfer since the surface area is an essential parameter for calculation of stress and pressure on the facet joint.4,5 The information on facet surface area is also clinically important for designing spinal implants. Considerable variation of the facet shape has been noticed clinically.6 In cadaveric studies, geometrical parameters of the vertebral structure, such as spinal columns, vertebral body height, long and short diameter of the vertebra 7, and facet width 8 were measured. However, the information on the surface area of the lumbar facet joints is limited in the literature, due to the complex three-dimensional (3D) geometry of the facet joint surface.9 To our knowledge, there is no in vivo study to measure the lumbar facet joint surface area in 3D.
The purpose of the current study was to accurately determine the area of the facet joint surface in different age groups with and without chronic low back pain using a non-invasive 3D in vivo measurement technique.10,11
Materials and Methods
A total of 90 volunteers (mean age, 37.6 years [range, 22–59 years], mean weight, 75.4 kg [range, 45–129 kg], mean height 168.6 cm [range, 145–188 cm]) were used for this study (IRB Approval No. 00042801) (Table 1). All subjects signed an approved informed consent form and were asked clinical questions about their symptoms. Subjects with chronic low back pain (n=33) were categorized as “symptomatic” subjects. The remaining fifty-seven subjects were categorized as “asymptomatic.” Each subject was screened by the authors for pre-existing lumbar spine pathology and pain episodes for categorize each subject either for the asymptomatic group or the symptomatic group. Exclusion criteria for the asymptomatic group were low back pain, previous spinal surgery, history of low back pain, age over 60 years, obesity, claustrophobia or other contraindication to MR and CT imaging. Inclusion criteria for the symptomatic group were recurrent pain in the low back pain with at least two episodes of at least 6 weeks brought on by modest physical exertion. Exclusion for the symptomatic group were prior surgery for back pain, age over 60 years, claustrophobia or other contraindication to MR and CT imaging, severe osteoporosis, severe disc collapse at multiple levels, severe central or spinal stenosis, destructive process involving the spine, litigation or compensation proceedings, extreme obesity, congenital spine defect, previous spinal injury.
Table 1.
Subject Number Broken Down by Gender, Symptom and Age.
| Male (n = 49) |
Female (n = 41) |
|||
|---|---|---|---|---|
| Asymptomatic (n = 32) | Symptomatic (n = 17) | Asymptomatic (n = 25) | Symptomatic (n = 16) | |
| 20’s | 10 | 2 | 7 | 2 |
| 30’s | 11 | 9 | 10 | 5 |
| 40’s | 8 | 3 | 6 | 4 |
| 50’s | 3 | 3 | 2 | 5 |
Each subject underwent axial lumbar CT scanning at 1.0-mm slice thickness. Image data in a DICOM (Digital Imaging and COmmunication in Medicine) format from the L3 to S1 levels were transferred from the CT scanner (Volume Zoom, Siemens, Malvern, PA) to personal computers. Qualified orthopedic surgeons traced both superior and inferior facet joint surfaces slice by slice on the computer monitor using a pen type tablet digitizer (Wacom Intuos 3, Wacom, Saitama, Japan). During tracing the joint surface line, care was taken not to include osteophytes in the joint surface by referring gross geometry of the joint and structure of the subchondral bone. Fifteen equidistant points were generated on the joint surface line traced in each slice. Polygons were created by using 2 adjacent points in one plane and 1 point in the adjacent plane (Figure 1). Thus, the entire facet joint surface was modeled with the resulting polygon elements. The area of each polygon was computed by calculating the cross product of the two vectors that connected the dots on the adjacent lines. As such, a normal vector of the polygon was obtained simultaneously by the cross product (Figure 2). The area of the entire facet joint surface was calculated by summating the area of the polygons throughout the joint surface. The procedures of joint surface tracing, triangulation, 3D reconstruction, and area measurement were completed using a custom made software program (Microsoft Visual C++ 2003 under Microsoft Foundation Class programming environment).
Figure 1.

Fifteen equidistant points were generated on the joint surface line traced in each slice. Polygons were created by using 2 adjacent points in one plane (j or j+1) and 1 point in the adjacent plane (j +1 or j). For example, an arbitrarily triangle was consisted by Kth point in plane j, Kth point in plane j+1, and (K+1)th point in plane j+1. The area of each polygon was computed by calculating the cross product of the 2 vectors, A and B. A normal vector of the polygon, N, was obtained simultaneously by the cross product of the 2 vectors (the normal vector was not analyzed in the current study). Therefore, the entire facet joint surface was modeled with the resulting polygon elements.
Figure 2.
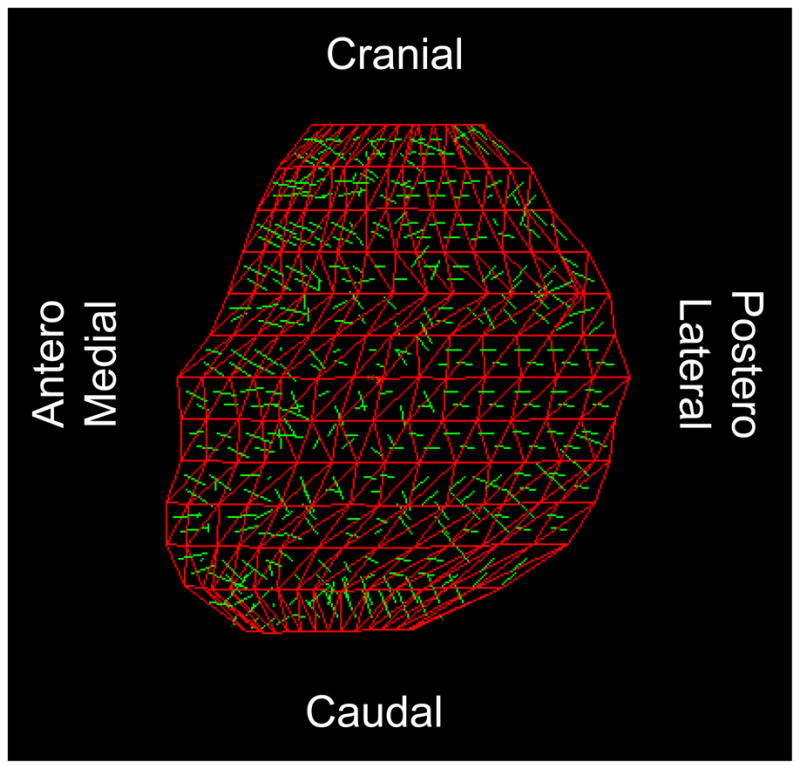
The 3D surface model of the facet joint consisting of polygons. Distribution of the normal vectors (green lines) indicates 3D curvature of the facet joint surface. The area of the entire facet joint surface was calculated by summating the area of the polygons throughout the three-dimensionally curved joint surface.
For data analysis, comparison between left and right facet surfaces was done by paired t-tests. Comparison between symptomatic vs. asymptomatic group was done by unpaired t-tests. Level and age effects were analyzed by a One-Way Analysis of Variance (ANOVA) with Fischer’s post hoc test. The results were presented by mean and standard error of the mean (SEM).
Results
The averaged surface area in all facets (a total of 1080 facets including left and right, superior and inferior of levels L3/L4 through L5/S1) was 190.6 ± 4.0 mm2. The facet areas in L3/L4, L4/L5 and L5/S1 were 158.2 ± 4.1 mm2, 189.8 ± 7.2 mm2 and 224.0 ± 8.6 mm2, respectively. The facet area at L5/S1 was significantly greater than those at L3/L4 and L4/L5 (p < 0.001). Similarly, the facet area at L4/L5 was significantly greater than that at L3/L4 (p < 0.005).
Figure 3 illustrates the comparison between superior and inferior facet joint surfaces at different spinal levels for left or right side. At the L3/L4 level, the superior facet area was significantly greater in the right side (p < 0.004) and tended to be greater in the left side (p = 0.08) compared to the inferior facet areas. At the L4/L5 level, the superior facet area was greater in the left side (p < 0.05) compared to the inferior facet area. At the L5/S1 level, however, the inferior facet area was greater (p < 0.002) compared to the superior facet area in the left side. There were no significant differences between the left and right superior facets or inferior facets at each level (superior facet at L3/L4; p = 0.21, inferior facet at L3/L4; p = 0.21, superior facet at L4/L5; p = 0.94, inferior facet at L4/L5; p = 0.57, superior facet at L5/S1; p = 0.28, inferior facet at L5/S1; p = 0.80). Therefore, averaged values between the left and right sides were used for the following analyses on the level and age effects.
Figure 3.

Facet joint surface areas (mm2) (mean±SEM) of superior and inferior facets at left or right side for L3/L4-L5/S1.
In the superior facets, overall facet surface area increased with age (20’s vs. 30’s; p = 0.053, 20’s vs. 40’s; p < 0.0005, 20’s vs. 50’s; p < 0.001, 30’s vs. 40’s; p < 0.05, 30’s vs. 50’s; p = 0.055). At L3/L4 in the symptomatic subjects, the facet area in 40’s was greater than those in 20’s (p <0.01) and 30’s (p < 0.05) and the facet area in 50’s was greater than that in 20’s (p < 0.05). At L3/L4 in the asymptomatic subjects, the facet area in 40’s was greater than those in 20’s (p <0.05). At L4/L5 in the symptomatic subjects, the facet area in 40’s was greater than those in 20’s and 30’s (p < 0.01) and the facet area in 50’s was greater than that in 20’s (p < 0.05). However, there were no significant differences in asymptomatic subjects at L4/L5 due to age. The facet area in the symptomatic subjects in 40’s was greater compared to that in the asymptomatic subjects in the age group of 40’s at L4/L5 (p < 0.01). At L5/S1, there were no significant differences among different age groups both in asymptomatic and symptomatic subjects (Table 2).
Table 2.
Superior Facet Joint Surface Area (in mm2) (mean±SEM).
| Level | L3/L4 |
L4/L5 |
L5/S1 |
|||
|---|---|---|---|---|---|---|
| Symptom | A | S | A | S | A | S |
| 20’s | 141 ± 11.7 a | 126 ± 14.0 a,b,c | 173 ± 24.7 | 143 ± 15.7 a,c | 192 ± 23.0 | 186 ± 27.4 |
| 30’s | 159 ± 10.8 | 170 ± 8.8 b,d | 175 ± 16.6 | 208 ± 20.8 f | 196 ± 12.9 | 241 ± 27.0 |
| 40’s | 181 ± 13.6 a | 217 ± 11.1 c,d,e | 190 ± 12.0* | 301 ± 33.6 c,f * | 209 ± 24.3 | 232 ± 45.4 |
| 50’s | 170 ± 10.2 | 177 ± 18.6 a,e | 180 ± 21.8 | 238 ± 21.6 a | 239 ± 35.7 | 267 ± 17.9 |
A: asymptomatic, S: symptomatic
p < 0.05 compared with the same alphabet data within the same level and symptom
p < 0.1 compared with the same alphabet data within the same level and symptom
p < 0.01 compared with the same alphabet data within the same level and symptom
p < 0.01 compared with the same asterisk data between asymptomatic and symptomatic subjects within the same level and age group.
In the inferior facets, overall facet surface area increased with age (20’s vs. 40’s; p < 0.02, 20’s vs. 50’s; p < 0.002, 30’s vs. 40’s; p = 0.08, 30’s vs. 50’s; p < 0.01). At L3/L4 in the symptomatic subjects, the facet area in 40’s was greater than those in 20’s (p < 0.01) and 30’s (p < 0.05). However, there were no significant differences in asymptomatic subjects at L3/L4. At L4/L5 and L5/S1 in the symptomatic subjects, the facet area in 50’s was greater than those in 20’s and 30’s (p < 0.05). However, there were no significant differences in asymptomatic subjects at L4/L5 and L5/S1. The facet area in the symptomatic subjects in 40’s was greater compared to that in the symptomatic subjects in the age group of 40’s at L4/L5 (p < 0.05). The facet area in the symptomatic subjects in 50’s was greater compared to that in the asymptomatic subjects in the age group of 50’s at L5/S1 (p < 0.05) (Table 3).
Table 3.
Inferior Facet Joint Surface Area (in mm2)(mean±SEM).
| Level | L3/L4 |
L4/L5 |
L5/S1 |
|||
|---|---|---|---|---|---|---|
| Symptom | A | S | A | S | A | S |
| 20’s | 144 ± 10.4 | 108 ± 8.6 a,b,c | 164 ± 16.1 | 148 ± 21.3 a,f | 215 ± 25.9 | 204 ± 47.8 d |
| 30’s | 141 ± 7.5 | 148 ± 13.1 a,d | 175 ± 13.2 | 170 ± 12.5 c,d | 218 ± 15.1 | 238 ± 24.5 f |
| 40’s | 155 ± 9.2 * | 190 ± 15.4 b,d * | 180 ± 14.0** | 259 ± 27.0 a.c ** | 224 ± 18.9 | 245 ± 43.0 |
| 50’s | 168 ± 8.8 | 155 ± 11.8 c | 173 ± 14.8 * | 227 ± 20.5 d,f * | 224 ± 29.5** | 319 ± 17.3 d,f ** |
A: asymptomatic, S: symptomatic
p < 0.1 compared with the same alphabet data within the same level and symptom
p < 0.01 compared with the same alphabet data within the same level and symptom
p < 0.05 compared with the same alphabet data within the same level and symptom
p < 0.1 compared with the same asterisk data between asymptomatic and symptomatic subjects within the same level and age group.
p < 0.05 compared with the same asterisks data between asymptomatic and symptomatic subjects within the same level and age group.
Discussion
Although the facet joint surface area is an important component to the function and osteoarthritic changes in the facet joint, there are only a few studies in the literature which measured facet surface area. 8,12–14 Panjabi et al 12,13 were the first to investigate facet joint morphology three-dimensionally in a quantitative manner. They measured heights and widths of the facet joint surface using images of the facet joint projected onto orthogonal planes and calculated the facet joint surface area by assuming facet joint shape an elliptical. Although the heights and widths of the facet joint surfaces were measured in 3D in this method, the facet joint surface areas were calculated in two-dimension ignoring the 3D curvature of the facet joint surfaces.
Tanno et al 14 measured facet joint surface area of the cadaveric spine using a unique method. In their method, a piece of soft wet paper was laid over the curved facet joint surface, molded to shape, and cut to make a flat cast of the joint surface, then the area of the cast was measured as an area of the facet joint surface. This method allowed measuring three-dimensionally curved facet joint surface area, however, they described that this method was technically demanding. It is obvious that this technique can be used only for cadaveric studies.
A new in vivo 3D measurement method has been developed in the current study to measure the lumbar facet joint surfaces. In this method, each facet joint surface was represented by approximately 300 small polygons and the entire joint surface area was calculated by summating the individual area of each polygon. Surface area measurement using a polygon-based model allows measuring the 3D surface area of complex 3D geometries. The polygon-based surface model of the facet joint can be created easily by reconstructing the CT images obtained from clinically available CT scanners. Although the methods, age and sample size are different, the facet joint surface areas measured by the in vivo method were comparable in the range/magnitude of areas with the previous in vitro studies using cadaveric spines (Table 4).
Table 4.
Comparison with Previous Studies on Lumbar Facet Joint Surface Area.
| Panjabi et al.13,14 | Tanno et al.16 | Current study | ||||
|---|---|---|---|---|---|---|
| Study design | Cadaveric | Cadaveric | in vivo | |||
| Sample size | 12 (M:8, F:4) | 23 (M:12, F:11) | 90 (M:49, F:41) | |||
| Age range (years) | 19 ~ 59 (mean: 46.3) | 45 ~ 95 (mean: 76.1) | 22 ~ 59 (mean: 37.6) | |||
| Facet joint surface area (mm2) | Sup a | Inf a | Sup | Inf | Sup b | Inf b |
| L3/L4 | 185 | 164 | 226 | 195 | 166 | 150 |
| L4/L5 | 210 | 175 | 268 | 227 | 196 | 182 |
| L5/S1 | - | 190 | 293 | 261 | 216 | 232 |
M: male, F: female, Sup: superior facet, Inf: inferior facet
Original data were provided right and left sides separately. Average values between right and left sides were calculated by current authors.
All age groups and asymptomatic and symptomatic groups are combined.
In the current study, the facet joint area increased significantly at the inferior lumbar levels regardless of age and symptoms. These results are consistent with the results from previous cadaveric studies. The averaged facet surface areas between the left/right sides were used in the current study, since there were no statistical differences between both sides. However, asymmetry between the left and right facet joint angles and sizes has been discussed in the literature and importance of considering the asymmetry has been emphasized in the study of the facet dimensions. 4,8,15,16 Masharawi et al 8 carried out a massive morphological study of the facet joint, using 240 adult cadaveric human spines from donors born between the years 1825 to 1910. They reported asymmetrical facet dimensions such as superior and inferior lumbar facet lengths, however, no information was provided on the facet joint surface areas. Although the facet joint surface areas were measured in the left and right sides in the above mentioned studies of Panjabi et al 12,13 and Tanno et al 14, no statistical comparisons between both sides were reported. Future studies on the asymmetry in the facet joint surface area will be required.
While the facet joint surface areas increased only in the superior facets at L3/L4 level from 20’s to 40’s in the asymptomatic subjects, increases in the facet areas with age were observed at L3/L4, L4/L5 and L5/S1 levels in the superior facets and at L3/L4 and L4/L5 levels in the inferior facets in the symptomatic subjects in the current study.
A possible explanation for the increase with age especially over 40 in the symptomatic subjects is the inclusion of osteophytes into the facet joints when the facet joint surface was traced in this study. As described in the methods section, the joint surface was traced excluding the osteophytes. However, it is not known well whether the osteophytes could be perfectly distinguished from the original facets. Gilbertson 17 conducted a detailed study on development of periarticular osteophyte formation using microradiographic, and fluorescent bone-labeling techniques in a canine knee osteoarthritis model. He reported that mature osteophytes were developed in 48 weeks having a mature trabecular structure with similar bone density of pre-existing trabeculae and free communication with the pre-existing bone marrow spaces. That study also found increased bone turnover in the pre-existing bone. Integration of osteophytes is clinically observed in human synovial joints such as knee and hip joints. Although whether the same phenomenon occurs in the facet joints is yet to be studied, in any case, it is possible to speculate that osteophytes are integrated completely to the original facet and contribute to an increase in overall facet joint surface area.
Another possible explanation for the increased joint surface area in the symptomatic subjects is that adaptation of the facets to the increased load through the facet joint occurred in order to reduce stress level on the joint surface. Alteration in the lord-bearing role of the facet joint may occur with disc degeneration because of the alterations in the structural properties of the disc.15,19–21 In addition, our laboratory showed that the intervertebral disc height in the symptomatic subjects was lower than that of asymptomatic subjects.22 Correlation between the intervertebral disc degeneration or disc height loss and the facet joint surface area will be investigated in a future study.
In conclusion, the lumbar facet areas measured in vivo in the current study were similar to previous cadaveric studies. The lumbar facet area was significantly greater at the inferior lumbar levels and also increased with age. This age related increase in the facet joint surface was observed more in the low back pain subjects compared to asymptomatic subjects. The increase in the area of the facet joint surface is probably secondary to increased load-bearing in the lower lumbar segments and facet joint osteoarthritis.
Key points
Information on the lumbar facet joint in relation with age and low back pain symptoms is limited.
The facet joint surface area increased as the spinal level decreased.
The lumbar facet area increased with age, especially in the low back pain subjects.
Acknowledgments
Supported by NIH P01 AR 48152
References
- 1.el-Bohy AA, Yang KH, King AI. Experimental verification of facet load transmission by direct measurement of facet lamina contact pressure. J Biomech. 1989;22:931–41. doi: 10.1016/0021-9290(89)90077-8. [DOI] [PubMed] [Google Scholar]
- 2.Fujiwara A, Tamai K, An HS, et al. The relationship between disc degeneration, facet joint osteoarthritis, and stability of the degenerative lumbar spine. Journal of Spinal Disorders. 2000;13:444–50. doi: 10.1097/00002517-200010000-00013. [DOI] [PubMed] [Google Scholar]
- 3.Yang KH, King AI. Mechanism of facet load transmission as a hypothesis for low-back pain. Spine. 1984;9:557–65. doi: 10.1097/00007632-198409000-00005. [DOI] [PubMed] [Google Scholar]
- 4.Masharawi Y, Rothschild B, Dar G, et al. Facet orientation in the thoracolumbar spine: three-dimensional anatomic and biomechanical analysis. Spine. 2004;29:1755–63. doi: 10.1097/01.brs.0000134575.04084.ef. [DOI] [PubMed] [Google Scholar]
- 5.Natarajan RN, Andersson GB, Patwardhan AG, et al. Study on effect of graded facetectomy on change in lumbar motion segment torsional flexibility using three-dimensional continuum contact representation for facet joints. Journal of Biomechanical Engineering. 1999;121:215–21. doi: 10.1115/1.2835106. [DOI] [PubMed] [Google Scholar]
- 6.Wagner S, Weckbach A, Muller-Gerbl M. The influence of posterior instrumentation on adjacent and transfixed facet joints in patients with thoracolumbar spinal injuries: a morphological in vivo study using computerized tomography osteoabsorptiometry. Spine. 2005;30:E169–78. doi: 10.1097/01.brs.0000157431.73969.81. [DOI] [PubMed] [Google Scholar]
- 7.Berry JL, Moran JM, Berg WS, et al. A morphometric study of human lumbar and selected thoracic vertebrae. Spine. 1987;12:362–7. doi: 10.1097/00007632-198705000-00010. [DOI] [PubMed] [Google Scholar]
- 8.Masharawi Y, Rothschild B, Salame K, et al. Facet tropism and interfacet shape in the thoracolumbar vertebrae: characterization and biomechanical interpretation. Spine. 2005;30:E281–92. doi: 10.1097/01.brs.0000164098.00201.8d. [DOI] [PubMed] [Google Scholar]
- 9.Fujiwara A, Tamai K, An HS, et al. Orientation and osteoarthritis of the lumbar facet joint. Clinical Orthopaedics & Related Research. 2001:88–94. doi: 10.1097/00003086-200104000-00015. [DOI] [PubMed] [Google Scholar]
- 10.Otsuka Y, An HS, Inoue N, et al. In vivo measurement of lumbar facet joint area in asymptomatic and chronic low back pain subjects. The 35th International Society for the Study of the Lumbar Spine Annual Meeting; 2008. [DOI] [PMC free article] [PubMed] [Google Scholar]
- 11.Otsuka Y, An HS, Inoue N, et al. In vivo measurement of lumbar facet joint surface area. The 53rd Annual Meeting of the Orthopedic Research Society; 2007. [Google Scholar]
- 12.Panjabi MM, Goel V, Oxland T, et al. Human lumbar vertebrae. Quantitative three-dimensional anatomy. Spine. 1992;17:299–306. doi: 10.1097/00007632-199203000-00010. [DOI] [PubMed] [Google Scholar]
- 13.Panjabi MM, Oxland T, Takata K, et al. Articular facets of the human spine. Quantitative three-dimensional anatomy. Spine. 1993;18:1298–310. doi: 10.1097/00007632-199308000-00009. [DOI] [PubMed] [Google Scholar]
- 14.Tanno I, Murakami G, Oguma H, et al. Morphometry of the lumbar zygapophyseal facet capsule and cartilage with special reference to degenerative osteoarthritic changes: an anatomical study using fresh cadavers of elderly Japanese and Korean subjects.[erratum appears in J Orthop Sci. 2005;10(2):240] Journal of Orthopaedic Science. 2004;9:468–77. doi: 10.1007/s00776-004-0807-2. [DOI] [PubMed] [Google Scholar]
- 15.Dai L, Jia L. Role of facet asymmetry in lumbar spine disorders. Acta Orthop Belg. 1996;62:90–3. [PubMed] [Google Scholar]
- 16.Noren R, Trafimow J, Andersson GB, et al. The role of facet joint tropism and facet angle in disc degeneration. Spine. 1991;16:530–2. doi: 10.1097/00007632-199105000-00008. [DOI] [PubMed] [Google Scholar]
- 17.Gilbertson EM. Development of periarticular osteophytes in experimentally induced osteoarthritis in the dog. A study using microradiographic, microangiographic, and fluorescent bone-labelling techniques. Ann Rheum Dis. 1975;34:12–25. doi: 10.1136/ard.34.1.12. [DOI] [PMC free article] [PubMed] [Google Scholar]
- 18.Dunlop RB, Adams MA, Hutton VM. Disc space narrowing and the lumbar facet joints. J Bone Joint Surg Br. 1984;66:706–10. doi: 10.1302/0301-620X.66B5.6501365. [DOI] [PubMed] [Google Scholar]
- 19.Panjabi MM, Krag MH, Chung TQ. Effects of disc injury on mechanical behavior of the human spine. Spine. 1984;9:707–13. doi: 10.1097/00007632-198410000-00010. [DOI] [PubMed] [Google Scholar]
- 20.Sato K, Kikuchi S, Yonezawa T. In vivo intradiscal pressure measurement in healthy individuals and in patients with ongoing back problems. Spine. 1999;24:2468–74. doi: 10.1097/00007632-199912010-00008. [DOI] [PubMed] [Google Scholar]
- 21.Shirazi-Adl A. Biomechanics of the lumbar spine in sagittal/lateral moments. Spine. 1994;19:2407–14. doi: 10.1097/00007632-199411000-00007. [DOI] [PubMed] [Google Scholar]
- 22.Takatori R, An HS, Inoue N, et al. Relationship between lumbar disc height and facet space width in asymptomatic and chronic low back pain subjects. The 33rd International Society for the Study of the Lumbar Spine Annual Meeting; 2006. [Google Scholar]