Abstract
High resolution (HR) multi-electrode mapping is increasingly being used to evaluate gastrointestinal slow wave behaviors. To create the HR-activation maps from gastric serosal electrode recordings that quantify slow wave propagation, it is first necessary to identify the activation time (AT) of each individual slow wave event. Identifying these ATs has been a time consuming task, because there has previously been no reliable automated detection method. We have developed an automated AT detection method termed falling-edge, variable threshold (FEVT) detection. It computes a detection signal transform to accentuate the high ‘energy’ content of the falling edges in the serosal recording, and uses a running median estimator of the noise to set the time-varying detection threshold. The FEVT method was optimized, validated, and compared to other potential algorithms using in-vivo HR recordings from a porcine model. FEVT properly detects ATs in a wide range of waveforms, making its performance substantially superior to the other methods, especially for low signal-to-noise ratio (SNR) recordings. The algorithm offered a substantial time savings (>100 times) over manual-marking whilst achieving a highly satisfactory sensitivity (0.92) and positive-prediction value (0.89).
Index Terms: gastric electrical activity, gastric slow wave, activation map, high-resolution mapping, energy operator
I. Introduction
The stomach and small bowel have an omnipresent electrical activity, known as slow waves, which serve to initiate and organize the rhythmic muscle contractions that enable digestion [10]. In the normal human stomach, slow waves originate near the proximal greater curvature of the corpus, and propagate toward the pylorus at a rate of three cycles per minute (cpm). In the small intestine, slow waves originate in the proximal duodenum, and propagate distally at a frequency ranging from 12 cpm (duodenum) to 8-9 cpm (distal ileum) [3]. Abnormalities of slow wave activity are known to contribute to common and highly symptomatic dysmotility conditions, such as gastroparesis, a disorder in which the stomach fails to empty normally [2].
The recent advent of high-resolution (HR) mapping has proved to be an important advance for studying slow wave behaviors [18], [19]. HR mapping involves the placement of spatially-dense arrays of electrodes on the surface of an intact tissue along GI tract, and simultaneously recording the resultant signals across a large number of sites. Typically, tens to hundreds of electrodes are employed in HR mapping, typically positioned on a rectangular lattice less than 10 mm apart, covering an area of > 50 cm2 [5], [19]. Graphical “activation maps” are generated from these recordings, providing a detailed spatiotemporal description of slow wave propagation across an area of tissue. HR mapping has recently been used to provide improved descriptions of normal and dysrhythmic gastric slow wave propagation in the stomach and small intestine of animal models [18], [19], and is now being adapted for human research [25].
Due to the large number of electrodes used and the length of recording times, a vast quantity of electrophysiological data is accumulated during HR mapping studies. A key issue in the analysis of HR mapping data sets is the identification of activation times (ATs) of the slow wave event for each electrode site, in order to determine the precise timing of electrical events that characterize gastrointestinal slow wave propagation [5], [18], [19]. At present, the common practice is to visually assess the traces from every electrode channel, and then to manually mark the appropriate times in the graphical interface of software programs such as SmoothMap [15]. This is an extremely time intensive task: for example, in a five minute gastric recording segment using 192 electrodes there could be up to 2880 ATs to individually locate, assess and manually mark. Furthermore, the accuracy of the manually marked ATs is dependent on the experience and interpretation of the marker. The development of an automated and accurate slow wave AT marking algorithm would greatly improve the efficiency of analyzing HR mapping results.
Reliable systems for the automated identification of electrical events are in widespread use in for cardiac and neural electrophysiology [13], [31], but no such tool has been developed and widely adopted for gastrointestinal (GI) studies. Existing cardiac [14] and neural methods [20] are specialized for detection of waveform features (e.g., the QRS peak) which are not characteristic of gastrointestinal (GI) waveforms. Therefore, cardiac and neural event detection techniques can motivate methods for, but can not be directly applied to, GI HR studies. A number of previous studies have attempted to develop methods for the automated processing and analysis of GI electrical activity [4], [27], [28]. However, these studies were based on a previous generation of experimental and computational technologies that are now outmoded. More recently, Lammers et al. have described an “amplitude-sensitive differentiator” (ASD) based algorithm, which was used in the the context of the automated on-line analysis of recordings from chronically-instrumented conscious dogs [16]. The performance of this algorithm, however, was not quantitatively evaluated, nor validated using a range of commonly observed waveforms and SNRs. In particular, the flexible printed circuity board (PCB) electrodes that are currently used for human HR mapping achieve a significantly lower signal to noise ratio (SNR) than the silver electrodes used by Lammers et al. in their on-line analysis study [5], in which context Lammers' ASD algorithm may be less effective, as it is unlikely that their algorithm would accurately identify slow waves in lower SNR signals. A new automated slow wave AT detection method is required, that is optimized, validated, and appropriate for use with multi-electrode recording arrays in current use, and in the context of modern signal processing capabilities.
The aim of our current work was to develop a novel algorithm for the automated marking of gastric slow wave activity that performs robustly in response to variations in the type and quality of waveforms recorded. Importantly, this algorithm is the first to be validated and optimized for use in in vivo HR mapping studies. The algorithm has also been found to perform well in the context of the more difficult low-SNR signals achieved by the flexible PCBs, and it will therefore will useful for analyzing the results of human studies where the flexible PCBs have been employed.
II. Methods
A. Experimental Methods
Porcine experiments were conducted at Vanderbilt University, USA, and The University of Auckland, New Zealand, following ethical approval from both institutional ethics committees. Anesthesia, animal care, surgery and subsequent euthanasia were performed in a similar manner to that described in our previous work [5]. Briefly, test subjects were anesthetized, and a midline incision was made to gain access to the stomach. Gastric electrical activity was directly measured by situating an electrode array directly on the stomach, as illustrated in Figure 1.
Fig. 1.
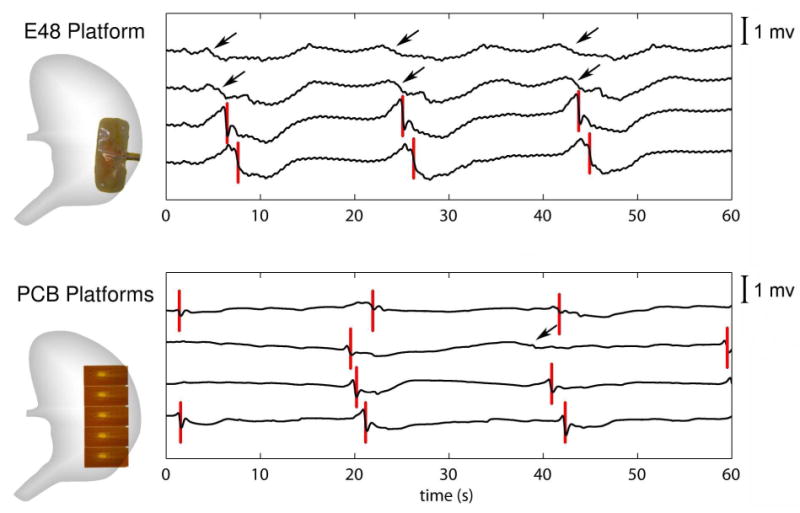
PCB and E48 Electrode Recording Platforms and Representative Recordings. Five tessellated PCB platforms (each with a 4 × 8 electrode grid, spaced at 7.62 mm) positioned on gastric corpus (left, top) with representative recordings form four channels (right, top). Resin-embedded silver wire (E48) platform (4 × 12 electrode grid, spaced at 9 mm) positioned on the gastric corpus (left, bottom) with representative recordings from four channels (right, bottom). Red vertical marks indicate manually marked activation times. Black arrows indicate possible slow wave events, that were not marked by the majority of the manual markers because the morphology was not typical (refer to Section II-B).
Two types of electrode arrays are presently used in gastrointestinal GI HR mapping research, and signals recorded from both array types were evaluated in this study. The first array (the “E48”) is a custom-built platform with 48 silver wire electrodes embedded in a rigid silicone platform (4 × 12 configuration; inter-electrode distance 9 mm). The second was a flexible PCB platform with 32 gold-plated electrode contacts (4 × 8 configuration; inter-electrode distance 7.62 mm) and copper connecting channels embedded in polyimide base. The PCB platform is suitable for use in humans due to its ability to be easily sterilized, and can be disposed of if necessary. Previous studies have shown that the PCB platforms demonstrate a lower SNR than the silver wire platforms (9.7 dB vs 18.7 dB) [5]. The lower SNR of the PCB electrodes is likely partly due to the fact that they are cannot be extensively shielded, unlike the custom-built platforms. In addition, gold is a less ideal contact material for bioelectrodes than silver [22].
Recordings from both types of array were taken from the anterior serosal surface of the porcine gastric corpus (see Fig 1), as described in a previous study [5]. We selected one 180 sec data segment from each of five experiment animals to validate and compare the automated marking methods. These 180 sec segments were selected because we considered them to be representative of the recording quality achieved in our two laboratories. Two segments were recorded via the E48 platform (48 channels in each segment for a total of 96 E48 channels). Three segments were recorded via 5 tessellated PCB arrays. A selection of channels was chosen from each of these PCB studies, in order to match the recording area of the E48 platform studies—48 channels from each of two PCB data segments, and 41 from the remaining segment (the other 7 were off the active tissue area)—giving PCB 131 channels in total.
Unipolar recordings were acquired from the electrode platforms via the ActiveTwo System (Biosemi, Amsterdam), at a recording frequency of 512 Hz. The common mode sense electrode was placed on the lower abdomen, and the right leg drive electrode on the hind leg. The PCB electrode platforms were connected to the ActiveTwo via a 1.5 m 68-way ribbon cable, which was in turn fiber-optically connected to a notebook computer. The E48 platform was connected to the same system via a custom-build shielded cable. The acquisition software was written in Labview 8.2 (National Instruments, TX, USA).
The acquired signals were pre-processed by applying a 2nd order Butterworth digital band pass filter (using MATLAB; Natick, MA). The low frequency cutoff was set for 1 cpm; the high frequency cutoff was set to 60 cpm. The low frequency cutoff was chosen so that slow baseline wander typical of serosal electrode recordings would be diminished without altering the slow wave waveform. The high frequency cutoff was chosen to suppress high frequency noise, but not alter the fast, negative-going component in the recording that marks the arrival of the slow wave at an electrode. These pre-processed signals were input to the automarking algorithm described herein.
B. Manual marking of slow wave activation times
The slow wave ATs in each selected data segment were first manually marked to provide a baseline against which the automated detection methods could be compared. Within the electrode signal V (t), there are three dominant features of a slow wave event: (1) a small magnitude upstroke, immediately preceding (2) a fast, large magnitude, negative deflection , followed by (3) a relatively long (≈ 5 s) plateau phase that decays slowly back to baseline (Fig 1). The fast negative-going transient corresponds with the depolarization wave front of the propagating slow wave, signaling the arrival of the slow wave at the recording electrode site. The point of most negative gradient during a slow wave is determined to be the AT [5], [17].
Three investigators with experience in slow wave identification independently manually marked each data segment, by visually locating slow wave events according to the above morphology, and then manually selecting the point of apparent steepest negative slope in SmoothMap v3.03 [15]. Signal noise such as respiration artifacts can mimic slow wave morphology, so it is usual for manual markers to also ensure that there is an appropriate “time lag” between the ATs of events in adjacent channels (Fig 1). When the morphology and/or time lag was not clearly demonstrated, a possible slow wave event was not marked. Furthermore, an AT was chosen only if all three markers had marked the same event. Thus, the hand-markers set of ATs was conservative, and more slow wave events may exist than those manually marked.
C. Basic Constant Threshold (BCT) Detection Algorithm
Our initial algorithm—termed Basic, Constant Threshold Detection (BCT)—was motivated by the observation that the relevant component representing the AT in the gastric serosal potential V (t) (the fast, large negative transient) can be viewed as a spike-like waveform embedded in a more slowly oscillating background signal (plateau slowly recovering to baseline). Also, a respiration artifact is prevalent in many serosal recordings, superimposing another slowly oscillating component. Therefore, the main step of the BCT algorithm was to transform the signal V (t) into one which accentuates the high-frequency, large-amplitude content of the AT component.
D. Signal Transforms
We evaluated four distinct, but related, signal transforms to accomplish this task, which are outlined below. The signal processing procedures described herein were applied to recordings from all electrode sites, treating each electrode individually. For the remainder of this manuscript we denote the electrical potential recorded by a serosal electrode as V (t), which contains N discretely sampled points: t ∈ tn = nTs, n = 1, 2, 3,…, N; Ts = 1/fs). For simplicity of notation, in the remainder of this section we use only the integer subscript n to denote discrete time samples tn (for instance, tn → n; V(tn) → Vn).
1) Negative Derivative Transform
The basis for the “Negative Derivative” (ND) method was originally introduced in [7]. The main idea is to compute the first-derivative and consider only those values which correspond to negative deflections in V (t). The first derivative was approximated using the three-point central difference: . All values of dV/dt greater than zero were set to zero, as they correspond to upward deflections. Finally, the ND detection signal was inverted (multiplied by -1) so that a negative deflection in V (t) manifested as a positive deflection (“energy pulse”) in the ND signal:
| (1) |
2) Amplitude-Sensitive Differentiator Transform
The core idea of the “Amplitude-Sensitive Differentiator” (ASD) method, originally introduced in [16], is to enhance the large negative-flank in V (t) that represents the AT by multiplying the electrode signal and its first-derivative, and subsequently taking the absolute value of this quantity:
| (2) |
The first-derivative is computed as described above, but without explicitly setting any points of the signal to zero. The ASD signal should contain large positive deflections (‘pulses’) where the electrode signal contains a large negative deflection
3) Non-Linear Energy Operator Method
The non-linear energy operator (NEO) (originally introduced by Kaiser and Teager [11], [12]) accentuates the high-frequency content in the signal, making it efficacious or detection of spike-like (fast, large amplitude) events embedded in low frequency noise [23].
The non-linear energy operator is of the form [11]:
| (3) |
where the over-dot notation indicates a derivative with respect to time.
In our context, the NEO of the electrode signal can be computed as [11]:
| (4) |
The arrival of each slow wave event should manifest as a relatively large discrete pulse of energy in the NEO transform signal, and the AT should occur at the rising edge of an energy pulse.
4) Fourth-order Differential Energy Operator Transform
The concept of energy operators can be generalized further into higher order differential energy operators (DEOs), which are reported to be useful for estimating the instantaneous energy in a signal [21]. In particular, we computed applied the 4th order DEO (DEO4)—also termed the ‘energy acceleration’—to the electrode signal, which is of the form [21]:
| (5) |
where the parentheses in superscript indicate the order of the derivative taken with respect to time. For a discretely sample signal, this quantity is computed as [21]:
| (6) |
Like the NEO signal, the negative transient in the electrode signal marking the arrival of the slow wave should manifest as a discrete positive pulse of energy in the DEO4 signal.
E. Relationship of Different Transforms
The four transforms described above can all be thought of as representing different orders of (modified) DEOs. Specifically, the NEO signal is equivalent to the 2nd order DEO signal [21]. Also, the ASD signal is equivalent to a modified form of the 1st-order DEO; and the ND signal can be thought of as a modified form of the 0th-order DEO. If we approximate the fast deflection in V (t) representing the arrival of the slow wave as a cosine, Vfast(t) = A cos(ωt), then the amplitude of the corresponding segment in the ND signal is proportional to Aω; the ASD signal to A2ω; the NEO signal to A2ω2; and the DEO4 signal to A2ω4 [21].
F. Smoothing the Detection Signal
After having computed the detection signal transform, X (t) (according to any of the four methods described above), it is subsequently smoothed with a moving average filter of width p.
| (7) |
| (8) |
where * denotes convolution, and S(t) is the (optionally) smoothed detection signal transform.
Smoothing can help improve the SNR in the detection signal by reducing high frequency noise. The width of the smoothing window p is a tunable parameter in our algorithm. We evaluated smoothing window widths corresponding to 0 (no smoothing), 1, 2, 3, and 4 seconds.
G. Computing the Constant Threshold
After the smoothed detection signal was computed, a constant detection threshold Sthresh was computed as a multiple of the estimated RMS noise present during quiescent periods in S(t). Specifically,
| (9) |
where η was another tunable parameter in our algorithm. The value for σ̂ was computed as the median of the absolute deviation of the S(n), following [24]:
| (10) |
where is the sample mean of S(t) and M{·} denotes the sample median. It is a robust estimate of the standard deviation during the quiescent segments of the smoothed detection signal because it is not sensitive to outliers—i.e., the points in S(n) that represent ATs themselves [24]. The factor of 0.6745 in the denominator derives from approximating the standard deviation of a sample using its median [24].
H. Identification of Individual Events
The next step was to find the times at which S(t) exceeded a threshold value. These times define the times at which slow wave events might occur. We denote the list of times meeting this condition as:
| (11) |
Next, in order to identify individual slow wave events from a trace containing a multiple slow-wave events, we employed a simple clustering algorithm based on a temporal closeness criterion. Specifically, two consecutive members of the list u are members of the same cluster—i.e., regarded as representing the same slow wave event—if they were close enough in time:
| (12) |
where i indexes the times listed in u, and Tr is termed the “refractory period” (see below). Otherwise, where a large gap in time occurred (ui+1 − ui > Tr) a new cluster was started to represent the next individual slow wave event. At the end of this process, there are k clusters of points, denoted as U(k), where each individual cluster delimits the time-window within which an AT occurs. The AT was defined as the time at which the maximally negative derivative occurs within each of these k time-windows:
| (13) |
The quantity Tr is termed the “refractory period”, as it represents the minimum difference in time required to distinguish between two successive slow wave events. It is also a tunable parameter in our algorithm. We chose to test refractory period values of 2–6 seconds based on biophysical considerations of the gastric slow wave recordings, namely that the slow wave should be periodic with a dominant frequency of 0.05 Hz (period = 20 sec), and that the smoothed detection signal S(t), may contain pulses of high energy content several seconds in duration. In addition, since some gastric slow wave waveforms may be fractionated [8], [19], there is a possibility of two main energetic phases (fast, large, downward transients) occurring up to 2 seconds apart. Thus, the refractory period must be tuned to be short enough to properly partition distinct slow wave events, but must be long enough to properly accommodate detection of fractionated waveforms as single events.
I. Falling-Edge, Variable-Threshold Method
The results obtained by applying our initial BCT algorithm to the gastric serosal electrical recordings (GSERs) provided valuable insights to help guide development of a significantly more robust algorithm (see Results). This more sophisticated algorithm—termed the Falling-Edge, Variable Threshold (FEVT) Method—builds on the BCT method described in the sections above. The motivation for this updated, more powerful algorithm was motivated by the following observations.
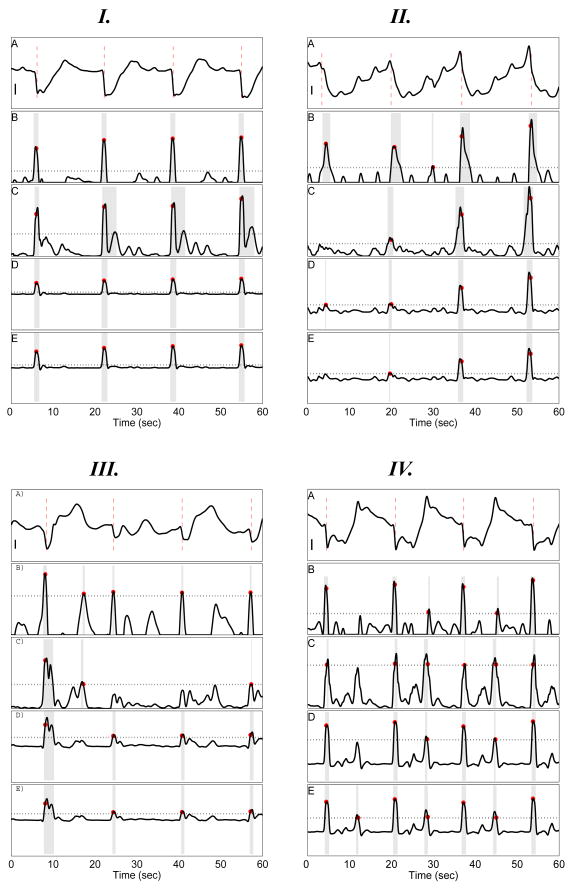
Some GSERs, such as the one illustrated in Fig 2 IV A, exhibit a relatively fast recovery to baseline. This produces two large pulses in the ASD, NEO and DEO4 detection signals per each slow wave (e.g. Fig 2 IV C–E; t = 4 and 12 s), leading to erroneous double counting—the second mark in a set of two should not be marked. The updated FEVT algorithm, therefore, incorporates a falling-edge (FE) detector as an additional signal processing stage to avoid double counting and mis-marking some ATs.
Multiple slow wave events recorded by an electrode are not identical over time. For example, Fig 2 C-E shows that the third and fourth pulses in ASD, NEO, and DEO4 detection signals have much larger amplitudes than the first and second pulses, even though a substantial difference in the serosal recordings (Fig 2 A) may not be clearly apparent to the naked eye. This large amplitude difference leads to missed detection of the smaller amplitude events (e.g., Fig 2 II C-E.) Thus, instead of using a constant threshold for slow wave event detection, the FEVT algorithm implements a time-varying threshold (VT) to aid in the detection of ATs when recorded serosal waveforms may change over time.
Fig. 2.
Four Serosal Electrode Signals and Corresponding Detection Signal Transform Outcomes. Each panel I–IV illustrates a serosal electrode signal (A) along with the corresponding autodetection result using each detection signal transform in panels B–E: Negative Derivate (ND; B); Amplitude Sensitive Differentiator (ASD; C); 2nd-order Non-linear Energy (NEO; D); and 4th-order Differential Energy (DEO4; E). I A: Stereotypical high SNR recording. II A: Waveform with slow downward deflection. III A: low SNR recording with wandering baseline waveform. IV A: Fractionated waveforms with fast repolarization upstroke. Scalebars in I, II, and IV: 300 μV. Scalebar in III: 500μV. In B–E gray rectangles delimits the time-window of each identified slow wave event (see Section II-H. Red circles indicate the identified ATs. The black dotted horizontal line indicates the constant event detection threshold (see Section II-G). All ATs are properly detected for signal I. For signal II, only the NEO transform properly detects all four ATs; ASD and DEO4 each miss detection of the first event at 4 s, while ND detects one false-positive at 29s. For signal III, ND yields a false-positive at 15 s, ASD misses detection of the third event at 41 s, while NEO and DEO4 properly detect all ATs. For signal IV, the fast repolarization upstroke causes multiple false-positives to be detected for all signal transform methods.
1) Falling-Edge Detector and FEVT Signals
To rectify the issue of double-counting noted above, we made use of a falling-edge detector signal, E(t), to amplify the large-amplitude, high-frequency content associated only with negative deflections, suppressing positive-going transients in the process. It is formed by convolving the serosal electrical potential signal with an “edge-detector kernel” dNedge:
| (14) |
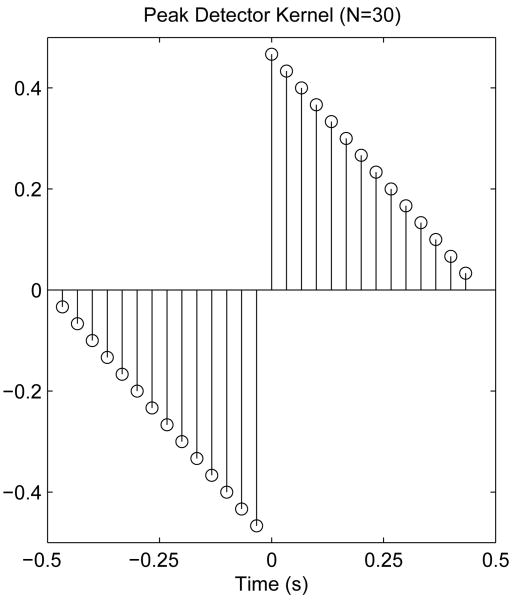
where * denotes the convolution operator. We employed the edge-detector kernel originally introduced by Sezan [30], which is formed from the convolution of a “smoother” with a “differencer” (see [30] for full details). Nedge defines the width of the kernel. We chose a fixed value of Nedge = 30 (see Fig 3), a one-second wide kernel at fs = 30 Hz, to correspond to the time-scale of a typical large, negative transient. The kernel width could be a tunable parameter, but we did not examine the effect of varying its value in this study because we were already smoothed the detection signal (ND, ASD, NEO, or DEO4).
Fig. 3.
Peak-detector kernel employed in the robust FEVT algorithm. The peak detector kernel is convolved with the serosal electrode signal to help identify and amplify high frequency, large amplitude content of negative-going transients only. A kernel width of 30 points—corresponding to 1 second—was used.
A falling edge (negative transient) in V (t) produces a positive deflection in E(t) (and vice-versa). When V (t) remains relatively constant, E(n) is approximately 0. Thus, E(t) is large and positive when V (t) contains a falling edge, and is negative for a rising edge. Therefore, in order to help focus our slow wave detection algorithm on only the falling edges in V(t), we computed the (element-wise) product of the smoothed detection signal S(t) with the falling edge detection signal E(t), setting all negative values to zero. The resulting signal is termed the FEVT signal, F(t), which is thus summarized:
| (15) |
2) Computing the Time Varying Threshold
In order to rectify the issue with slight variations in the GSER waveforms leading to some events escaping detection, the FEVT method incorporates a time-varying detection threshold. Specifically, the time-varying threshold is based on the running median of the absolute deviation for time t using a window of half-width τHW centered at t for the FEVT signal, F(t):
| (16) |
where is the sample mean of F(t) in the time range [t − τHW, t + τHW] and M{·} denotes the sample median, as before. The variable threshold was then defined as: Fthresh = η × σ̂(t), where η is a tunable parameter, as before. The moving median window must be long enough to include the quiescent period in F(t) between the pulses of energy associated with the AT, but not so long that one slow wave can unduly influence the threshold defined for an event occurring much earlier or later. We tested values of 15, 30, and 45 seconds, which corresponds to about 1–2 full cycles 3 cpm gastric slow-wave waveform.
J. FEVT Algorithm Outline
The outline of the full FEVT algorithm is summarized as follows (see also Fig 4):
Fig. 4.
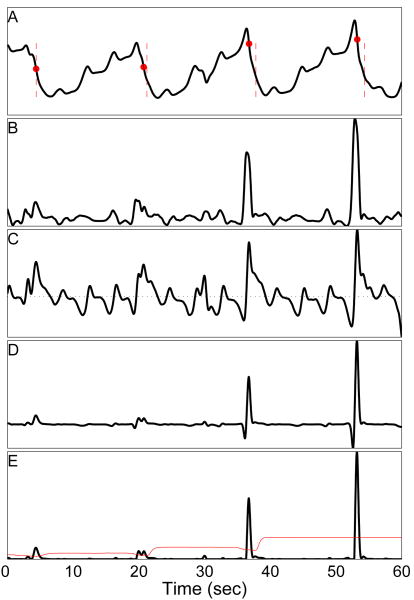
Illustration of Signal Processing Sequence for Negative-Edge-Detector Method with Variable Detection Threshold. A: Example serosal electrode recording (same signal as is shown in Figs 2 and 5, II A). Red vertical dashes denote hand-marked ATs, while filled red circles indicate ATs detected with the Peak-Detector, Variable-Threshold algorithm. Note that the small difference (≈ 1 s) in automated and hand-marked ATs, especially in the last two marks. It was typical of the hand-marker ATs to precede the automated marks by 0.2–0.3 sec (see Section IV-A). All four automated marks are TPs (with no FP or FN). B: NEO signal computed from A (same as Fig 2 II D). C: Edge-detector signal computed from A. The horizontal dashed line marks the value of 0. Local maxima in C correspond to a falling edge in A (and vice-versa). D: The result of multiplying signals B and C. E: Signal D with all negative-values set to 0. The red curve represents the detection threshold which varies over time. It is computed as the running median of the absolute deviation in a 15 second window. Comparing B to E, one notes the large reduction in noise. The four pulses of energy corresponding to each of the slow wave events is evident to the naked eye (and are properly detected).
Use the electrode recording to compute the smoothed detection signal, S(t), as described in the previous sections, using any of the four transform methods described above—ND, ASD, NEO, or DEO4. (See Fig 4B.)
Convolve the edge-detector kernel (described below) with the serosal electrode signal (see Fig 4C). The result is termed the falling-edge detector signal.
Compute the FEVT signal, F(t) as the product of falling-edge detector and smoothed detection signals (Fig 4D), setting all negative values to 0.
Compute the time-varying detection threshold (described below; see red curve in Fig 4E) from FEVT signal.
Find all times at which the value F(t) is greater than or equal to the time-varying detection threshold.
Identify individual slow wave events and mark the corresponding ATs using the clustering algorithm described in the previous section.
K. Parameter Optimization
As identified above, the automated slow wave detection algorithms—both the BCT and FEVT versions—have the following tunable parameters: the detection threshold η, the refractory period Tr, and the smoothing window width p. Additionally, for the FEVT algorithm, the running median window half width τHW is a tunable parameter. We analyzed various combinations of various parameter values to optimize the default settings of our algorithm. These can be tuned according to the nature and quality of the serosal recordings. The trade off to be made is sensitivity versus specificity (positive-prediction value).
For our initial BCT algorithm, we tested all parameter combinations using values selected from those listed in Table II. For our FEVT algorithm, we tested all combinations of parameter values selected from those listed in Table III. (Note that the values for η tested did not depend on the detection signal transform.) The selection of these values were guided, in part, by our analysis of the BCT results.
TABLE II.
All 125 combinations of parameter values, selected from those listed below, were tested. Note that values for η tested depended on the detection signal transform.
| Parameter Values | |
|---|---|
| Tr | [2, 3, 4, 5, 6] sec |
| p | [0, 1, 2, 3, 4] sec |
| ηND | [2, 3, 4, 5, 6] |
| ηASD | [3, 5, 7, 9, 11] |
| ηNEO | [5, 7.5, 10, 12.5, 15, 20] |
| ηDEO4 | [5, 7.5, 10, 12.5, 15, 20] |
TABLE III.
All 81 combinations of parameter values, selected from those listed below, were tested. Note that values for η tested are not dependent on the detection signal transform.
| Parameter Values Evaluated | |
|---|---|
| Tr | [3, 5, 7] sec |
| p | [0, 1, 2] sec |
| η | [4, 6, 8] |
| τHW | [15, 30, 45] sec |
L. Automated Marking Performance Benchmarks
In order to evaluate the performance of our automarking algorithm, we tallied the following quantities: Number of True Positives (TP): A true-positive is defined as an automarked AT that matches a hand-marked time to within 1 sec: δt = | tauto − tmanual | ≤ 1 s. A value of 1 s was chosen to allow a small amount of leeway between the auto- and hand-marked times, while still being a strict enough condition to produce adequately accurate activation maps. Number of False Positives (FP): A false-positive, (or “false alarm”) is defined as an automarked AT for which there is no corresponding manual mark within 1 s. As stated above, manual marking is conservative and therefore not all FPs may strictly be true FPs, however this definition was accepted as sufficient for the purposes of this study. Number of False Negatives (FN): A false-negative (or “missed detection”), is defined as a manually-marked AT for which there is no corresponding automark within 1 s.
We computed three performance metrics, the sensitivity (Sens.), the positive-predictive value (PPV), and the product of the two, denoted as Aroc, defined as follows. The sensitivity quantifies the fraction of (validated) hand-marks which were also detected by the automarking algorithm:
| (17) |
The PPV (or “specificity”) quantifies the fraction of erroneous automarks.
| (18) |
The values for Sens. and PPV are between 0–1. The higher the values, the better the algorithm. The ideal algorithm will achieve a value of 1 for all performance metrics. In practice, however, the Sens. and PPV are inversely correlated: tuning the algorithm to be more sensitive typically makes it less specific, while tuning the algorithm to have a higher PPV value typically makes it less sensitive. Taking this trade-off into account, we quantified the overall performance of the algorithm as the product of the sensitivity and positive-predictive value by defining the the quantity Aroc (the area under a receiver operating characteristic (ROC) curve):
| (19) |
An ideal algorithm will achieve a value of Aroc = 1. However, from our experience, an algorithm achieving a combination of 85% sensitivity and 85% PPV (Aroc ≥ 0.74) is satisfactory because it allows for the generation of sufficiently accurate activation maps derived from the automarked ATs, without the need for an unreasonable time loss spent in the manual correction of erroneous automarks.
III. Results
A. Manual Marking Outcomes
Three investigators took an average of 10.7± 2.5 min to manually mark each individual E48 recording segment (48 channels / 180 s each), and an average of 9.5 ± 2.6 min to mark each PCB recording segment (48, 48 and 41 channels / 180 s each). There was modest variability in the number of ATs identified by the three manual markers. For the two E48 data segments a mean of 418 ± 18 and 396 ± 2 events were manually marked, and for the PCB segments a mean of 221±5, 169±7, and 158±3 events were marked. The mean RMS deviation of the ATs identified by the three manual markers was 0.2 s, relative to the extracellular potential duration of ≈ 1–2 s.
B. Automated Marking Outcomes: BCT Algorithm
1) BCT Results Summary
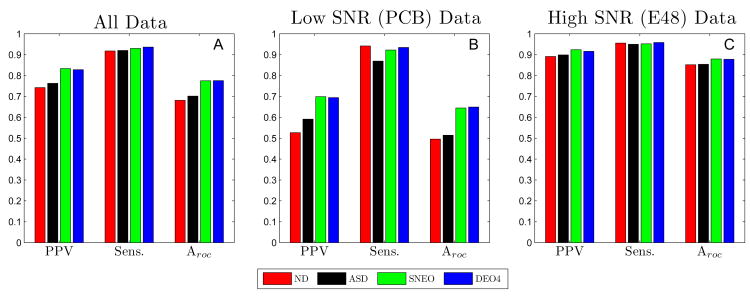
Fig 6 summarizes the performance obtained for BCT, for all four detection signal transforms. The results were tabulated for processing all electrode signals from both the PCB and E48 platforms, and for each platform individually. Results are shown for the optimal parameter set for each of the signal transform methods. The optimal BCT method parameters for each signal transform method are given in Table V.) For the high SNR (E48) data, the performance of this algorithm was satisfactory. Little difference in performance was noted between the different detection signal transforms implemented, though the performance of higher order methods (NEO and DEO4) was slightly superior to that of the lower order methods (ND and ASD), as shown in Fig 6 C. For all transforms, the sensitivity was approximately 0.95, and the PPV was in the range of 0.89–0.92. The value of the overall performance metric, Aroc, for the ND, ASD, NEO, and DEO4 methods was 0.85, 0.85, 0.88, and 0.88, respectively. (Results in this section are always quoted in this order.)
Fig. 6.
Performance Summary of Basic Algorithm. The positive-predictive value (PPV), Sensitivity (Sens.), and Aroc = PPV× Sens. for all serosal recordings (A), low SNR recordings (B), and high SNR recordings (C) evaluated with the negative Derivative (ND); Amplitude-Sensitive-Differentiator (ASD); Non-Linear Energy (NEO); and 4th order Differential Energy Operator (DEO4) methods. The performance was nearly the same across all methods for high SNR data. However, for SNR data, NEO and DEO4 significantly outperformed both ND and ASD.
TABLE V.
The following parameters optimized the performance of the BCT algorithm over all electrode recordings (high and low SNR). η is the detection threshold multiplier. Tr is the refractory period. p is the detection signal smoothing kernel width.
| Optimal Parameter Values | |||
|---|---|---|---|
| Method | η | Tr (s) | p (s) |
| ND | 5 | 6 | 1 |
| ASD | 11 | 5 | 1 |
| NEO | 15 | 6 | 0 |
| DEO4 | 15 | 4 | 0 |
For the low SNR (PCB) data set, the performance of the algorithm was strongly dependent on the detection signal transform method (see Fig 6 B), with the higher order methods being substantially superior to that of the lower-order methods. The optimal parameter set for each of the four signal transform methods maintained a high value of sensitivity at the expense of achieving a relatively low PPV. The sensitivity values were 0.95, 0.86, 0.92, and 0.93 for each method, respectively. However, the PPV outcomes were not satisfactory: 0.51, 0.54, 0.66, and 0.66. The Aroc values achieved were 0.53, 0.59, 0.70, and 0.70. The fact that the performance of BCT was the same using the 2nd- or 4th-order differential energy operators as the transform method suggests that no gains can be made simply by using an even higher order detection signal. While the higher order methods performed significantly better than the lower order methods on low SNR data, there was still much room for improvement, and this motivated the development of our FEVT algorithm.
2) Effect of Tuning Parameters
The BCT algorithm was optimized, for each detection signal transform, across the parameter space created by its three tunable variables (data not shown). The algorithm was most sensitive to the detection threshold η. The performance of the outcome varied with the detection signal smoothing kernel size p, and was essentially insensitive to the refractory period Tr. As expected, increasing η decreased the sensitivity, and increased the PPV. Therefore, setting a higher value for the detection threshold caused some manually-marked ATs to escape detection, but also avoided FPs.
3) BCT Method Mishandled low SNR Signals
A detailed examination of the PCB platform automark-ing results revealed typical causes of mishandled signals—those with a large fraction of FPs and FNs. Whereas Fig 2 I illustrates a high SNR signal for which all ATs are properly detected, Fig 2 II–IV illustrate three types of problematic signals which have several FPs and FNs
Fig 2 II and III show signals that demonstrate why the performance of the ND and ASD methods were inferior to higher order methods. The wandering baseline and relatively small downward deflections of the slow wave events in the electrode signal (Fig 2 III) led to FPs with the ND method (at 19 and 49 s), and a FN with the ND method (at 24 s).
Fig 2 II shows an electrode signal with a relatively slow downward deflection, with a noticeable respiration waveform (≈ 15 cpm) superimposed on the gastric serosal potential. In addition, the waveform for the first two slow waves differs from the latter two, which contain relatively large pre-potentials (upward deflections) occurring at 36 s and 52 s. The respiration waveform leads to a FP at 30 s using the ND detection signal transform. The ASD and DEO4 transform each contain one FN (at 4 s), due the low SNR of the detection signal, and due to the constant threshold being set too high, in part because the first two events manifest as a relatively small pulse, while the last two exhibit a much larger amplitude.
Fig 2 IV shows and electrode signal with fast down- and upward deflections. The fast upward deflections terminates abruptly with a small-amplitude downward deflections. The sharp local maxima manifest as a second large pulse for each slow wave event in the detection signal transforms. This leads to double-counting of many slow waves events, such as the FP automarks at 28 and 38 s.
C. Automated Marking Outcomes: FEVT Algorithm
1) FEVT Properly Handles Problematic Signals
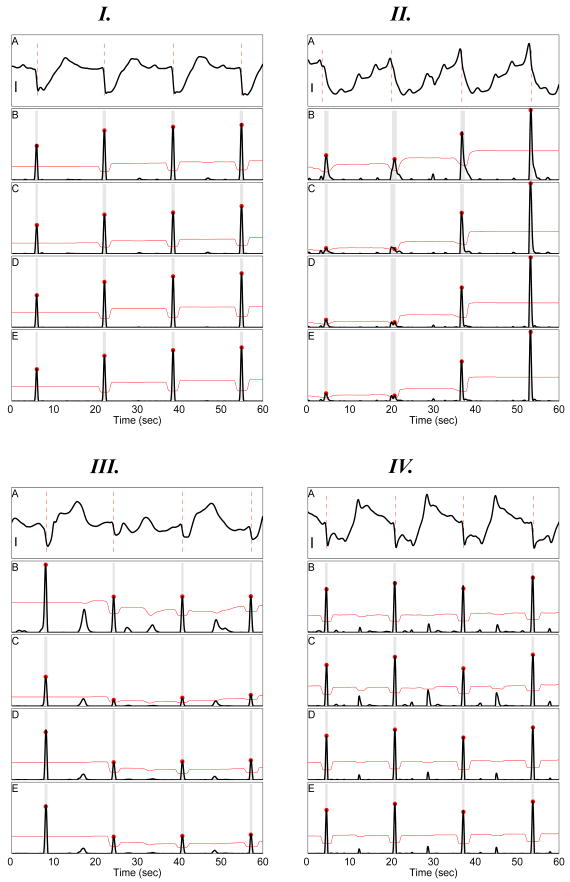
Figure 5 illustrates how the FEVT algorithm properly autodetects ATs in signals mishandled by BCT method. In each case, four manually-marked ATs were detected with the FEVT algorithm, all TPs with no FPs or FNs. Figures 5 A, I–IV, repeat those of Fig 2 A, I–IV, respectively. Panels B–E in Fig 5 illustrate the FEVT detection signal computed using each of the four detection signal transformations (ND, ASD, NEO, DEO4), respectively, with the time-varying threshold overlaid (red curves). The FEVT detection signals contain large positive pulses corresponding to the negative-flanks of the corresponding electrode signal, while no such pulse is observed for positive-flank (e.g., see Figs 5 III and IV). The FEVT detection signals have a higher SNR than the corresponding detection signals used in the initial algorithm (e.g., compare Figs 5 and 2 II). Also, the time-varying threshold better accommodates detection of ATs in an FEVT detection signal with a variable SNR. For example, Fig 5 II shows that the detection threshold is set relatively low for approximately the first 30 s, then increases for the latter 30 s to adjust to the increasing amplitude of the peaks in the FEVT signal. This allows the first two ATs to be properly detected (whereas they were not using the BCT algorithm). In short, the FEVT algorithm is much better suited to properly detect ATs in low SNR signals, while retaining the same satisfactory level of performance for high SNR recordings.
Fig. 5.
Four Serosal Electrode Signals and Corresponding FEVT Outcomes. Panels I–IV A illustrate serosal electrode signals (recapitulating those in Fig 2 I–IV A), along with the corresponding FEVT signal (see II-I1 and autodet I A: Stereotypical high SNR recording. II A: Waveform with slow downward deflection. III A: low SNR recording with wandering baseline waveform. IVA: Fractionated waveforms with fast repolarization upstroke. Scalebars in I, II, and IV: 300 μV. Scalebar in III: 500μV. In B–E gray rectangles delimit the time-window of each identified slow wave event. Red circles indicate the identified ATs. The red curves show the time-varying detection threshold (see II-I2). All ATs are properly detected for all signals I–IV with no false-positives or false-negatives, in contrast to the BCT method (compare to results in Fig 2).
2) FEVT Performance Summary
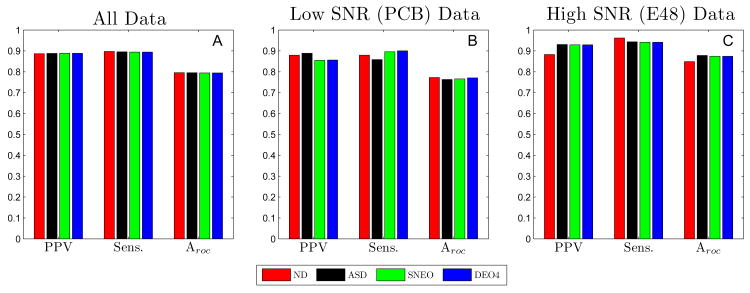
Fig 7 summarizes the performance obtained with the FEVT algorithm, for all four detection signal transforms. The results were tabulated for processing all electrode signals from both the PCB and E48 platforms, and for each platform individually. Results are shown for the optimal parameter set for each of the signal transform methods. The optimal FEVT algorithm parameters for each signal transform method are given in Table VI.
Fig. 7.
Performance Summary of FEVT algorithm. The positive-predictive value (PPV), Sensitivity (Sens.), and Aroc = PPV × Sens. for all serosal recordings (A), low SNR recordings (B), and high SNR recordings (C) evaluated FEVT method using basis signals based on the Negative Derivative (ND); Amplitude-Sensitive-Differentiator (ASD); Non-Linear Energy (NEO); and 4th order Differential Energy Operator (DEO4) methods. The overall performance is essentially independent of the basis signal type. Compare to Fig 6. The performance gains over the BCT method for analysis of low SNR data were especially significant. The FEVT algorithm increases the PPV from 0.68 up to 0.87 over the BCT algorithm while maintaining a sensitivity value of about 0.90. The performance of the FEVT method was nearly the same as the basic method for high SNR data.
TABLE VI.
The following parameters optimized the performance of the FEVT algorithm over all electrode recordings (high and low SNR). η is the detection threshold multiplier. Tr is the refractory period. p is the detection signal smoothing kernel width. τHW is the half-width of the running median window.
| Optimal Parameter Values | ||||
|---|---|---|---|---|
| Method | η | Tr (s) | p(s) | τHW (s) |
| ND | 8 | 7 | 0 | 15 |
| ASD | 4 | 7 | 2 | 15 |
| NEO | 4 | 7 | 2 | 15 |
| DEO4 | 4 | 7 | 2 | 15 |
As expected, for the high SNR (E48) data, the performance of the FEVT algorithm remained satisfactory (see Fig 7 C). Sensitivity values were in the range of 0.94–0.96; the ND transform was most sensitive. The PPV for the ND method was lowest (0.88) compared to that of the other three signal transform methods (0.93). The value of the overall performance metric, Aroc, for the ND, ASD, NEO, and DEO4 methods 0.85, 0.87, 0.87, and 0.87, respectively. Thus, only negligible performance differences between BCT and FEVT algorithms' performance were observed when processing high SNR data.
For the low SNR (PCB) data (Fig 7 B), the performance of the FEVT algorithm was substantially superior to that of the BCT algorithm (compare Figs 7 and 6 B). Comparing the values for the overall performance metric (Aroc) the FEVT algorithm performance was substantially superior, especially when using lower-order S(t) (see Table IV). The overall performance advantage of the FEVT algorithm is attributed to gains made in the PPVs (+0.37, +0.34, +0.24, and +0.24, respectively, for each transform) without comprising the sensitivity. Interestingly, the overall performance of the FEVT algorithm was essentially invariant to the type of signal transform used when computing the FEVT signal: all Aroc values were between 0.76–0.77 (see Table IV). However, as shown in Fig 7, the ND and ASD transforms achieved a slightly higher PPV, while the NEO and DEO4 transforms achieved a slightly higher sensitivity.
TABLE IV. Overall performance metric (Aroc values) for BCT and FEVT for each signal transform method.
| Aroc values | |||
|---|---|---|---|
| BCT | FEVT | Δ (FEVT - BCT) | |
| ND | 0.53 | 0.77 | +0.24 |
| ASD | 0.59 | 0.76 | +0.17 |
| NEO | 0.70 | 0.77 | +0.07 |
| DEO4 | 0.70 | 0.77 | +0.07 |
3) Optimizing FEVT Input Parameters
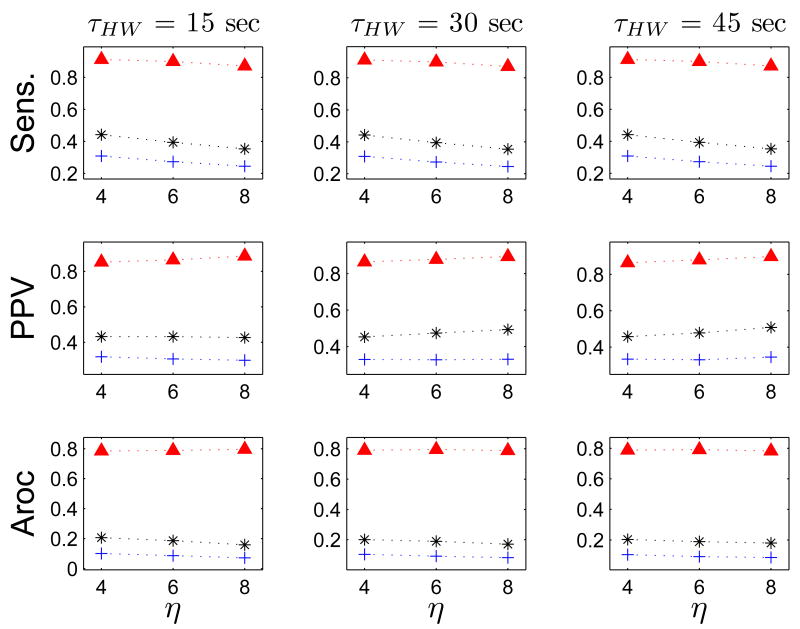
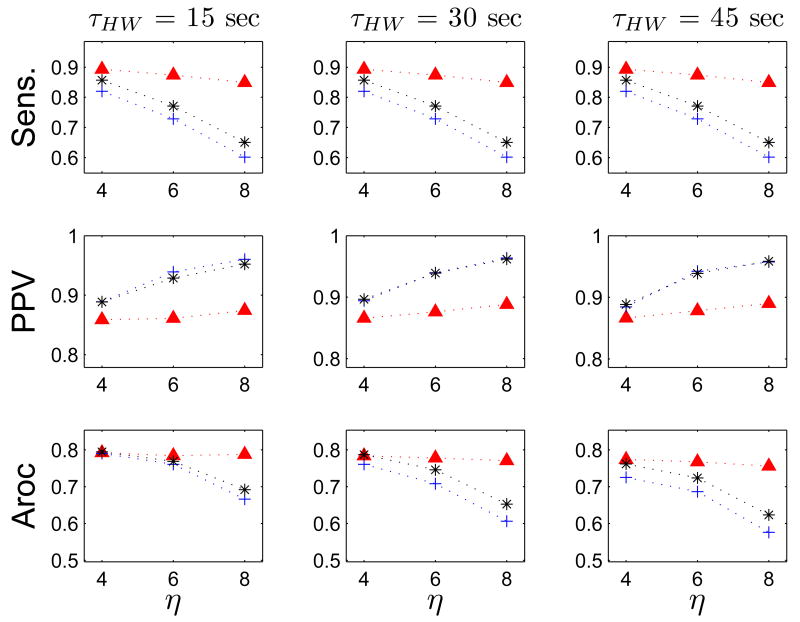
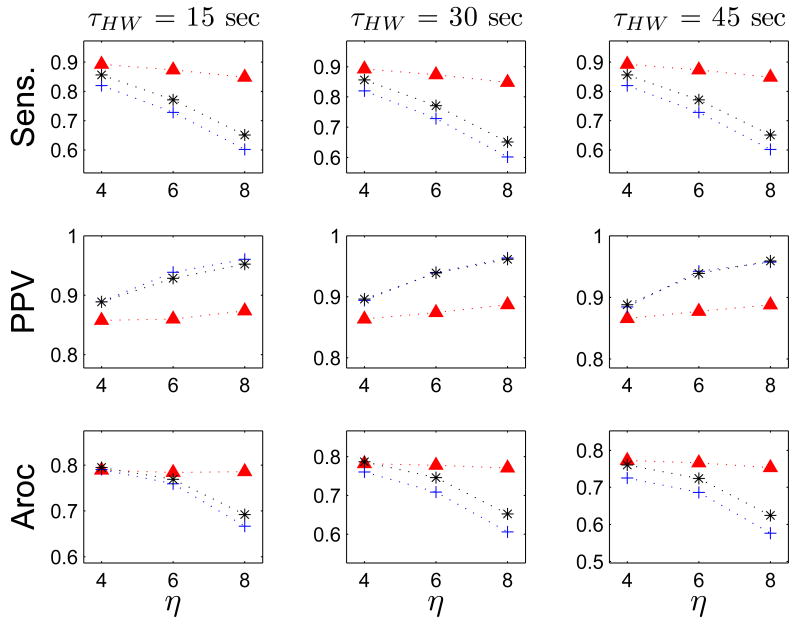
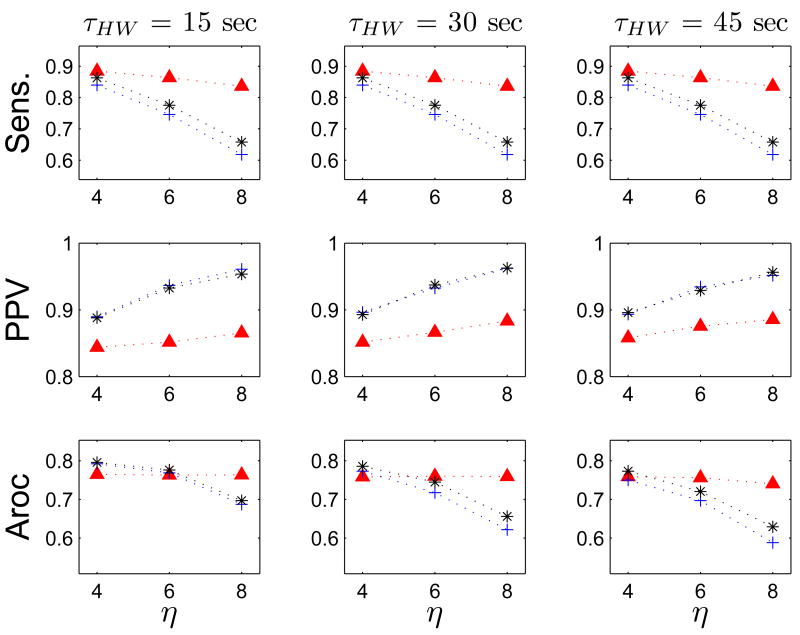
Figs 8–11 show the results for optimizing the performance of the FEVT algorithm over the parameter space. The parameter values over which the optimization was performed are summarized in Table III. The performance of the FEVT algorithm is essentially invariant to τHW and Tr, regardless of the detection signal transform S(t) employed. We observed only very minor differences (≤ 0.02) in the outcomes for Sens., PPV, and Aroc. The FEVT algorithm performance did depend on the detection threshold multiplier, η, as expected: increasing η decreased the sensitivity, and increased the PPV.
Fig. 8.
FEVT performance optimized over the parameter space using ND transform. Each panel plots a performance metric versus the detection threshold parameter η. Top row: positive-predictive value (PPV). Middle row: Sensitivity (Sens.). Bottom row: Aroc = PPV × Sens. Performance metrics are tabulated using all serosal recordings (high and low SNR). Data are displayed in columns according to the value of the running median window width parameter τHW. Each colored set of colored markers corresponds to a particular value for the smoothing window width parameter p: red diamonds: 0 s; blue crosses: 1 s; and black asterisk: 2s. Only data for a refractory window value of Tr = 7 s because the performance was essentially invariant to Tr. Note that the performance of the FEVT algorithm using the ND transform signal is strongly dependent on the parameter p. The algorithm's performance was optimized when no smoothing was applied (p = 0).
Fig. 11.
FEVT performance optimized over the parameter space using DEO4 transform. Data are plotted in the same manner as is described in Fig 8. The performance of the FEVT algorithm using the DEO4 transform signal is dependent on the parameter p, especially so for the PPV. However, the performance is essentially invariant to the value of τHW. Optimal performance was achieved at lower values of η.
IV. Discussion
A. General Conclusions
We have presented the FEVT method for automatically detecting gastric slow wave ATs in HR serosal recordings. The FEVT detection signal is a non-linear transform of the electrode signal that accentuates the rapidly negative-going transient which characterizes the arrival (activation time) of the propagating gastric slow-wave wavefront. The FEVT algorithm also makes use of a time-varying threshold and simple clustering procedure to identify individual slow wave events. The FEVT algorithm is robust in that tuning any or all of the input parameters results in only small changes in its performance, and its performance was found to be satisfactory, even in the context of analyzing lower SNR signals generated by the PCB electrodes.
The demonstrated time savings in this study were of major significance. The manual marking of ATs required approximately 10 minutes for a 180 s segment of 48 channels, whereas the automated method only required approximately a few seconds. Therefore, the automated marking process was around at least an order of magnitude faster than manual marking, on average, presenting attractive efficiency gains for identifying ATs. This acceleration of analysis time will be of enormous value in HR mapping studies, as many hours of recordings may be necessary to quantify physiological changes in slow wave propagation [18]. In practice, however, it may still sometimes be necessary to manually correct for the FP or FN events, somewhat reducing the dramatic time savings demonstrated here. In particular, whereas the FEVT algorithm achieved a highly satisfactory sensitivity and specificity in relation to the E48 (silver wire) platform, the specificity for the PCB recordings was somewhat reduced. Investigators using the PCB platform will therefore need to devote a modestly greater proportion of their time to review and correct the auto-marked segments. Evaluating the use of silver contacts instead of gold contacts may be a means to improve the SNR of the PCBs in future.
As demonstrated in this study, manual marking of slow waves is a somewhat subjective exercise, and modest variability in the number and exact timing of marked ATs is the result of an individual's experience and visual assessment. Although manual marking was used as the baseline standard in this study, it is therefore possible that the actual sensitivity or specificity of the automarking methods was underestimated or overestimated in this study. The manual markers did not mark an event unless they were highly confident that it was a true slow wave, as seen in Fig 1, and therefore it is most likely that the specificity of the FEVT method has been slightly under-estimated in this study.
Small variability in the relative timing of the manually marked ATs was also demonstrated in this study. The fact that the manual marks were made on average 0.2–0.3 s earlier than the FEVT-detected AT is an interesting visual/psychological phenomenon only. In practice, since this small time difference is constant among all electrodes, the slight forward marking has no effect on the accuracy of, or conclusions drawn from, the activation maps generated from the corresponding automarked ATs. Moreover, automated marking will more faithfully identify the true moment of the ATs than could be achieved by visual assessment, achieving greater marking accuracy for each TP slow wave event.
B. Comparison to Other Methods
We have found the performance of FEVT to be superior to the other potential methods that have been examined by ourselves and others. A method similar to that of our BCT algorithm employing the ASD transform has been previously demonstrated for the on-line detection of ATs in conscious animals by Lammers et al [16]. Results reported in [16] appear to based only on analysis of high SNR recordings similar in quality to those obtained with the E48 electrode platform. However, they did not quantify the performance of or attempt to validate their method using a variety of low SNR waveforms, so a quantitative comparison cannot be drawn. The FEVT algorithm can be readily adapted for the on-line detection of ATs, and we anticipate it may be found to be useful in future on-line conscious animal studies evaluating slow wave activity [32].
C. Generalization
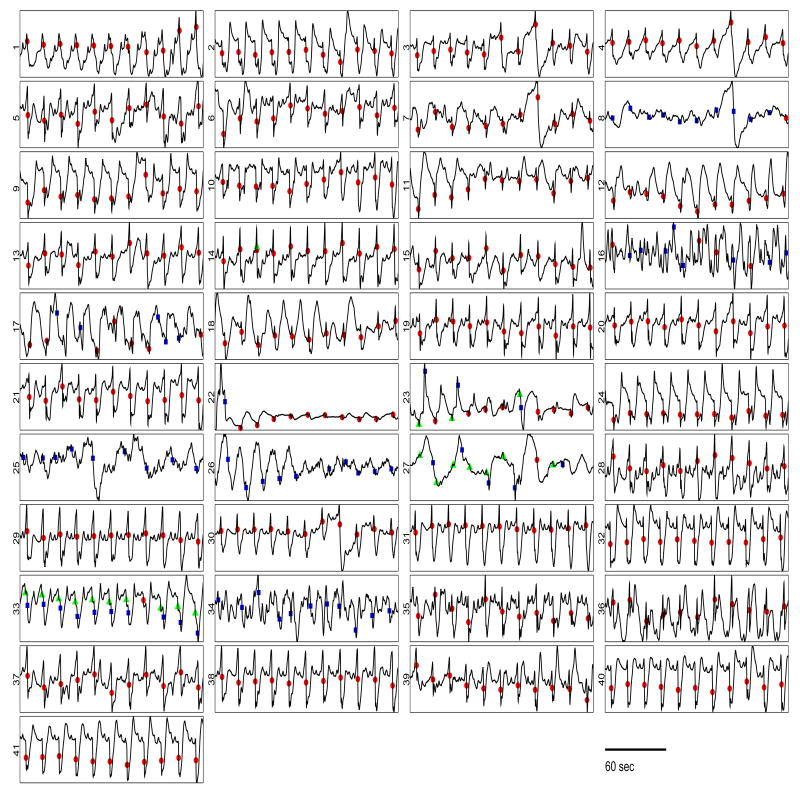
One concern is whether the FEVT algorithm generalizes to a wide-range of data sets and test subjects, in light of the fact that it was developed using five animal test subjects. However, the critical determinant in how well the algorithm's performance should generalize to other data sets is based on the wide intra-subject range in recordings used to validate it. That is, the FEVT algorithm was validated using 227 recordings exhibiting a wide range of signal quality and morphology (for example, see Fig 12). We fully expect that its performance will be robust to a wide variety of recorded signal morphologies, thus generalize well to processing other data sets. Indeed, we have begun processing large amounts of HR mapping data from more than a dozen animal and human test subjects, and have found the performance of the FEVT algorithm to be highly satisfactory, attaining performance metrics just as high as those reported for the validation data set.
Fig. 12.
A variety of waveforms recorded from 41 channels of the PCB electrode platform, with marked results from automated AT detection using FEVT method. Each of 41 panels shows a 180 sec-long signal recorded with a PCB electrode. The geometry shown in the figure is isomorphic to the physical arrangement of electrodes. Automarking results are marked as TPs (filled red circles), FPs (filled blue squares), and FNs (filled green triangles). Note that the signal 41 in this figure is the same as the recording shown in Fig 2 I A; signal 1 is the same as that shown 2 II A; signal 12 is the same as 2 III A; and signal 24 is the same as 2 IV A. For most electrodes, the FEVT detection algorithm succeeding in finding all ATs, without finding any false positives. For almost all channels, all marks were the same type: either all TPs, all FPs. For example, signals 25, 26 and 34 contain FPs only. Signal 33 shows an equal number of FPs and FNs which resulted from the hand-marks differing from the automarks by slightly more than the 1-sec range allowed to declare a TP. Signals 16, 23, and 27 exhibit a mix of TP, FP and FNs. Overall the performance of the FEVT algorithm was highly satisfactory.
D. Parameter Tuning: Performance Trade-offs
The optimized FEVT parameters identified in this study presented in Table VI provide a guideline FEVT setting for gastric slow wave identification, but could be tuned according to the needs of the investigator, and according to the data set under investigation. For example, small bowel slow wave activity occurs at a faster rate than gastric activity (≈8-12 cpm versus ≈3 cpm in humans) [3], and therefore a shorter refractory period may be required to prevent an unsatisfactory FN rate. During gastric dysrhythmias, successive slow wave sequences may occur rapidly and irregularly, and their analysis may therefore also necessitate a shorter refractory period to prevent excessive FNs [18].
As discussed in section III-C3, the performance of the FEVT algorithm depends most strongly on the detection threshold multiplier η. If the investigator places higher priority on ensuring there are no FPs, then the value of η should be adjusted higher; if the priority is to ensure there are no FNs, then the value of η could be adjusted lower. Properly setting the value for the smoothing window parameter p is also important, as the outcomes are substantially different when choosing to smooth the detection signal transform S(t), or not (i.e., p = 0). For the ASD, NEO, and DEO4 methods, smoothing results in higher PPV values, but lower Sensitivity values. The difference between smoothing or not becomes more pronounced at higher values of η. For example, Fig 10, left column shows that not smoothing leads to about 5% greater sensitivity when η = 4, and about 30% greater sensitivity when η = 8. Conversely, smoothing leads to about a 3% greater PPV than not smoothing when η = 4, and a 10% difference when η = 8. When the ND signal transform is used in the FEVT algorithm, the both the sensitivity and PPV attain much higher values when no smoothing is applied; thus smoothing should not be used with the ND transform. When using any of the other transforms, however, one must consider the sensitivity-PPV trade-off.
Fig. 10.
FEVT performance optimized over the parameter space using NEO transform. Data are plotted in the same manner as is described in Fig 8. The performance of the FEVT algorithm using the NEO transform signal is dependent on the parameter p, especially so for the PPV. However, the performance is essentially invariant to the value of τHW. Optimal performance was achieved at lower values of η.
E. Remaining Erroneous FEVT Automarks and Further Improvements
The FEVT algorithm attains satisfactory performance, but it still detects some erroneous automarks (FPs and/or FNs). It is worth examining the wide ranging types of waveforms recorded during a single experiment to understand where the FEVT algorithm is still in error. Fig 12 shows 180 s data segments from the 41 selected channels from one experiment recorded using the PCB platform. The FEVT algorithm properly detects all TPs on most channels (marked as red circles on the waveforms). Note that most FPs (blue squares) are confined to a few problematic channels. For example, electrode signals 8, 25, 26, 27 and 34 contain all FPs. It is possible that these automarks do indeed faithfully represent a recorded slow wave event. However, based on visual inspection, they do not appear to contain any obvious slow wave waveforms, which means they would not have been manually-marked. Two of these recordings (channels 8 and 25) contain very large artifactual transients (occurring at approximately 130 and 70 s, respectively). Channel 26 initially exhibits a large sinusoidal waveform with time-varying amplitude, which is not present in the latter half of the recording. These FPs may indicate that the FEVT algorithm can not discriminate between a large energy pulse generated by an actual AT and one generated by a large artifact. One option to improve the overall performance of the AT automarking process is to pre-screen GSERs, classifying any obviously “bad” channels containing outliers [9], and ignoring them for the remainder of the automarking procedure.
Signal 33 is a special case, as it contains all FPs and FNs. This result indicates that the automarked ATs differed by the manual marks by just slightly more than the allowed 1 s range. Upon closer inspection, all FNs are found to occur at the maximally negative derivative, while the manual-marks were made about 1.1 s before this point. Therefore, the automarks on this channel should be regarded as all TPs. In fact, we discovered that manual-marks are almost always made about 0.2–0.3 s earlier than the actual time at which maximally negative derivative occurs.
Some channels are more problematic as they contain a mix of TPs, FPs, and FNs (e.g., channels 16, 17 and 23). Channel 16 has an atypically low SNR—the recording is very noisy for most of the data segment, but did record a few clear slow wave events, especially toward the end of the 180 s segment. With regard to channel 17, the FPs occur on a very large falling-edge that precedes the much smaller negative flank of the actual AT. The FEVT algorithm defined the AT as the time at which the maximally negative derivative occurred, thereby missing the detection of the true AT. The same is true for a few of the waveforms recorded on channel 23. A few of the waveforms in the earlier part of the segment (about the first 60 s) exhibit a very large downward transient just prior to the actual AT. These are difficult cases to remedy while still maintaining the generality of the FEVT algorithm. One possible solution would be to apply a template matching scheme to classify the problematic waveforms to help define the actual AT. Another possibility is to integrate spatial information about the direction of slow wave propagation to help decide which part of the recording represents the true AT.
Finally, we noticed that the few erroneous automarks detected in the E48 data tend to be FPs on “dead” electrodes, i.e., those recording very low amplitude (< 10 μV) white noise. In these cases, the FEVT algorithm is overly sensitive. One easy remedy is to additionally apply minimum amplitude or derivative criteria. We have found that imposing a very modest amplitude criterion (|ΔV| ≥ 5 μ V) remedies almost all instances of this problem.
F. Future Directions
This study is important because the use of gastrointestinal HR mapping is growing. HR mapping has recently been used to describe the sequences of normal and abnormal slow wave propagation in canines [18], [19], and this work now awaits to be repeated and expanded in humans, for both normal and pathological states. The recent advent of the PCB electrode platform, and a new minimally-invasive tool that can be deployed during laparoscopic surgery will enable this work [5], [26]. We have applied the FEVT algorithm to small bowel slow wave recordings made on the serosa. Preliminary results suggest that FEVT method is also effective for detecting ATs in these recordings, but with a different parameter set to account for the higher slow wave frequency (typically 12–16 cpm), and the fact that the fast, negative deflection tends to not be as sharp as those in gastric recordings. HR mapping is also being used as a standard to inform the analysis of biomagnetic signals, as recorded by the Super QUantum Interference Device (SQUID), which offers potential to non-invasively diagnose significant clinical GI disorders such as mesenteric ischemia [1], [29]. In addition, HR mapping is now being proposed as a tool to more accurately investigate the physiological effects of therapeutic gastric electrical stimulation [6]. We anticipate that the FEVT automarking method will be of use in all of these research programs. In conclusion, we have developed and validated the FEVT algorithm for thee automated marking of slow wave activity, and recommend its use to improve research efficiency in future HR mapping studies.
Fig. 9.
FEVT performance optimized over the parameter space using ASD transform. Data are plotted in the same manner as is described in Fig 8. The performance of the FEVT algorithm using the ASD transform signal is dependent on the parameter p, but relatively insensitive to τHW. Optimal performance was achieved at lower values of η.
TABLE I. List of Abbreviations.
| Acronym | Meaning |
|---|---|
| GSER | Gastric Serosal Electrode Recording |
| AT | Activation Time |
| ND | Negative-Derivative |
| ASD | Amplitude-Sensitive Differentiator |
| NEO | (2nd order) Non-Linear Energy |
| DEO4 | Fourth-order Differential Energy Operator |
| BCT | Basic Constant Threshold |
| FEVT | Falling-Edge Variable Threshold |
| TP | True Positive |
| FP | False Positive (False Alarm) |
| FN | False Negative (Missed Detection) |
| PPV | Positive Prediction Value |
Acknowledgments
The authors gratefully acknowledge the assistance of the animal care facilities at their respective Universities, including Linley Nisbett for her technical skills. This work was supported by NIH Grants R01 DK58197, RO1 DK58697-02, RO1 DK64775, and grants from the NZ Society of Gastroenterology and NZ Health Research Council.
Footnotes
Authors contributions: JCE developed, coded, and analyzed the performance of all automated slow wave detection algorithms. GOG and CO performed the animal surgeries and made serosal electrode recordings. PD, WQ, and LKC developed an initial version of the negative derivative detection signal transform method. AJP, LKC, WOR, and LAB conceived and coordinated the porcine model gastric experiments. JCE and GOG drafted this manuscript.
References
- 1.Bradshaw LA, Irimia A, Sims JA, Gallucci MR, Palmer RL, Richards WO. Biomagnetic characterization of spatiotemporal parameters of the gastric slow wave. Neurogastroenterol Motil. 2006 Aug;18:619–631. doi: 10.1111/j.1365-2982.2006.00794.x. [DOI] [PubMed] [Google Scholar]
- 2.Chen J, Lin Z, Pan J, McCallum R. Abnormal gastric myoelectrical activity and delayed gastric emptying in patients with symptoms suggestive of gastroparesis. Digestive diseases and sciences. 1996;41:1538–1545. doi: 10.1007/BF02087897. [DOI] [PubMed] [Google Scholar]
- 3.Cheng LK, O'Grady G, Du P, Egbuji JU, Windsor JA, Pullan AJ. Gastrointestinal system. Wiley Interdisciplinary Reviews: Systems Biology and Medicine. 2009 doi: 10.1002/wsbm.19. DOI:10002/wsbm.019. [DOI] [PMC free article] [PubMed] [Google Scholar]
- 4.Crenner F, Lambert A, Angel F, Schang J, Grenier J. Analogue automated analysis of small intestinal electromyogram. Medical and Biological Engineering and Computing. 1982;20:151–158. doi: 10.1007/BF02441350. [DOI] [PubMed] [Google Scholar]
- 5.Du P, O'Grady G, Egbuji JU, Lammers WJ, Budgett D, Nielsen P, W JA, Pullan AJ, Cheng LK. High-resolution mapping of in-vivo gastrointestinal slow wave activity using flexible printed circuit board electrodes: methods and validation. Ann Biomed Eng. 2009 April;37:839–846. doi: 10.1007/s10439-009-9654-9. [DOI] [PMC free article] [PubMed] [Google Scholar]
- 6.Du P, O'Grady G, Windsor J, Cheng L, Pullan A. A tissue framework for simulating the effects of gastric electrical stimulation and in-vivo validation. IEEE Trans Biomed Eng. 2009 doi: 10.1109/TBME.2009.2027690. In press. [DOI] [PMC free article] [PubMed] [Google Scholar]
- 7.Du P, Qiao W, O'Grady G, Egbuji J, Lammers W, Cheng L, Pullan A. Automated detection of gastric slow wave events and estimation of propagation velocity vector fields from serosal high-resolution mapping. Conf Proc IEEE Eng Med Biol Sci. 2009 doi: 10.1109/IEMBS.2009.5334822. In press. [DOI] [PMC free article] [PubMed] [Google Scholar]
- 8.Gardner PI, Ursell PC, Fenoglio JJ, Wit AL. Electrophysiologic and anatomic basis for fractionated electrograms recorded from healed myocardial infarcts. Circulation. 1985 Sep;72:596–611. doi: 10.1161/01.cir.72.3.596. [DOI] [PubMed] [Google Scholar]
- 9.Hodge V, Austin J. A survey of outlier detection methodologies. Artificial Intelligence Review. 2004;22:85–126. [Google Scholar]
- 10.Huizinga JD, Lammers WJ. Gut peristalsis is governed by a multitude of cooperating mechanisms. Am J Physiol Gastrointest Liver Physiol. 2009 Jan;296:1–8. doi: 10.1152/ajpgi.90380.2008. [DOI] [PubMed] [Google Scholar]
- 11.Kaiser J. On a simple algorithm to calculate the energy of a signal. In: Smith Y, editor. Proceedings of the IEEE International Conference on Acoustic Speech and Signal Processing: 381-384; April 1990; Albuquerque. 1990. pp. 381–384. [Google Scholar]
- 12.Kaiser J. Some useful properties of Teager's energy operators. 1993 IEEE International Conference on Acoustics, Speech, and Signal Processing; 1993. [Google Scholar]
- 13.Kim S, McNames J. Automatic spike detection based on adaptive template matching for extracellular neural recordings. Journal of Neuroscience Methods. 2007;165:165–174. doi: 10.1016/j.jneumeth.2007.05.033. [DOI] [PubMed] [Google Scholar]
- 14.Kohler B, Hennig C, Orglmeister R. The principles of software QRS detection. IEEE Engineering in Medicine and Biology. 2002 Jan/Feb;:42–57. doi: 10.1109/51.993193. [DOI] [PubMed] [Google Scholar]
- 15.Lammers W. Smoothmap v3.0.3. www.Smoothmap.org.
- 16.Lammers WJ, Michiels B, Voeten J, Ver Donck L, Schuurkes JA. Mapping slow waves and spikes in chronically instrumented conscious dogs: automated on-line electrogram analysis. Med Biol Eng Comput. 2008 Feb;46:121–129. doi: 10.1007/s11517-007-0294-7. [DOI] [PubMed] [Google Scholar]
- 17.Lammers WJ, Stephen B, Arafat K, Manefield GW. High resolution electrical mapping in the gastrointestinal system: initial results. Neurogastroenterol Motil. 1996 Sep;8:207–216. doi: 10.1111/j.1365-2982.1996.tb00259.x. [DOI] [PubMed] [Google Scholar]
- 18.Lammers WJ, Ver Donck L, Stephen B, Smets D, Schuurkes JA. Focal activities and re-entrant propagations as mechanisms of gastric tachyarrhythmias. Gastroenterology. 2008 Nov;135:1601–1611. doi: 10.1053/j.gastro.2008.07.020. [DOI] [PubMed] [Google Scholar]
- 19.Lammers WJ, Ver Donck L, Stephen B, Smets D, Schuurkes JA. Origin and propagation of the slow wave in the canine stomach: the outlines of a gastric conduction system. Am J Physiol Gastrointest Liver Physiol. 2009 Jun;296:1200–1210. doi: 10.1152/ajpgi.90581.2008. [DOI] [PubMed] [Google Scholar]
- 20.Lewicki M. A review of methods for spike sorting: the detection and classification of neural action potentials. Network: Comput Neural Syst. 1998;9:R53–R78. [PubMed] [Google Scholar]
- 21.Maragos P, Potamianos A. Higher order differential energy operators. IEEE Signal Processing Letters. 1995;2:152–154. [Google Scholar]
- 22.McAdams E. Bioelectrodes. In: Webster JG, editor. Encyclopedia of Medical Devices and Instrumentation. Second. New York: Wiiley; 2006. pp. 120–166. [Google Scholar]
- 23.Mukhopadhyay S, Ray GC. A new interpretation of nonlinear energy operator and its efficacy in spike detection. IEEE Trans Biomed Eng. 1998 Feb;45:180–187. doi: 10.1109/10.661266. [DOI] [PubMed] [Google Scholar]
- 24.Nenadic Z, Burdick JW. Spike detection using the continuous wavelet transform. IEEE Trans Biomed Eng. 2005 Jan;52:74–87. doi: 10.1109/TBME.2004.839800. [DOI] [PubMed] [Google Scholar]
- 25.O'Grady G, Du P, Egbuji J, Lammers W, Budgett D, Nielsen P, Windsor J, Pullan A, Cheng L. High-resolution mapping of human gastric slow wave activity: Methods and first results. Gastroenterology. 2009;136:A484. [Google Scholar]
- 26.O'Grady G, Du P, Egbuji JU, Lammers WJEP, Wahab A, Pullan AJ, Cheng LK, Windsor JA. A novel laparoscopic device for the measurement of gastrointestinal slow wave activity. Surg Endo. 2009 doi: 10.1007/s00464-009-0515-2. [DOI] [PMC free article] [PubMed] [Google Scholar]
- 27.Postaire J, Van Houtte N, Devroede G. A computer system for quantitative analysis of gastrointestinal signals. Computers in biology and medicine. 1979;9:295. doi: 10.1016/0010-4825(79)90036-2. [DOI] [PubMed] [Google Scholar]
- 28.Pousse A, Mendel C, Vial J, Grenier J. Computer program for intestinal basic electrical rhythm patterns analysis. Pflugers Archiv European Journal of Physiology. 1978;376:259–262. doi: 10.1007/BF00584960. [DOI] [PubMed] [Google Scholar]
- 29.Richards WO, Garrard CL, Allos SH, Bradshaw LA, Staton DJ, Wikswo JP. Noninvasive diagnosis of mesenteric ischemia using a SQUID magnetometer. Ann Surg. 1995 Jun;221:696–704. doi: 10.1097/00000658-199506000-00009. [DOI] [PMC free article] [PubMed] [Google Scholar]
- 30.Sezan MI. A peak detection algorithm and its application to histogram-based image data reduction. Computer vision, graphics, and image processing. 1990;49:36–51. [Google Scholar]
- 31.Shenasa M, Hindricks G, Borggrefe M, Breithardt G. Cardiac Mapping. Oxford, UK: Blackwell Publishing Ltd; 2009. [Google Scholar]
- 32.Ver Donck L, Lammers WJ, Moreaux B, Smets D, Voeten J, Vekemans J, Schuurkes JA, Coulie B. Mapping slow waves and spikes in chronically instrumented conscious dogs: implantation techniques and recordings. Med Biol Eng Comput. 2006 Mar;44:170–178. doi: 10.1007/s11517-005-0018-9. [DOI] [PubMed] [Google Scholar]


