

Abstract
Amyloid β‐peptide (Aβ) plaques, one of the major neuropathological lesions in Alzheimer's disease (AD), can be broadly subdivided into two morphological categories: neuritic and diffuse. Heparan sulfate (HS) and HS proteoglycans (HSPGs) are codeposits of multiple amyloidoses, including AD. Although HS has been considered a limiting factor in the initiation of amyloid deposition, the pathological implications of HS in Aβ deposits of AD remain unclear. In this study, immunohistochemistry combined with fluorescence and confocal microscopy was employed to gain deeper insight into the accumulation of HS with Aβ plaques in sporadic and familial AD. Here we demonstrate that HS preferentially accumulated around the Aβ40 dense cores of neuritic plaques, but was largely absent from diffuse Aβ42 plaques, suggesting that Aβ42 deposition may occur independently of HS. A codeposition pattern of HS with Aβ deposits in Tg2576 mice was also examined. We identified the membrane‐bound HSPGs, glypican‐1 (GPC1) and syndecan‐3 (SDC3), in glial cells associated with Aβ deposits, proximal to sites of HS accumulation. In mouse primary glial cultures, we observed increased levels of GPC1 and SDC3 following Aβ stimulation. These results suggest that HS codeposits with Aβ40 in neuritic plaques and is mainly derived from glial cells.
Keywords: β‐Amyloid, glial cells, heparan sulfate
INTRODUCTION
Alzheimer's disease (AD) is essentially a brain amyloidosis, characterized by β‐amyloid (Aβ) deposits, which present as distinct neuritic plaques (containing a dense amyloid core and associated with dystrophic neurites) and diffuse amorphous plaques. These Aβ deposits contain 40 and 42 residue species of Aβ (Aβ40 and Aβ42), released from the β‐amyloid precursor protein (βAPP) through sequential cleavage by β‐ and γ‐secretases (32). The observed differences in Aβ‐deposit morphology in AD may pertain to different stages of Aβ amyloidogenesis, with diffuse plaques representing an early stage, which eventually evolve to neuritic plaques with dense cores (31). This model is bolstered by observations in Down's syndrome, where a trisomy of the βAPP‐bearing chromosome 21 results in the early formation of Aβ42‐positive/Aβ40‐negative diffuse plaques, followed later by Aβ40‐positive plaques with amyloid cores (14). However, there is evidence to suggest that different types of Aβ deposits may arise independently of each other through distinct mechanisms (4).
Heparan sulfate (HS), a complex carbohydrate polymer belonging to the glycosaminoglycan family, is composed of disaccharide units of alternating hexuronic acid (d‐glucuronic or l‐iduronic acid) and d‐glucosamine residues that are sulfated in different positions (6). The HS polysaccharide chains, covalently attached to various core proteins [ie, HS proteoglycans (HSPGs)], are ubiquitously expressed at cell surfaces and in the extracellular matrix. HS chains interact with a variety of proteins including growth factors/morphogens and their receptors; hence, they play a critical role in development, homeostasis and pathological processes 3, 17, 42.
HS has been identified as a codeposit in various amyloidoses (15), including AD, where both HS and HSPGs are accumulated with Aβ deposits 33, 39, 40. There are two major families of membrane‐associated HSPGs: the glypicans and the syndecans. Glypicans are attached to cell surfaces via a glycophosphatidylinositol anchor (7), while syndecans are transmembrane‐spanning proteins. Interestingly, syndecans belong to the same type I protein family as βAPP and are also substrates of γ‐secretase (1). Functional roles for glypicans and syndecans have been proposed in central nervous system (CNS) development, and a number of studies have demonstrated both glypican and syndecan upregulation in glial cells associated with lesions following brain injury in rodent models 11, 12, 19.
Whereas the pathological implications of HS in Aβ deposits remain unclear, the polysaccharide has been shown, in vitro, to markedly increase the fibrillization of Aβ(26) as well as other amyloidogenic proteins. Accordingly, we recently demonstrated that transgenic mice overexpressing heparanase, a mammalian endo‐β glucuronidase that specifically cleaves HS, are resistant to induction of amyloid protein A amyloidosis in the liver and kidney, presumably because of excessive fragmentation of HS chains (21). Moreover, agents that are known to block Aβ–HS interactions in vitro have been shown to prevent HS‐catalyzed amyloidogenesis in vivo (16).
Studies of the interaction between HS and Aβ suggest that the HHQK domain at the N terminus of Aβ is an HS‐binding motif. This sequence has also been shown to bind microglial cells, suggesting that microglia interact with plaques through membrane‐associated HS (8). An HS sequence (N‐sulfated hexasaccharide domain containing critical 2‐O‐sulfated iduronic acid residues) defined in human cerebral cortex, has been shown to bind fibrillar Aβ(22). Interestingly, the composition of this HS domain has previously been identified as a binding site for the neuroprotective fibroblast growth factor (FGF)‐2 (23), shown in cultured neurones to attenuate Aβ neurotoxicity (25). This evidence suggests that in AD brain, neurotoxic Aβ may compete with neuroprotective FGF‐2 for a common HS binding site (22). Furthermore, it has been proposed that the Aβ–HS interaction is mutually protective, such that HS is protected from heparanase degradation (2) and Aβ is protected from protease degradation (9). These findings support the notion that HS plays a role in Aβ‐plaque persistence.
In this study, immunohistochemistry combined with fluorescence and confocal microscopy was employed to gain deeper insight into the role of HS in Aβ deposition. Tissue selection was determined by several factors. Our initial observations in sporadic AD cases had revealed a preferential accumulation of HS with the Aβ40 cores of neuritic plaques and its absence from Aβ42‐rich diffuse plaques. In order to further investigate HS's association with Aβ40, we analyzed a case of Swedish familial AD resulting from a KM670/671NL mutation of βAPP (Swedish βAPP 670/671 AD) 18, 28. This mutation results in increased β‐secretase cleavage, with a subsequent increase in the release of Aβ species and a heavy Aβ load, representing a more aggressive version of the Aβ deposition observed in sporadic AD. We were also interested in determining if HS accumulates in Aβ deposits of βAPP transgenic mice—a question not yet addressed in these widely used models of Aβ deposition. We selected Tg2576 mice, as it is a well described model and carries the Swedish mutation.
To pursue our observation that diffuse Aβ42‐rich plaques were void of HS, we investigated the familial AD variant resulting from an exon 9 deletion of the presenilin‐1 (PS‐1 Δ9 AD) gene. PS‐1 Δ9 AD cases offer a unique opportunity to analyze HS distribution in Aβ deposits [called cotton wool plaques (CWPs)] predominantly composed of Aβ42, which have a weak glial response and an exaggerated, diffuse morphology 24, 41.
Having detailed the HS distribution patterns in the above tissue and deposits, we searched for HSPG candidates that could serve as potential sources of the observed HS. We identified the HSPG subtypes glypican‐1 (GPC1) and syndecan‐3 (SDC3), both membrane bound, and attempted to isolate the cells responsible for their expression. GPC1 and SDC3 expression was found associated with glial cells, specifically astrocytes in sporadic and Swedish βAPP670/671 AD, around the intradeposit HS accumulated at the Aβ40 core. Finally, we demonstrated that the protein levels of both GPC1 and SDC3 were increased in primary astrocyte and microglial cell cultures stimulated with Aβ.
MATERIALS AND METHODS
Brain tissues
Tissues from six sporadic AD cases were obtained from the Alzheimer's Disease Research Laboratory, Massachusetts General Hospital. The sex (M/F), age at death (years), age at disease onset (years) and post‐mortem delay (h) were as follows: F/75/67/17, F/81/67/17, F/81/67/16, F/82/72/<24, M/83/‐/<24 and M/95/82/11. Two sporadic cases were also obtained from the Netherlands Brain Bank (F/95/‐/4.5 and M/88/‐/5). Tissue from one Swedish βAPP 670/671 AD case (F/61/61/48) came from Uppsala University, Sweden, and one case of PS‐1 Δ9 AD (F/69/61/‐) was obtained from the University of Helsinki, Finland. All AD tissue samples were paraffin embedded and sections were generated from the superior temporal gyrus and hippocampus.
The brains of transgenic βAPPmice (Tg2576 mice, 20 months old) were obtained from AstraZeneca R&D, Södertälje, Sweden. The PBS‐perfused mouse brains were fixed in 4% formaldehyde and processed according to standard protocols to provide both paraffin and cryotome sections.
Antibodies
The monoclonal antibody 6E10 (Signet Laboratories, Deadham, MA, USA), directed against βAPP and Aβ, was diluted 1:3000 (from 1 mg/mL stock). Polyclonal antibodies against Aβ40 and Aβ42 (BioSource, Nivelles, Belgium) were both diluted 1:1000. Phage display monoclonal anti‐HS primary antibody HS4E4 (5) (Gift from Toin H. van Kuppevelt) was diluted 1:50 and its secondary P5D4 antibody was diluted 1:15. The monoclonal anti‐HS antibody 10E4 (gift from Guido David, Center for Human Genetics, University of Leuven, Leuven, Belgium) was diluted 1:250. Polyclonal antibodies against GPC1 (Abcam, Cambridge, UK or gift from Lars‐Åke Fransson and Fang Cheng, Lund University) and SDC3 (R&D Systems, Oxfordshire, UK or Santa Cruz, Heidelberg, Germany) were both diluted 1:250. Polyclonal antibodies against mouse SDC1, SDC2 (Zymed, San Francisco, CA, USA) and SDC3 (R&D Systems) were diluted 1:200. Polyclonal antibodies against mouse agrin (GeneTex, San Antonio, TX, USA) and perlecan (gift from Lars‐Åke Fransson, Lund University) were diluted 1:250. Polyclonal (Abcam, Cambridge, UK) and monoclonal (Chemicon, Temecula, CA, USA) antibodies against glial fibrillary acidic protein (GFAP) to stain astrocytes were diluted 1:3000. Monoclonal antibody against the mouse microglial marker CD11b (BioLegend, San Diego, CA, USA) was diluted 1:100. Monoclonal antibodies against mouse neuronal nuclear protein (NeuN) and the mouse oligodendrocyte marker 2′,3′‐cyclic nucleotide 3′‐phosphodiesterase (CNPase) (Chemicon) were diluted 1:150 (from 1 mg/mL stock). Alexa Fluor, fluorescent secondary antibodies against mouse, rabbit and goat species (Invitrogen, Lidingö, Sweden and Abcam) were diluted 1:250.
Immunostaining
Paraffin sections were deparaffinized and rehydrated at 10‐minute intervals through alcohol baths of decreasing concentration (99.9%–70%). Antigen retrieval was carried out by microwaving sections in preheated 25 mM citrate buffer (pH 7.2), and sections were subsequently allowed to cool to room temperature over 40 minutes. Antigen retrieval for cryotome sections was performed by incubating sections at 85°C in 25 mM citrate buffer (pH 7.2) for 5 minutes. Certain epitopes (particularly those identified by antibody 6E10) were best retrieved by additionally immersing sections in 70% formic acid for 5 minutes followed by 10 minutes washing in dH2O. Endogenous peroxidase activity was quenched through 15 minutes incubation with 3.0% H2O2 in PBS. Tg2576 mouse brain sections were blocked for 1 h with Vector M.O.M.™ IgG blocking reagent (Vector Labs, Burlingame, CA, USA) when mouse monoclonal antibodies were used; general blocking of mouse sections was performed through 10 minutes incubation with Vector M.O.M.™ mouse protein concentrate (8% in PBS pH 7.2). Human sections were blocked with DAKO® block (DAKO Cytomation, Glostrup, Denmark) for 30 minutes. All sections were permeabilized in 0.4% Triton®X‐100 (Sigma Aldrich, Stockholm, Sweden) for 15 minutes. Primary antibody incubation was carried out overnight at 4°C in a humid chamber with gentle shaking followed by 30 minutes secondary antibody incubation at room temperature. ABC™ complex and NOVA™ red reagents (Vector Labs) were used for visualising the immunosignals.
For double immunostaining using fluorescent secondary antibodies, sections were treated as described previously before primary antibody incubation, except for quenching of endogenous peroxidase activity. Primary antibodies were incubated overnight, simultaneously or stepwise, in a darkened chamber at 4°C, followed by incubation with the relevant secondary antibodies at room temperature for 1 h. After washing with PBS and dH2O, sections were mounted with Vector Vectashield®fluorescence mounting medium (Vector Labs) containing 4′,6‐diamidino‐2‐phenylindole (DAPI) for counterstaining of nuclei.
Microscopy and image analysis
Images of 6E10‐immunostained sections were obtained at 40× magnification. The total number of 6E10‐positive deposits was recorded with the aid of an overlay grid. 6E10‐positive wagon‐wheel plaques (in sporadic and Swedish βAPP 670/671 AD) and CWPs (in PS‐1 Δ9 AD) were annotated, counted and recorded as a percentage of the total number of 6E10‐positive deposits. 6E10‐positive signals in blood vessel walls (cerebral amyloid angiopathy) were not included in this analysis.
Fluorescence microscopy was performed using a Nikon DXM1200F™ (Nikon, Melville, NY, USA) instrument. Cross‐sectional information and z‐stacks for selected deposits were obtained by confocal laser scanning microscopy using a Carl Zeiss LSM 510 META™ (Carls Zeiss, Jena, Germany) instrument. Three‐dimensional images were created and analyzed with IMARIS® imaging software (Bitplane AG, Zurich, Switzerland).
Quantitative image analysis for HS with Aβ40 or Aβ42 was performed with ImageJ (http://rsb.info.nih.gov/ij/). Merged images, immunostained for HS with Aβ40 or Aβ42, were opened in ImageJ; the red and green channels were separated and converted to grayscale. To establish a standard segmentation threshold for positively stained pixels, sections representing extremes of high and low staining intensity were analyzed. This threshold range was used to capture all positively stained pixels. Using the wand/tracing tool, individual Aβ plaques were then outlined and saved as regions of interest; this outline map was overlayed on the HS channel and the respective area fractions were recorded. A similar approach was used to determine the relative area of HS, GPC1 and SDC3 immunostaining within the hippocampus of Tg2576 mice. The values were normalized to the area of 6E10 immunostaining in the same region. Statistical significance was established by Student's t‐tests.
Primary glial cell culture
Neonatal C57BL mice were sacrificed by decapitation. The head was transferred to a petri dish containg a small volume of Hanks balanced salt solution (HBSS) (GIBCO™ Invitrogen, Lidingö, Sweden) and the dissection was carried out on ice, under a stereo dissecting microscope. The cortex and hippocampus were removed and placed in chilled HBSS/Trypsin (0.25%)/EDTA. Cell dissociation was aided by first mincing the tissue with a sterile scalpel, followed by repeated pipetting through a 1‐mL tip. The minced tissue was transferred to HBSS/Trypsin (0.25%)/EDTA and incubated for 30 minutes (37oC with shaking). The cell suspension was gently homogenized by pipetting and cultured in Dulbecco's modified Eagle medium‐F12® (DMEM‐F12; Sigma, Stockholm, Sweden)/10% fetal calf serum (FCS) containing 0.1 mg/mL of the antibiotic Primocin™ (Amaxa biosystems, Cologne, Germany) until confluent. Purification of astrocytes and microglia was carried out as previously described with a number of minor changes (29). Briefly, the mixed glial culture was incubated with trypsin (0.05%)/EDTA (0.53 mM) diluted 1:1 in DMEM‐F12 for approximately 10 minutes. The detached astrocytes and nondetached microglia were collected and cultured seperately in DMEM‐F12/10% FCS/0.1 mg/mL Primocin™. Double immunostaining of purified cultures with GFAP and CD11b (with DAPI counterstaining for nuclei), followed by image analysis, confirmed that >95% of the cells in the astrocyte cultures were GFAP positive and that >98% of the cells in the microglial cultures were CD11b positive.
Aβ1‐42 (Polypeptide Laboratories, Torrance, CA, USA) was aged as 200 µM stock solutions in dH2O, incubated at 37oC for 7 days and then stored at 4oC. When cells had reached confluence, they were cultured in the presence or absence of 100 and 1000 nM of aged Aβ1‐42, diluted in serum‐free DMEM‐F12 medium for 20 h. Following treatment, the medium was aspirated and the cell layer was washed three times with PBS. Cell lysates were prepared with a lysis buffer [1% TritonX‐100, protease inhibitors (Roche, Stockholm, Sweden)] and the protein concentration was determined with Pierce BCA™ protein assay kit (Pierce, Rockford, IL, USA). To digest HS side‐chains, cell lysates (50 µg protein) were incubated for 5 h at 37°C in the presence of a 1‐m unit of heparitinase I/1‐m unit of heparinase (Seikagaku, Tokyo, Japan).
Western blot
Cell lysate was electrophoretically separated on a 10%–20% tricine gradient gel (Invitrogen, Lidingö, Sweden). Proteins were transferred to nitrocellulose or PVDF (BioRad, San Diego, CA, USA) membrane and blocked for 1 h with 5% nonfat dry milk (BioRad) in TBS. Immunoblotting with antibodies against GPC1 or SDC3 was carried out overnight at +4°C in TBS 5% nonfat dry milk. Membranes were then washed three times in TBS‐Tween®20 (0.1%) (TBS‐T; Sigma Aldrich), 20 minutes/wash. Horseradish peroxidase‐conjugated secondary antibodies were dilutled in TBS 5% nonfat dry milk and incubated with membranes for 1 h at room temperature, followed by three 20‐minute washes in TBS‐T. Immunosignals were developed with Supersignal® West Pico enhanced chemiluminescent substrate (Pierce). For glyceraldehyde‐3‐phosphate dehydrogenase (GAPDH) immunosignals, membranes were reblocked overnight in Odyssey blocking reagent® (LI‐COR/Westburg, Leusden, the Netherlands) at +4°C. GAPDH antibody was diluted 1:4000 in a solution of 50% Odyssey blocking reagent/50% TBS‐T. Membranes were incubated with antibody for 1.5 h at room temperature and then washed three times in TBS‐T, 20 minutes/wash. The fluorescent secondary antibody, anti‐rabbit IgG (1:5000 dilution), was incubated with membranes for 1 h at room temperature in a darkened chamber. After incubation, the membranes were again washed three times in TBS‐T, 20 minutes/wash. Fluorescent signals were detected with an Odyssey® imaging scanner (LI‐COR®/Westburg) and the images were converted to grayscale. Quantitative band analysis was performed with ImageJ.
Ethical permission
The experimental protocols for both human (approval number: 2005‐103) and animal tissues (approval number: C242/5) as well as murine primary glial cell culture (approval numbers: C211/6) were conducted in compliance with Swedish legislation.
RESULTS
HS accumulates with Aβ40 in neuritic plaques but is absent from diffuse Aβ42‐rich plaques of AD brain
Immunostaining with 6E10 for Aβ revealed the neuritic plaques of sporadic (Figure 1A) and Swedish βAPP 670/671 AD (Figure 1B) and the diffuse CWPs of PS‐1 Δ9 AD (Figure 1C). Paraffin‐embedded hippocampal and temporal neocortical sections (15 µm thick) were double immunostained for Aβ40 and HS (HS4E4) and counterstained with DAPI for nuclei (Figure 1D–F). In sporadic AD, >30% of 6E10‐positive deposits had a wagon‐wheel morphology consisting of an outer diffuse halo, which is 6E10 (Figure 1A red arrows) and HS positive but Aβ40 negative (Figure 1D); a central Aβ40‐positive core, which is encircled by an outer layer of HS immunosignal; and a void between the halo and core, which is occupied by nuclei (Figure 1D merge). A similar morphology was observed for the neuritic plaques (>30% of 6E10‐positive deposits) of Swedish βAPP 670/671 AD. However, the outer halo was more compact and was positive for Aβ40. These deposits also tended to have smaller and/or multiple Aβ40:HS‐positive cores (Figure 1E merge). Aβ40‐positive plaques were rare in sections of PS‐1 Δ9 AD (Figure 1F merge), and virtually all CWPs were only Aβ42 positive with a diffuse appearance, typically with no HS colocalization (Figure 1I merge).
Figure 1.
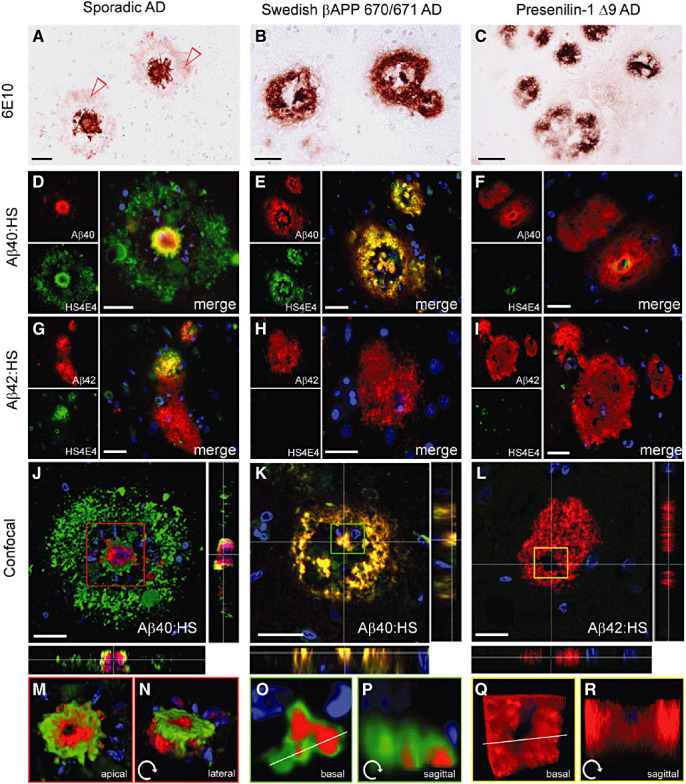
Heparan sulfate (HS) accumulated with amyloid β‐peptide 40 (Aβ40) in neuritic plaques, but was absent from Aβ42‐rich diffuse plaques in Alzheimer's disease (AD). Paraffin‐embedded hippocampal sections (15 µm thick) from sporadic, Swedish β‐amyloid precursor protein (βAPP) 670/671 and presenilin‐1 Δ9 AD (PS‐1 Δ9 AD) cases were immunostained for 6E10 revealing the plaque morphologies of interest in each case (A–C). Sections were double immunostained for Aβ40 or Aβ42 and HS (HS4E4) and counterstained with DAPI for nuclei (blue). Sporadic AD: The neuritic plaques with a wagon‐wheel morphology had essentially three components: (i) an outer halo, which is both 6E10 (A, red arrows) and HS positive, but Aβ40 negative (D); (ii) an inner core, which is Aβ40 positive and colocalized with a superficial layer of HS; and (iii) a void between the halo and the core, which is positive for nuclei (D merge). Diffuse Aβ42‐rich plaques occasionally presented with areas of HS accumulation (G); however, the distribution was uneven. SwedishβAPP 670/671 AD: These neuritic plaques appeared as thick‐ring constructs and are composed similarly to the wagon‐wheel plaques of sporadic AD; however, the outer halo as well as the core stained strongly for Aβ40 and HS (E merge). Diffuse Aβ42‐rich plaques showed no colocalization with HS (H merge). PS‐1Δ9 AD: The dominant plaque morphology in these cases was diffuse Aβ42‐rich deposits known as cotton wool plaques (CWPs) (C). These CWPs rarely stained positively for Aβ40 and showed minimal colocalization with HS (F merge). Large CWPs often appeared porous and contained nuclei. Again, these deposits did not colocalize with HS, although some surrounding HS (possibly vasculature associated) were occasionally detected (I merge). Confocal analysis: Individual deposits were analyzed by confocal laser scanning microscopy and z‐stacks were prepared. Cross‐sectional images revealed the distribution of HS in relation to Aβ40 in both sporadic (J) and Swedish βAPP 670/671 (K) AD, and demonstrated the absence of HS from Aβ42‐rich CWPs in PS‐1 Δ9 AD (L). Amyloid cores from both sporadic and Swedish βAPP 670/671AD cases were isolated and reconstructed three dimensionally (M,N and O,P). The Aβ40 core of the neuritic plaques in sporadic AD revealed a centrally located pore, an uneven crust of HS tightly adhered to the outer surfaces and the close proximity of distressed/damaged nuclei (M,N). Initial analysis of the Aβ40 core of the neuritic plaques of Swedish βAPP 670/671 AD suggested complete colocalization between HS and Aβ (K). However, a basal view of the core revealed that Aβ40 is encapsulated by an outer layer of HS; this is confirmed by a saggital slice (white line in O) through the core (P). The absence of HS from the CWPs of PS‐1 Δ9 AD was also confirmed (L,Q,R). (Original magnification: A–C. 200×; D–I. 400×; J–R. 630×. Scale bar, 25 µm).
Using a confocal laser scanning microscope, z‐stacks of individual plaques were prepared. In sporadic AD, cross‐sectional analysis revealed how the Aβ40 core contained a small Aβ40‐free cavity and was encased in a thin incomplete layer of HS (Figure 1J). The core was isolated with IMARIS imaging software and presented in two three‐dimensional planes, highlighting the centrally located cavity, the tight adherence of HS distribution and the close proximity of distorted nuclei (Figure 1M,N).
In Swedish βAPP 670/671 AD, cross‐sectional analysis of an Aβ40 core suggested that HS is evenly distributed throughout the core (Figure 1K). However, by isolating and observing the core from a basal perspective, it became apparent that, as for sporadic AD, HS is confined to the superficial surface, essentially cocooning the dense Aβ40 core (Figure 1O). This observation was confirmed by a sagittal slice through the core (depicted as a white line in Figure 1O); the image is rotated to reveal the tightly adhered, outer layer of HS and again the close proximity of distorted nuclei (Figure 1P). These results suggest that the neuritic plaques have a spheroid shape, consisting of an Aβ40‐rich core encased in a layer of HS, surrounded by a void occupied by nuclei, which in turn is enclosed by a diffuse outer halo of HS and Aβ.
In an effort to analyze diffuse plaques, sections were double immunostained for Aβ42 and HS. In sporadic AD brain, these diffuse Aβ42 plaques showed great variability in their HS distribution pattern (Figure 1G), often displaying a complete absence of HS. In Swedish βAPP 670/671 AD brain, almost every diffuse Aβ42 plaque was void of any HS signal (Figure 1H). Finally, the Aβ42‐rich CWPs of PS‐1 Δ9 AD typically lacked HS colocalization (Figure 1I). This was confirmed by detailed confocal analysis (Figure 1L,Q,R). Previous findings have suggested that initiation of aggregation and deposition are dependent on the stabilizing and catalyzing abilities of HS. Here we present diffuse Aβ42‐rich plaques, which apparently developed independently of HS.
Quantitative image analysis of sporadic AD cases revealed that HS had a 10‐fold higher prevalence with Aβ40 in neuritic plaques than Aβ42 in diffuse plaques (Figure 2A) and occupied less than 1.5% of Aβ42 plaque areas (Figure 2B). In Swedish βAPP 670/671 AD, HS had a threefold higher prevalence with Aβ40 in neuritic plaques than Aβ42 in diffuse plaques (Figure 2A) and occupied less than 5% of Aβ42 plaque areas (Figure 2B). Finally, HS associated with approximately 20% of Aβ42 CWPs in PS‐1 Δ9 AD, but of these, less than 3% of the plaque area was HS positive (Figure 2A,B).
Figure 2.
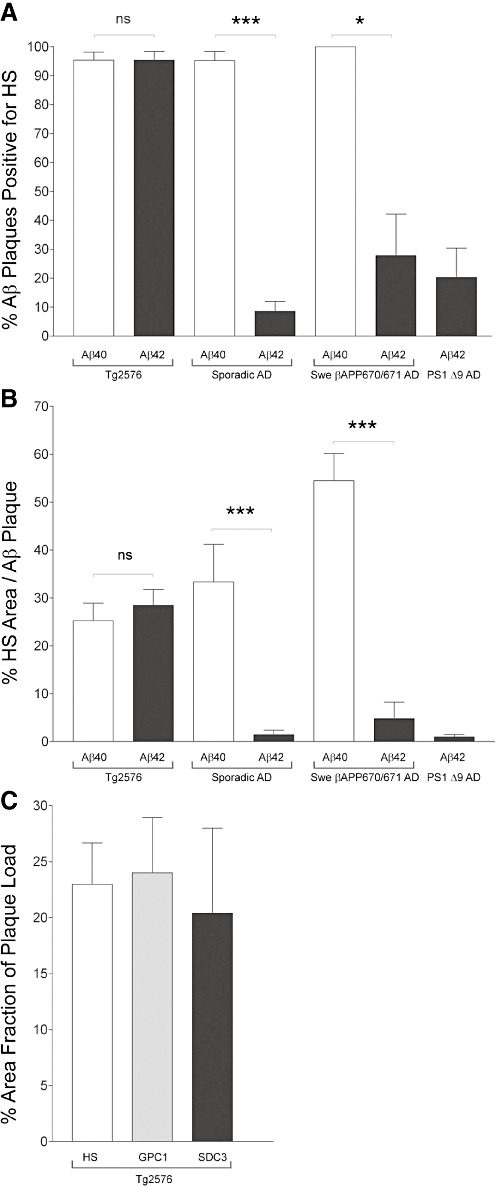
Quantitative image analyses. Quantitative image analyses of amyloid β‐peptide 40 (Aβ40) and Aβ42 plaques co‐immunostained with heparan sulfate (HS) revealed that HS associated indiscriminately with Aβ40 and Aβ42 in Tg2576 mice, but had a significantly higher prevalence with Aβ40 plaques in sporadic and Swedish βAPP 670/671 AD cases (A). Of the Aβ42 plaques in AD cases that were HS positve, less than 10% of the plaque area was colocalized with HS (B). HS associated with less than 30% of Aβ42 plaques from presenilin‐1 Δ9 AD (PS‐1 Δ9 AD) (A), and of these, less than 3% of the entire plaque area was HS positive (B). Analysis of immuonstaining for HS, glypican‐1 and syndecan‐3 revealed that there was no significant difference between their area fractions within the Aβ plaques in the hippocampus (C). The percentage area was normalized to the hippocampal plaque load as defined by 6E10 immunostaining [n = 3 − 7 sections per group (A) and n = 47 − 213 plaques per group (B). Data are mean +/− SEM. ***P < 0.0001, *P < 0.05, Student t‐test].
Aβ deposits of Tg2576 mice have a capsular composition with HS, GPC1 and SDC3 colocalization
As visualized with the 6E10 antibody, the majority of Aβ deposits in the cortex and molecular layer of the hippocampus (Figure 3A) of Tg2576 mice revealed a “doughnut” morphology. This was conserved irrespective of the deposit size, and showed a well defined outer and inner boundary and a mostly negatively staining center (Figure 3B). These deposits presented with the same ring‐like profile when immunostained with the HS antibody, 10E4 and antibodies against the membrane‐bound HSPGs, GPC1 and SDC3 (Figure 3C–E). Immunostaining was also performed for other HSPGs: agrin, perlecan, SDC1 and SDC2, but no significant immunosignal was obtained (data not shown). In an effort to explain the apparent hollow nature of the deposits' core, cryotome sections (25 µm thick) were stained with Congo red Sigma Aldrich (to demonstrate the distribution of β‐sheet structures in the deposit) and then analyzed by constructing a z‐stack with a laser scanning confocal microscope. Three 1‐µm‐thick z‐slices (Figure 3F), representing different levels of the deposit, demonstrated how at a depth of 17 µm the deposit's outer boundary is characterized by dense Congo red‐positive material. However, the center is void of any signal (white arrowhead). By contrast, at a more superficial layer of the deposit (depth 3 µm), the Congo red signal is more homogeneous, giving the impression that the hollow center is enclosed by a β‐sheet‐positive crust.
Figure 3.
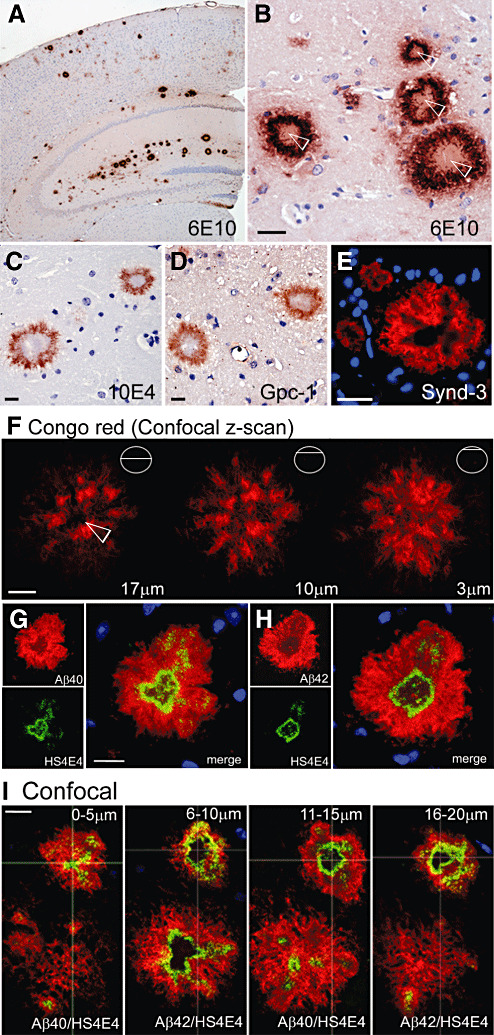
The ring morphology of amyloid β‐peptide (Aβ) deposits in Tg2576 mice was also displayed by heparan sulfate (HS), glypican‐1 (GPC1) and syndecan‐3 (SDC3). Paraffin‐embedded hippocampal sections (5 µm thick) were immunostained for Aβ (6E10), HS (10E4), GPC1 and SDC3, and counterstained for nuclei with DAPI (fluorescent blue) or hematoxylin (brightfield images). A. The anti‐Aβ antibody 6E10 revealed a high incidence of deposits in the molecular layer of the hippocampus and in the surrounding cortex. B–E. Morphological analysis of the deposits immunostained for 6E10, HS (10E4), GPC1 and SDC3 revealed highly comparable “doughnut” profiles with well defined inner and outer boundaries. The inner compartment of these deposits appeared to stain negatively. F. One‐µm thick, confocal z‐scans, of three representative slices (17 µm, 10 µm and 3 µm), through a 25‐µm thick Congo red fluorescent deposit, demonstrated the distribution of β‐sheet‐positive material throughout the deposit, except for its center, marked with a white arrow. G–H. Double immunostaining for Aβ40 or Aβ42 with HS (HS4E4) in adjacent sections (5 µm thick) revealed identical distribution patterns for both Aβ species. HS appears to line the inner boundary of the deposit enclosing the empty inner cavity. I. Confocal analysis of four adjacent sections (ie, 4 × 5 µm = 20 µm), alternately immunostained for Aβ40:HS and Aβ42:HS, revealed the capsular architecture of the deposit. The outer peripheries of the large deposit appeared diffuse (0–5 µm and 16–20 µm) with little HS association; however, the hollow cavity enclosed by HS is identified from 6–10 µm. The smaller deposit appeared to have a longer inner cavity, spanning 15 µm. However, the general structure is the same for both deposits. (Original magnification: A. 40×; B–E. 200×; F. 1000×; G–I. 400×. Scale bar, 20 µm).
Adjacent paraffin‐embedded sections (5 µm thick) were double immunostained for Aβ40 or Aβ42 and HS (HS4E4) and counterstained with DAPI for nuclei. Adjacent deposits revealed a complete overlap between both Aβ species (Figure 3G,H) and replicated the 6E10 doughnut profile observed in Figure 3B. HS was now detected with HS4E4 at the inner Aβ boundary (Figure 3G,H merge). In order to understand the distribution of HS within Aβ deposits, we double stained four adjacent sections (5 µm each) for Aβ40 or Aβ42 with HS and identified a pair of deposits, which were then analyzed by confocal laser scanning microscopy. The result suggests that HS is tightly adhered to the inner Aβ lining and defines the perimeter of a centrally located cavity, observed in the larger deposit from 6–10 µm and from 6–20 µm in the smaller deposit (Figure 3I). In summary, these deposits present as thick capsules of Aβ; they are positive for GPC1 and SDC3 and are lined with HS, which encloses a possibly empty chamber.
Quantitative image analysis was used to determine the prevalence and relative plaque area occupied by HS with Aβ40 or Aβ42. In Tg2576 mice, >95% of Aβ40 and Aβ42 plaques were HS positive (Figure 2A), with an average HS area fraction of approximately 30% (Figure 2B).
To quantify that GPC1 and SDC3 are potential suppliers of the observd HS, we recorded the relative area of HS, GPC1 and SDC3 immunostaining within the hippocampus of Tg2576 mice. These values were expressed as a percentage area fraction of the 6E10 immunosignal within the same region. HS, GPC1 and SDC3 occupied similar fractions (approximately 25%) of the plaque area, suggesting that both HSPGs are a significant source of the accumulated HS (Figure 2C).
GPC1 and SDC3 are expressed in glial cells surrounding Aβ deposits
Having found that the membrane‐bound HSPGs, GPC1 and SDC3 are present in Aβ deposits of Tg2576 mice, and hence, provide a potential source of the observed HS, we then analyzed their association with the neuritic plaques of sporadic and Swedish βAPP 670/671 AD and with the CWPs of PS‐1 Δ9 AD. Paraffin‐embedded sections were double immunostained for 6E10 and GPC1, SDC3 or GFAP and counterstained for nuclei with DAPI. Unlike Tg2576 mice where the GPC1 and SDC3 signal corresponded to the deposits Aβ morphology (Figure 3D,E), GPC1 and SDC3 showed little colocalization with 6E10 in both the sporadic and Swedish βAPP 670/671 AD cases. Instead, they were detected within the plaques, tightly associated with the distorted nuclei, which surround the plaque's core (Figure 4A,B,D,E). This GPC1 and SDC3 decoration of nuclei was also observed in PS‐1 Δ9 AD. However, these nuclei were not located within the CWPs and appeared normal (Figure 4C,F). As both GPC1 and SDC3 are membrane‐bound HSPGs, we were interested in determining a potential cell source for the intradeposit signals associated with the distorted nuclei. The astrocyte marker GFAP was strongly associated with nuclei found in the same intradeposit location as observed for GPC1 and SDC3 (Figure 4G,H). In contrast to the GFAP signal visible outside of the plaque, where characteristic projecting astrocytes were observed, the intradeposit GFAP signal appeared condensed, with little or no projections (Figure 4G,H zoom). Interestingly, the CWPs of PS‐1 Δ9 AD, shown not to colocalize with HS, also failed to stain for GFAP (Figure 4I); this observation supports previous studies, which demonstrate a poor glial response associated with CWPs (41). This result implicates GFAP‐positive cells as potential suppliers of the intradeposit GPC1 and SDC3, observed in neuritic plaques of sporadic and Swedish βAPP 670/671 AD.
Figure 4.
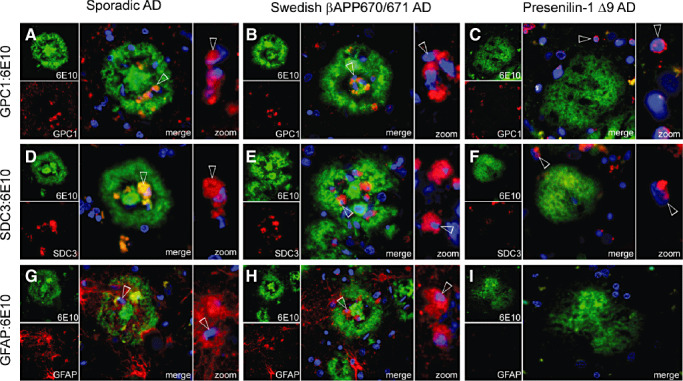
Glypican‐1 (GPC1), syndecan‐3 (SDC3) and glial fibrillary acidic protein (GFAP) were associated with intradeposit nuclei in sporadic and Swedish β‐amyloid precursor protein (βAPP) 670/671 AD. Paraffin‐embedded hippocampal sections (15 µm thick) were double immunostained for amyloid β‐peptide (Aβ) (6E10) and GPC1 (A–C), SDC3 (D–F) or GFAP (G–I) and counterstained with DAPI for nuclei (blue). Sporadic Alzheimer's disease (AD): The majority of nuclei surrounding the core of neuritic plaques with a wagon‐wheel morphology associate strongly with GPC1 (A), SDC3 (D) and GFAP (G) as highlighted in the zoom frames where 6E10 staining is omitted for clarity. SwedishβAPP 670/671 AD: Nuclei, typically surrounding the cores of neuritic plaques, demonstrate a strong association with GPC1 (B), SDC3 (E) and GFAP (H). Presenilin‐1Δ9 AD: A unique GPC1 signal was associated with a number of nuclei found in the vicinity of diffuse cotton wool plaques (CWPs), but never within the plaque area (C). A similar distribution was observed for SDC3 (F); however, GFAP was not detected around CWPs (I). (Original magnification: A–I. 400×.)
To further investigate the HSPG–glial association, we returned to Tg2576 mice. To ascertain which cell types, in addition to astrocytes, could be contributing to the HSPG presence, we stained Aβ plaques (in paraffin and cryotome sections) with Congo red and then immunostained with NeuN (neuronal nuclei marker), CNPase (oligodendrocyte marker), GFAP (astrocyte marker) and CD11b (microglial marker). NeuN‐ (Figure 5A) and CNPase‐positive cells (Figure 5B), while occasionally observed in the plaque peripheries, were never found in contact with the plaques. In contrast, GFAP‐positive cells densely surrounded all plaques projecting into the plaque body (Figure 5C). CD11b‐positive microglia, while not prominent in the area surrounding the plaques, were detected throughout the plaque body (Figure 5D). As astrocytes and microglia proved to be the prevailing cell types in physical contact with the plaques, we decided to investigate them as possible providers of the observed HS, GPC1 and SDC3.
Figure 5.
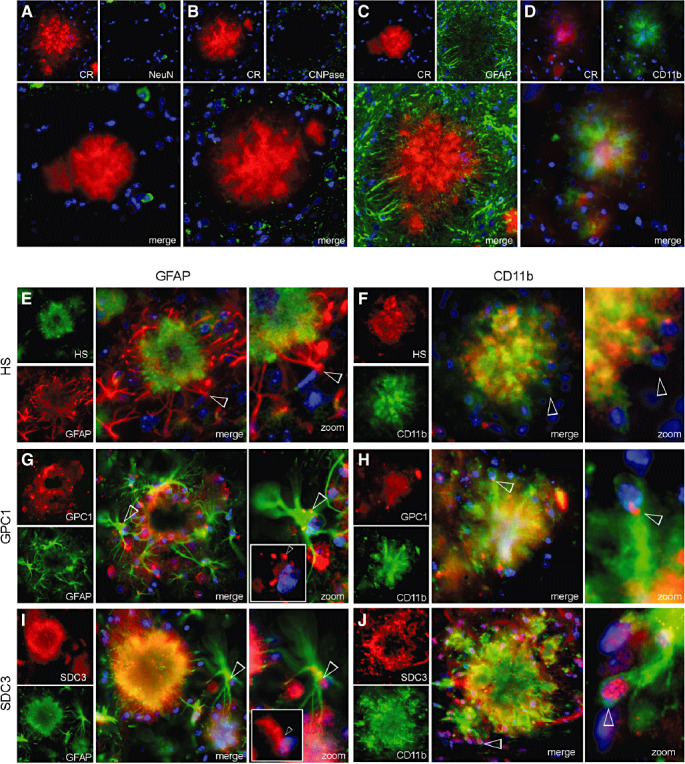
Glypican‐1 (GPC1) and syndecan‐3 (SDC3) were expressed in astrocytes and microglia surrounding amyloid β‐peptide (Aβ) deposits of Tg2576 mice. Congo red‐dyed sections were immunostained for the neuronal marker, neuronal nuclear protein (NeuN) (A), the oligodendrocyte marker, 2′,3′‐cyclic nucleotide 3′‐phosphodiesterase (CNPase) (B), the astrocyte marker, glial fibrillary acidic protein (GFAP) (C), the microglial marker CD11b (D) and counterstained for nuclei with DAPI (blue). This revealed that the predominant cell types surrounding and invading β‐amyloid plaques were astrocytes and microglia. Twenty‐five‐µm thick cryotome sections were double immunostained for heparan sulfate (HS), GPC1 and SDC3 with GFAP or CD11b. E. GFAP colocalizes with the outer boundary of HS‐positive deposits and sends projections inwards. No GFAP‐associated nuclei were found within the body of the deposit. F. Projections emanating from CD11b‐positive cell bodies colocalize strongly with HS throughout the deposit. G. Both GPC1 and GFAP revealed a diffuse signal comparable with the deposit's morphology (G merge). GFAP‐positive cells surrounding the deposit revealed a specific GPC1 signal associated with astrocyte nuclei (G zoom). H. The GPC1 and CD11b signal colocalize best toward the deposit center (H merge); however, a small intense GPC1 signal is associated with the nuclei in the microglial cell bodies at the outer boundary of the deposit (H zoom). I. SDC3 and GFAP reveal a strong colocalization which traces the deposit morphology (I merge). SDC3 was also associated with the nuclei of surrounding GFAP‐positive astrocytes, which project into the deposit (I zoom). J. SDC3 and CD11b colocalize around the ring profile of the deposit, while only CD11b is detected in the deposit center (J merge). At the deposit's outer boundary, microglial nuclei are strongly associated with SDC3 (J zoom). (Original magnification: A–F. 400×.)
Through double immunolabelling of cryotome sections (25 µm thick) for HS, GPC1 and SDC3 along with GFAP or CD11b, we were able to identify the HS and HSPG signal from individual glial cells associated with Aβ deposits. GFAP associated with nuclei at the outer boundary of Aβ deposits (Figure 5E merge), with projections that penetrated inwards, colocalizing with the HS ring structure (Figure 5E zoom). CD11b was also associated with nuclei at the deposit's boundary (Figure 5F zoom) and colocalized strongly with HS throughout the deposit (Figure 5F merge). Interestingly, no nuclei were stained within the deposit's center, suggesting that both the GFAP and CD11b intradeposit signals were derived from astrocyte and microglia projections, emanating from the deposit's outer surface. We then analyzed individual cells surrounding the deposits to obtain a more detailed picture of the HSPG–glial association. GPC1 was observed in the perinuclear region of GFAP‐positive astrocytes (Figure 5G merge and zoom), where it had a globular appearance; it was also found close to the nuclei of CD11b‐positive microglia (Figure 5H merge and zoom). SDC3 was similarly expressed in association with nuclei of GFAP‐positive astrocytes (Figure 5I merge and zoom) and CD11b‐positive microglia (Figure 5J merge and zoom) surrounding the deposits. This evidence suggests that the HS associated with Aβ deposits in Tg2576 mice may be derived from glial expression of GPC1 and SDC3.
Levels of GPC1 and SDC3 are increased via Aβ stimulation in vitro
To examine whether the observed expression of GPC1 and SDC3 is induced in glia by Aβ stimulation, we prepared purified astrocyte and microglia cultures from primary murine glia culture. Immunostaining revealed that both cell types expressed GPC1 and SDC3 (Figure 6A–D). Western blot revealed the core protein bands at ∼64 kDa for GPC1 and ∼120 kDa for SDC3 (30). Quantatitive analyses demonstrated that treatment with aged Aβ1‐42 at 100 and 1000 nM for 24 h resulted in a significant increase in the protein level of both GPC1 and SDC3 (Figure 6A–D).
Figure 6.
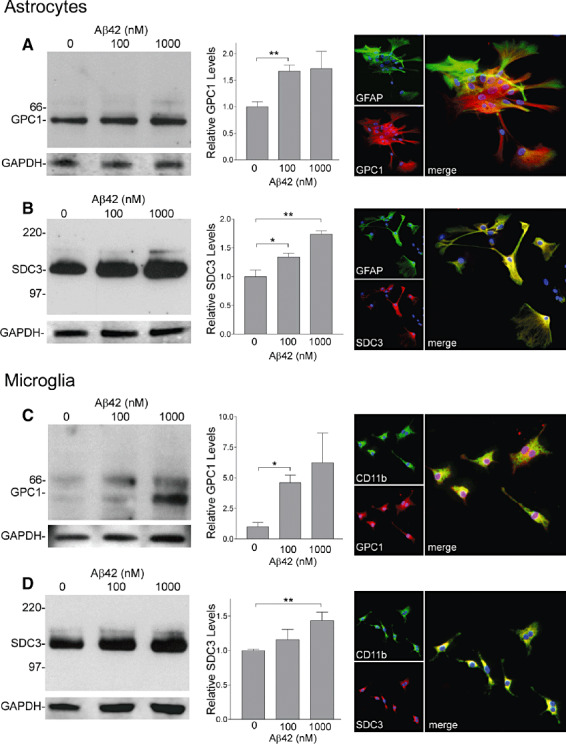
Glypican‐1 (GPC1) and syndecan‐3 (SDC3) levels were increased by amyloid β‐peptide (Aβ) stimulation in primary murine microglial and astrocyte culture. C57BL neonatal primary microglia and astrocytes were incubated in the presence or absence of 100 and 1000 nM of aged Aβ1‐42 for 24 h. For quantatitive analyses, GPC1 or SDC3 band intensities were normalized to glyceraldehyde‐3‐phosphate dehydrogenase signals. Significant increases in protein levels of GPC1 and SDC3 were observed in both primary astrocytes and microglia following Aβ stimulation. Double immunostaining for glial fibrillary acidic protein or CD11b with GPC1 or SDC3 confirmed that astrocytes (A,B) and microglia (C,D) were positive for these membrane‐bound heparan sulfate proteoglycans (data are mean +/− SEM of triplicate experiments; *P < 0.05, **P < 0.01, Student t‐test. Original magnification: A–D. 200×).
DISCUSSION
In this study, we observed the preferential accumulation of HS with the dense Aβ40 cores of neuritic plaques in sporadic and Swedish βAPP 670/671 AD and its near absence from diffuse Aβ42‐rich plaques, specifically the CWPs of PS‐1 Δ9 AD. These observations suggest that HS is not a limiting factor in initiation of Aβ42 deposition. We demonstrated that GPC1 and SDC3 are associated with intradeposit astrocytes around the Aβ40 core of neuritic plaques of AD and with both astrocytic and microglial nuclei surrounding the Aβ deposits of Tg2576 mice. In contrast, diffuse plaques in AD showed no intradeposit presence of GPC1 or SDC3 and did not appear to incite an astrocytic response. We also observed increased levels of GPC1 and SDC3 in cultures of primary astrocytes and microglial cells following stimulation with Aβ1‐42. From these observations, we suggest that one potential source of HS, observed in Aβ deposits, are the membrane‐bound HSPGs, GPC1 and SDC3, which are expressed in glial cells as a result of Aβ stimulation. This hypothesis is enforced by the findings in diffuse plaques, where the lack of surrounding or intradeposit astrocytes may explain the absence of GPC1, SDC3 and consequently, HS.
HS distribution in Aβ deposits of AD and Tg2576 mice: similarities and differences
The neuritic plaques, with dense cores, of sporadic and Swedish βAPP 670/671 AD presented with a wagon‐wheel morphology, in which the central Aβ40‐positive cores were encapsulated by a superficial layer of HS (appearing as rings in section) and surrounded by cells with apparently damaged nuclei. This core location of Aβ40 has been described for sporadic AD (27), and in a recent study, plaque cores were purified from AD brain and confirmed to be congophilic (36). The doughnut profile, observed for Aβ deposits in Tg2576 mice, consists of a well defined outer and inner boundary enclosing a chamber, which appears to be Aβ negative. Similar HS ring structures, as observed in AD, were detected in Tg2576 mice; however, they lined the inside rather than the outside of these deposits. A further contrast in Tg2576 mice was the lack of differentiation between Aβ40 and Aβ42 distribution in the deposit. HS associated equally with both species, not demonstrating the Aβ42 discrimination observed in diffuse plaques of AD. This equality was verified by image analysis, which demonstrated a near absolute prevalence of HS with Aβ40 and Aβ42, and that HS occupied a similar plaque area fraction for both species.
The centrally located cavity is difficult to explain and we initially considered that the antibodies used were simply unable to recognize epitopes within this site because of the presence of highly compact Aβ. Congo red was used in conjunction with confocal laser scanning microscopy to assess the distribution of β‐sheet secondary structures within the deposit, and although the same pattern was not observed for all deposits, there was typically an absence of signal from the cavity location.
The doughnut morphology was also observed in immunostainings for HS, GPC1 and SDC3, but not for agrin, perlecan, syndecan‐1 or syndecan‐2. In addition, quantitative image analysis of HS, GPC1 and SDC3 immunostainig confirmed that they occupied similar fractions of the hippocampal Aβ area. These findings strongly suggested that the HS identified in Tg2576 mice Aβ deposits was derived from specific membrane‐bound HSPGs.
Deposition of diffuse Aβ42‐rich plaques occurs independently of HS in AD
It has been suggested that “primitive” or “diffuse” Aβ plaques represent early lesions, prior to clinical dementia, and that such deposits evolve into neuritic plaques over time (13). In favor of this idea are studies of Down's syndrome cases, where diffuse Aβ42 immunoreactive plaques are the first to be observed in post‐mortem brains of young patients 14, 20. However, this hypothesis has been challenged with evidence suggesting that different deposit types form independently of each other (4). It has been proposed that HS is a common constituent of all amyloid deposits, where it is believed to facilitate early deposition, proceeding to stabilize and catalyze fibrillization 15, 33.
We recently demonstrated that mice overexpressing heparanase, resulting in fragmentation of HS chains, were resistant to amyloid protein A amyloidosis (21), enforcing the concept that HS is a critical factor in amyloid deposition. In the present study, we failed to observe any significant coaccumulation of HS with Aβ42 in CWPs of PS‐1 Δ9 AD, or in diffuse plaques of Swedish βAPP 670/671 AD and sporadic AD cases. To quantitatively establish these observations, we analyzed the prevalence of HS with Aβ42 in all AD cases and confirmed a low frequency of colocalization. We demonstrated that the HS area fraction of Aβ42 diffuse plaques, which did colocalize, was less than 5%, decreasing to less than 3% in the CWPs of PS‐1 Δ9 AD. In stark contrast, HS colocalized with essentially all Aβ40‐positive plaques and occurred throughout a substantial fraction of the plaque area. Previous analyses of HS distribution in diffuse Aβ plaques have been largely confined to sporadic cases of AD and provide mixed support for our findings. Snow et al (35) described the presence of HS in diffuse plaques of the hippocampus, but not in the cerebellum. Van Gool et al (38) performed a similar study with antibodies against HS chains and HSPGs and failed to stain preamyloid/diffuse plaques. If such diffuse plaques are in fact precursors of neuritic amyloid plaques, this result argues against a key role for HS in initiating Aβ deposition in AD. Instead, the independent formation of diffuse plaques (lacking HS) and neuritic plaques (containing HS) seems more likely.
GPC1 and SDC3 are expressed in Aβ‐associated glial cells
Having identified GPC1 and SDC3 as the potential sources for HS in Aβ deposits of Tg2576 mice, we decided to probe for their presence in Aβ deposits from AD cases. As both are membrane‐bound HSPGs, we were also interested in evaluating their cell sources. An in vitro study of the binding interaction between HS and Aβ showed that the N‐terminally located HHQK domain, an alleged HS‐binding motif, was required for microglial binding to Aβ and concluded that this binding was mediated by HS bound to the microglial membrane (8). Both GPC1 and SDC3 are membrane‐bound HSPGs and are principally expressed in the developing CNS (37). However, several studies have also identified upregulation of GPC1 10, 11 and SDC3 12, 19 in glial cells following brain injury in rodents. We now examined the distribution of GPC1 and SDC3 in individual Aβ plaques and established their presence in glial cells associated with the cores of neuritic plaques. In sporadic and Swedish βAPP 670/671 AD cases, GPC1 and SDC3 appear to be tightly adhered to dystrophic astrocytes, which were identified close to the HS‐encrusted Aβ40 cores. This notion has previously been asserted in a study of HSPGs in senile plaques in AD (34). We hypothesize that astrocytes, attempting to clear Aβ, express GPC1 and SDC3, and consequently, HS. Because of the interaction between HS and Aβ and their potential mutually protective relationship, HS is not degraded and represents the remnants of astrocytes that have responded to the deposit during its lifetime. This proposal is corroborated by the absence of HS from diffuse Aβ42‐rich deposits that are void of astrocytes, GPC1 and SDC3.
We identified a similar perinuclear presence of both GPC1 and SDC3 in astrocytes and microglia of Tg2576 mice. The principal difference between Tg2576 mice and AD cases was the location and appearance of the glial cell bodies, which in the mouse were confined to the outer boundary of the deposit and presented with more characteristic astrocytic and microglial morphologies. HS, as observed by 10E4 immunostaining, occurs throughout the deposit, and as such, both astrocytes and microglia expressing GPC1 and SDC3 could contribute to its presence. However, HS identified by the antibody HS4E4 defined the inner boundary of the deposit and enclosed the central cavity. In this intradeposit location, microglial rather than astrocytic projections were detected, suggesting that specific cell types may contribute to the HS observed in different deposit locations.
Finally, we demonstrated that GPC1 and SDC3 are expressed in purified primary astrocyte and microglial culture, and that Aβ42 can induce a dose‐dependent increase of their levels, supporting the notion that the observed expression of GPC1 and SDC3 in glia surrounding the deposits of AD and Tg2576 mice is mediated by Aβ.
ACKNOWLEDGMENTS
We would like to thank Guido David (University of Leuven), Lars‐Åke Fransson and Fang Cheng (Lund University) for contributing antibodies.
Supported by The Swedish Research Council (2006–2822, 2006–2818, 32X‐15023), Landstinget i Uppsala län, European Commission (EURAMY), Polysackaridforskning AB Uppsala, Alzheimerfonden, Stohnes Stiftelse, Stiftelsen för Gamla Tjänarinnor, Stiftelsen Demensfonden, The Swedish Brain Foundation, Bertil Hållstens Forskningsstiftelse and the Massachusetts Alzheimer Disease Research Center PS0AG05134.
REFERENCES
- 1. Annaert W, De Strooper B (2002) A cell biological perspective on Alzheimer's disease. Annu Rev Cell Dev Biol 18:25–51. [DOI] [PubMed] [Google Scholar]
- 2. Bame KJ, Danda J, Hassall A, Tumova S (1997) Abeta(1–40) prevents heparanase‐catalyzed degradation of heparan sulfate glycosaminoglycans and proteoglycans in vitro. A role for heparan sulfate proteoglycan turnover in Alzheimer's disease. J Biol Chem 272:17005–17011. [DOI] [PubMed] [Google Scholar]
- 3. Bernfield M, Gotte M, Park PW, Reizes O, Fitzgerald ML, Lincecum J, Zako M (1999) Functions of cell surface heparan sulfate proteoglycans. Annu Rev Biochem 68:729–777. [DOI] [PubMed] [Google Scholar]
- 4. D'Andrea, MR , Cole GM, Ard MD (2004) The microglial phagocytic role with specific plaque types in the Alzheimer disease brain. Neurobiol Aging 25:675–683. [DOI] [PubMed] [Google Scholar]
- 5. Dennissen MA, Jenniskens GJ, Pieffers M, Versteeg EM, Petitou M, Veerkamp JH, Van Kuppevelt TH (2002) Large, tissue‐regulated domain diversity of heparan sulfates demonstrated by phage display antibodies. J Biol Chem 277:10982–10986. [DOI] [PubMed] [Google Scholar]
- 6. Esko JD, Lindahl U (2001) Molecular diversity of heparan sulfate. J Clin Invest 108:169–173. [DOI] [PMC free article] [PubMed] [Google Scholar]
- 7. Fransson LA (2003) Glypicans. Int J Biochem Cell Biol 35:125–129. [DOI] [PubMed] [Google Scholar]
- 8. Giulian D, Haverkamp LJ, Yu J, Karshin W, Tom D, Li J et al (1998) The HHQK domain of beta‐amyloid provides a structural basis for the immunopathology of Alzheimer's disease. J Biol Chem 273:29719–29726. [DOI] [PubMed] [Google Scholar]
- 9. Gupta‐Bansal R, Frederickson RC, Brunden KR (1995) Proteoglycan‐mediated inhibition of A beta proteolysis. A potential cause of senile plaque accumulation. J Biol Chem 270:18666–18671. [DOI] [PubMed] [Google Scholar]
- 10. Hagino S, Iseki K, Mori T, Zhang Y, Hikake T, Yokoya S et al (2003) Slit and glypican‐1 mRNAs are coexpressed in the reactive astrocytes of the injured adult brain. Glia 42:130–138. [DOI] [PubMed] [Google Scholar]
- 11. Hagino S, Iseki K, Mori T, Zhang Y, Sakai N, Yokoya S et al (2003) Expression pattern of glypican‐1 mRNA after brain injury in mice. Neurosci Lett 349:29–32. [DOI] [PubMed] [Google Scholar]
- 12. Iseki K, Hagino S, Mori T, Zhang Y, Yokoya S, Takaki H et al (2002) Increased syndecan expression by pleiotrophin and FGF receptor‐expressing astrocytes in injured brain tissue. Glia 39:1–9. [DOI] [PubMed] [Google Scholar]
- 13. Iwatsubo T, Odaka A, Suzuki N, Mizusawa H, Nukina N, Ihara Y (1994) Visualization of A beta 42(43) and A beta 40 in senile plaques with end‐specific A beta monoclonals: evidence that an initially deposited species is A beta 42(43). Neuron 13:45–53. [DOI] [PubMed] [Google Scholar]
- 14. Iwatsubo T, Mann DM, Odaka A, Suzuki N, Ihara Y (1995) Amyloid beta protein (A beta) deposition A beta 42(43) precedes A beta 40 in Down syndrome. Ann Neurol 37:294–299. [DOI] [PubMed] [Google Scholar]
- 15. Kisilevsky R, Fraser PE (1997) A beta amyloidogenesis: unique, or variation on a systemic theme? Crit Rev Biochem Mol Biol 32:361–404. [DOI] [PubMed] [Google Scholar]
- 16. Kisilevsky R, Lemieux LJ, Fraser PE, Kong X, Hultin PG, Szarek WA (1995) Arresting amyloidosis in vivo using small‐molecule anionic sulphonates or sulphates: implications for Alzheimer's disease. Nat Med 1:143–148. [DOI] [PubMed] [Google Scholar]
- 17. Kreuger J, Spillmann D, Li JP, Lindahl U (2006) Interactions between heparan sulfate and proteins: the concept of specificity. J Cell Biol 174:323–327. [DOI] [PMC free article] [PubMed] [Google Scholar]
- 18. Lannfelt L, Viitanen M, Johansson K, Axelman K, Lilius L, Almqvist E, Winblad B (1993) Low frequency of the APP 670/671 mutation in familial Alzheimer's disease in Sweden. Neurosci Lett 153:85–87. [DOI] [PubMed] [Google Scholar]
- 19. Leadbeater WE, Gonzalez AM, Logaras N, Berry M, Turnbull JE, Logan A (2006) Intracellular trafficking in neurones and glia of fibroblast growth factor‐2, fibroblast growth factor receptor 1 and heparan sulphate proteoglycans in the injured adult rat cerebral cortex. J Neurochem 96:1189–1200. [DOI] [PubMed] [Google Scholar]
- 20. Lemere CA, Blusztajn JK, Yamaguchi H, Wisniewski T, Saido TC, Selkoe DJ (1996) Sequence of deposition of heterogeneous amyloid beta‐peptides and APO E in Down syndrome: implications for initial events in amyloid plaque formation. Neurobiol Dis 3:16–32. [DOI] [PubMed] [Google Scholar]
- 21. Li JP, Galvis ML, Gong F, Zhang X, Zcharia E, Metzger S et al (2005) In vivo fragmentation of heparan sulfate by heparanase overexpression renders mice resistant to amyloid protein a amyloidosis. Proc Natl Acad Sci USA 102:6473–6477. [DOI] [PMC free article] [PubMed] [Google Scholar]
- 22. Lindahl B, Westling C, Gimenez‐Gallego G, Lindahl U, Salmivirta M (1999) Common binding sites for beta‐amyloid fibrils and fibroblast growth factor‐2 in heparan sulfate from human cerebral cortex. J Biol Chem 274:30631–30635. [DOI] [PubMed] [Google Scholar]
- 23. Maccarana M, Casu B, Lindahl U (1994) Minimal sequence in heparin/heparan sulfate required for binding of basic fibroblast growth factor. J Biol Chem 269:3903. [PubMed] [Google Scholar]
- 24. Mann DM, Takeuchi A, Sato S, Cairns NJ, Lantos PL, Rossor MN et al (2001) Cases of Alzheimer's disease due to deletion of exon 9 of the presenilin‐1 gene show an unusual but characteristic beta‐amyloid pathology known as “cotton wool” plaques. Neuropathol Appl Neurobiol 27:189–196. [DOI] [PubMed] [Google Scholar]
- 25. Mark RJ, Keller JN, Kruman I, Mattson MP (1997) Basic FGF attenuates amyloid beta‐peptide‐induced oxidative stress, mitochondrial dysfunction, and impairment of Na+/K+‐ATPase activity in hippocampal neurons. Brain Res 756:205–214. [DOI] [PubMed] [Google Scholar]
- 26. McLaurin J, Franklin T, Zhang X, Deng J, Fraser PE (1999) Interactions of Alzheimer amyloid‐beta peptides with glycosaminoglycans effects on fibril nucleation and growth. Eur J Biochem 266:1101–1110. [DOI] [PubMed] [Google Scholar]
- 27. McNamara MJ, Gomez‐Isla T, Hyman BT (1998) Apolipoprotein E genotype and deposits of Abeta40 and Abeta42 in Alzheimer disease. Arch Neurol 55:1001–1004. [DOI] [PubMed] [Google Scholar]
- 28. Mullan M, Crawford F, Axelman K, Houlden H, Lilius L, Winblad B, Lannfelt L (1992) A pathogenic mutation for probable Alzheimer's disease in the APP gene at the N‐terminus of beta‐amyloid. Nat Genet 1:345–347. [DOI] [PubMed] [Google Scholar]
- 29. Saura J, Tusell JM, Serratosa J (2003) High‐yield isolation of murine microglia by mild trypsinization. Glia 44:183–189. [DOI] [PubMed] [Google Scholar]
- 30. Schofield KP, Gallagher JT, David G (1999) Expression of proteoglycan core proteins in human bone marrow stroma. Biochem J 343:663–668. [PMC free article] [PubMed] [Google Scholar]
- 31. Selkoe DJ (2000) Toward a comprehensive theory for Alzheimer's disease. Hypothesis: Alzheimer's disease is caused by the cerebral accumulation and cytotoxicity of amyloid beta‐protein. Ann NY Acad Sci 924:17–25. [DOI] [PubMed] [Google Scholar]
- 32. Selkoe DJ (2001) Alzheimer's disease: genes proteins and therapy. Physiol Rev 81:741–766. [DOI] [PubMed] [Google Scholar]
- 33. Snow AD, Willmer J, Kisilevsky R (1987) Sulfated glycosaminoglycans: a common constituent of all amyloids? Lab Invest 56:120–123. [PubMed] [Google Scholar]
- 34. Snow AD, Mar H, Nochlin D, Kimata K, Kato M, Suzuki S et al (1988) The presence of heparan sulfate proteoglycans in the neuritic plaques and congophilic angiopathy in Alzheimer's disease. Am J Pathol 133:456–463. [PMC free article] [PubMed] [Google Scholar]
- 35. Snow AD, Sekiguchi RT, Nochlin D, Kalaria RN, Kimata K (1994) Heparan sulfate proteoglycan in diffuse plaques of hippocampus but not of cerebellum in Alzheimer's disease brain. Am J Pathol 144:337–347. [PMC free article] [PubMed] [Google Scholar]
- 36. Soderberg L, Bogdanovic N, Axelsson B, Winblad B, Naslund J, Tjernberg LO (2006) Analysis of single Alzheimer solid plaque cores by laser capture microscopy and nanoelectrospray/tandem mass spectrometry. Biochemistry 45:9849–9856. [DOI] [PubMed] [Google Scholar]
- 37. Tumova S, Woods A, Couchman JR (2000) Heparan sulfate proteoglycans on the cell surface: versatile coordinators of cellular functions. Int J Biochem Cell Biol 32:269–288. [DOI] [PubMed] [Google Scholar]
- 38. Van Gool D, David G, Lammens M, Baro F, Dom R (1993) Heparan sulfate expression patterns in the amyloid deposits of patients with Alzheimer's and Lewy body type dementia. Dementia 4:308–314. [DOI] [PubMed] [Google Scholar]
- 39. Van Horssen J, Kleinnijenhuis J, Maass CN, Rensink AA, Otte‐Holler I, David G et al (2002) Accumulation of heparan sulfate proteoglycans in cerebellar senile plaques. Neurobiol Aging 23:537–545. [DOI] [PubMed] [Google Scholar]
- 40. Van Horssen J, Wesseling P, Van Den Heuvel LP, De Waal RM, Verbeek MM (2003) Heparan sulphate proteoglycans in Alzheimer's disease and amyloid‐related disorders. Lancet Neurol 2:482–492. [DOI] [PubMed] [Google Scholar]
- 41. Verkkoniemi A, Kalimo H, Paetau A, Somer M, Iwatsubo T, Hardy J, Haltia M (2001) Variant Alzheimer disease with spastic paraparesis: neuropathological phenotype. J Neuropathol Exp Neurol 60:483–492. [DOI] [PubMed] [Google Scholar]
- 42. Whitelock JM, Iozzo RV (2005) Heparan sulfate: a complex polymer charged with biological activity. Chem Rev 105:2745–2764. [DOI] [PubMed] [Google Scholar]