

Abstract
The dendritic cell (DC) is a master regulator of immune responses. Pathogenic viruses subvert normal immune function in DCs through the expression of immune antagonists. Understanding how these antagonists interact with the host immune system requires knowledge of the underlying genetic regulatory network that operates during an uninhibited antiviral response. In order to isolate and identify this network, we studied DCs infected with Newcastle Disease Virus (NDV), which is able to stimulate innate immunity and DC maturation through activation of RIG-I signaling, but lacks the ability to evade the human interferon response. To analyze this experimental model, we developed a new approach integrating genome-wide expression kinetics and time-dependent promoter analysis. We found that the genetic program underlying the antiviral cell-state transition during the first 18-hours post-infection could be explained by a single convergent regulatory network. Gene expression changes were driven by a step-wise multi-factor cascading control mechanism, where the specific transcription factors controlling expression changed over time. Within this network, most individual genes are regulated by multiple factors, indicating robustness against virus-encoded immune evasion genes. In addition to effectively recapitulating current biological knowledge, we predicted, and validated experimentally, antiviral roles for several novel transcription factors. More generally, our results show how a genetic program can be temporally controlled through a single regulatory network to achieve the large-scale genetic reprogramming characteristic of cell state transitions.
Introduction
Dendritic cells (DCs) play a key role in the early immune response to viral infections. Activation of viral pattern sensors, such as RIG-I and MDA5, triggers a transcriptional program that includes the production of Type I interferons (IFNs). These antiviral cytokines signal in both autocrine and paracrine fashion through the JAK-STAT pathway leading to additional transcription events involving the differential expression of many hundreds of genes. The “antiviral state” produced by this extensive genetic reprogramming involves a core set of genes as well as pathogen-specific components (1).
The DC response to individual pathogens involves multiple signals that must be integrated to initiate an appropriate immune response. Pathogenic viruses attempt to subvert normal immune function through the expression of interferon antagonists (2, 3). For example, IRF3 activation and IFN-β expression are blocked by the NS1 protein of influenza (4). Unraveling the impact of these immune antagonists would be aided by a detailed understanding of the genetic regulatory network that operates during an uninhibited antiviral response. This knowledge is lacking since previous human studies have used viruses that interfere with the immune response (4-6). One fundamental unresolved question is to what extent the antiviral response is a single interconnected transcriptional cascade (convergent architecture) or a combination of transcriptional events operating independently in reaction to the multiple signals that arise following viral insult (parallel architecture). Newcastle Disease Virus (NDV) infection of human DCs provides an ideal system to systematically define the uninhibited regulatory network (7, 8). NDV is an avian virus that is able to stimulate innate immunity and DC maturation, but lacks the ability to evade the human interferon response (9). By focusing on NDV we can accurately depict the baseline network of transcription factor (TF) interactions that underlie a broad range of immune responses. Through comparative studies, this network will enable detailed analysis of other infections and greatly improve our understanding of the control mechanisms in antiviral immunity and the myriad ways through which pathogenic viruses subvert normal immune function.
Systems biology methods combined with high-throughput experimental technologies are providing new insights into virus-host interactions (10, 11). Genome-wide transcriptional profiling has suggested that the DC antiviral response is characterized by temporal waves of gene activation, which may be controlled by different combinations of transcriptional regulators (1). Potential regulators can be implicated using direct approaches, such as differential-expression of the transcription factor mRNA (1), or indirectly by identification of common cis-regulatory motifs (12, 13). These methods typically provide a static view of the network. Other computational methods have been proposed to identify transcription factors driving time-dependent changes in expression, but these do not explicitly account for the regulation of the TF itself (14, 15). The most common approaches are based on the hypothesis that genes sharing a similar temporal profile are regulated by common transcription factors (16). In mammals, a variety of post-transcriptional regulatory mechanisms can impact mRNA kinetics following up-regulation (17), so that requiring similarity across the entire time-series may be unnecessarily restrictive. As an alternative, we propose to focus on the initial up-regulation time as a criterion to identify genes that are likely to share common regulatory control logic.
We developed and validated by experiment a new approach integrating genome-wide expression kinetics and time-dependent promoter analysis. Our method infers the transcription factors driving initial gene expression changes, determines the timing of their activity and identifies a causal chain of regulation. We have applied this approach to the anti-NDV response in human DCs to deduce the causality and coherence of the transcriptional events responsible for the complex gene regulation elicited by virus infection. Along with many expected factors (e.g., IRFs and STATs), key roles were predicted and experimentally validated for several regulators with no previously known role in antiviral responses. Our approach identified a single transcriptional cascade that spanned the experimental time-series and could account for observed expression changes in a majority of all up-regulated genes.
Materials and Methods
Multiple sample gene array time-course following NDV infection of isolated dendritic cells
Differentiation of DCs
Monocyte-derived conventional DCs were obtained from human blood donors following a standard protocol (18, 19). Briefly, human monocytes from buffy coats were isolated by Ficoll density gradient centrifugation (Histopaque, Sigma Aldrich) and CD14+ monocytes were immunomagnetically purified by using a MACS CD14 isolation kit (Miltenyi Biotech.). CD14+ Monocytes (0.7×10⁶ cells/ml) were later differentiated into immature cDCs after 5-6 day incubation in DC growth media (RPMI Medium 1640 (Gibco), 10% fetal calf serum (Hyclone), 2 mM of L-glutamine, 100 units/ml penicillin, 100 μg/ml streptomycin (Pen/Strep) (Invitrogen), 500 units/ml hGM-CSF (Preprotech) and 1000 units/ml hIL-4 (Preprotech) at 37°C.
Virus preparation and viral infection
The recombinant Hitchner strain of Newcastle Disease Virus (rNDV/B1) was prepared and aliquots of allantoic fluid were harvested as previously described (20). NDV virus stock was titered by infection of Vero cell plates and identification of viral growth by the addition of monoclonal antibodies specific for NDV HN protein (Mount Sinai Hybridoma Core Facility) followed by addition of anti-mouse IgG-FITC and visualization using fluorescent microscopy. Tittered NDV stock was diluted in Dulbecco's Modified Eagle Medium (DMEM) and added directly into pelleted DCs at a multiplicity of infection (MOI) of 0.5 prepared as previously described (21). After incubation for 30 minutes at 37°C, fresh DC growth medium was added back to the infected DCs (1.0×10⁶ cells/ml). Virus free allantoic fluid was added to additional tubes of cells to serve as a negative control.
Microarray experiments
Total RNA was purified from 2.5×10⁶ DCs per time sample using RNeasyMicro (Qiagen) with DNase treatment. RNA was eluted from columns using water and quantified by spectrophotometry. Quality control of RNAs was performed using the Agilent Bioanalyzer. Total RNA from cells of two different donors were infected with NDV or control and harvested at : 0, 1, 2, 6, 10 and 18 hour for control and 1, 2, 4, 6, 8, 10, 12, 14, 16 and 18 hours for NDV infection. Biological replicates were performed for both of these donors. A third donor was not included in the current analysis because no replicate measurements were made. Good quality RNA was reverse transcribed using T7-oligo(dT)24 to yield double stranded cDNA. cRNA was transcribed and biotinylated from cDNA templates. Fragmented cRNA was hybridized to Affymetrix HU133plus2 Gene Chip Arrays by Mount Sinai Microarray Shared Resource Facility. All microarrays studied in this paper have been deposited in the Gene Expression Omnibus (http://www.ncbi.nlm.nih.gov/geo) with the series accession number GSE18791
Microarray analysis
Raw Affymetrix microarray data were normalized using gcRMA. Differential expression was defined for each probeset using four criteria. For at least one time-point in each of the experiments, we required: (1) a minimum log2 intensity of 5, which was indicative of non-expressed genes by visual inspection of the expression intensity histogram at time-zero, (2) an absolute fold-change of at least two relative to time-zero, (3) a significant change in expression by LIMMA (BioConductor implementation) after correction for multiple hypothesis testing (q < 0.005) (22). The fourth criterion for defining differential expression required that the probeset did not meet criteria 2 and 3 above in the control time-series. In analysis where a background set of genes was required, it was defined as the set of genes from all time points that met criterion 3 (significant change by LIMMA), without regard to either of the other criteria. All of this analysis was performed using the BioConductor software package in R. Gene ontology analysis was performed using the conditional test in the GOstats package (23).
Comparing the timing of response progression
Estimating the up-regulation time for genes
The initial up-regulation time for each gene was estimated by fitting the mRNA expression time-series following NDV infection to a logistic function (Equation 1). Parameters (A, K, I and C) were estimated by minimizing the sum-squared error using differential evolution with modified sampling. To neutralize the undue influence of high intensity gene array results we divided the error at each time point by its intensity. The up-regulation time for each gene was defined as the time of maximal change in the acceleration of the logistic function (star in Figure 1). This point can be calculated by finding the maximum of the third derivative (i.e., the first time at which the fourth derivative of the logistic function equals zero). Estimates of the up-regulation time were considered acceptable if they fell between 0 and 18 hours (i.e., the time-points included in the fit). Note that the value for time-point zero in the fitting was taken from the appropriate control gene arrays since measurements of time zero were done only for the control experiments.
Figure 1. Model-based estimation of the up-regulation time for individual genes.
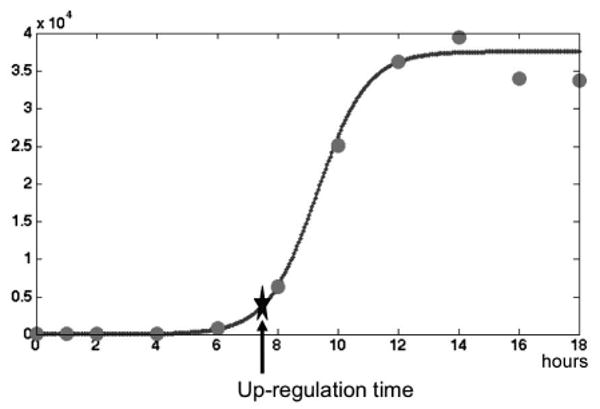
The up-regulation time for each gene was determined by fitting a logistic function (solid line) to the experimentally-measured mRNA expression values from a single experiment (circles). The estimated time of up-regulation was defined as the maximal change in the acceleration of the logistic function and is indicated by a star. This example shows IFNB1 expression from Donor 2 Sample 1.
| (EQUATION 1: Logistic function) |
Transcription factor binding site analysis
Using the UCSC Genome Bioinformatics site, we downloaded the TSS for all human RefSeq genes, defined by the March 2006 refGene table (24). The region 2Kb upstream of each TSS was identified within a genome-wide multiple alignment of 27 vertebrate species to the human genome (25), also available through UCSC Genome Bioinformatics site. In order to identify putative transcription factor binding sites, the human sequences, along with aligned regions from chimp and mouse, were analyzed using the TRANSFAC MATCH (26) algorithm with a cutoff chosen to minimize the sum of false positives and false negatives. The analysis was performed for all vertebrate transcription factor matrices in the 2008.3 release of TRANSFAC (27), and putative binding sites were considered to be evolutionarily conserved if matches were also found at the aligned positions in both chimp and mouse sequences and had no gaps present in the multiple alignment. Each TRANSFAC matrix was linked to a set of gene symbols describing potential binding factors using annotations present in the “Binding Factor” field of the database. Only vertebrate TRANSFAC matrices that could be linked to a human (HGNC) gene symbol (28), either directly or through an alias listed in NCBI gene, were included. To build the regulatory network we further refined the list of transcription factors to include only those that were up-regulated in our microarray time-series.
Time dependent promoter analysis and regulatory network construction
We constructed a regulatory network by inferring transcriptional regulators of each time slice. The TF inference was based on statistical enrichment of putative TF targets. More precisely, let G, called the foreground set, be the set of differentially expressed genes at a particular time point, and let T be the set of all genes in the dataset with binding sites for a given TRANSFAC matrix M. The set T is determined by choosing an appropriate sequence match cutoff for matrix M, and further filtering the genes with matches to M to include only those with a conserved binding site upstream of an orthologous mouse and chimp gene (as described above). The background set B, which serves to catalog the expected distribution of binding sites for M and dictate whether the observations in the foreground set G are unusual, is computed as described above (see microarray analysis). Next we find how many of the genes in the foreground and the background contain binding sites for matrix M. That defines subsets in the foreground and the background as intersections of G and B, respectively, with T. With Ng = |G|, Nb = |B|, Hg = |G ∩ T| and Hb = |B ∩ T|, we computed the hypergeometric p value HGP (Ng, Nb, Hg, Hb), which is the probability that, if binding sites for M were assigned randomly to genes in the foreground and the background, one might observe at least Hg binding sites in the foreground set.
| (EQUATION 2: Hypergeometric p value) |
At each time point we computed the p value for every TRANSFAC matrix mapped to a gene found to be differentially expressed somewhere in the time-course, and retain those passing an FDR-corrected threshold of 0.05 (22). To connect the individual TFs into a regulatory network, we placed each TF gene represented by one of the enriched matrices at the time it is first differentially expressed. An activity window was defined for every TF in the network. The temporal boundaries of the activity window of each TF were defined to include the earliest and latest times of differential expression and enrichment of associated matrices. Once the activity window has been identified, the transcription factor is linked to all genes with predicted binding sites whose up-regulation time falls within the window. Regulatory links appear explicitly in the network diagram when both the target and regulator appear as nodes in the network, and are implicit otherwise. Feed-forward links connect regulators to targets that are differentially expressed at later time points, while feedback links are predicted when the target is differentially expressed before the regulator.
Electromobility shift assay (EMSA)
Whole cell extracts were obtained from NDV-infected dendritic cells at 0,4,6 and 8 hours post infection, using NP-40 lysis buffer containing 50 mM Tris, 150 mM NaCl, 5 mM EDTA, 10% glycerol, 40 mM β-glycerophosphate, 1% NP-40, and 1mM phenylmethylsulfonyl fluoride. In the analysis of ISRE target sites the 0 and 4 hour time point where from the same experiment while 6 and 8 were not. In all other cases 0 and 6 hours were from the same experiment while 4 and 8 came from different infections. Cells were rinsed in PBS and allowed to lyse on ice for 30 min. Samples were then spun at 14K rpm for 10 min, and supernatant was collected. Protein concentrations were quantified using Bradford (Bio-Rad) as per the manufacturer's instructions. To begin the protein-DNA binding reaction, 10 μg of whole cell extracts were incubated in a total volume of 15 μL containing 50 mM HEPES pH 7.9, 10% Glycerol, 200 mM KCl, 5 mM EDTA pH 8.0, 1 mM MgCl2, 5 mM DTT, and 1 μg of poly (dI-dC). Samples were incubated on ice for 10 minutes, followed by the addition of 150, 000 CPU of 32P-labeled DNA probe and 20 minutes of incubation at room temperature. Oligonucleotide probes were ordered from Sigma, and annealed to their complementary oligonucleoides using annealing buffer containing 100 mM NaCl and 50 mM HEPES, pH 7.6. Probe sequences are shown in Table 2. The reaction was placed at 95°C and allowed to cool to room temperature. Annealed probes were end labeled with 32P using T4 polynucleotide kinase (NEB). Samples were electrophoresed at 180 Volts in 0.5% TBE buffer on an 8% native polyacrylamide gel composed of 49:1 acrylamide to bis-acrylamide. Gels were dried on Whatman paper at 80°C for 1 hour and exposed by autoradiogram.
TABLE II. Probe sequences used in EMSA experiments.
| Gene Symbol | Specific TRANSFAC matrix | TF / target site | Probe sequence (5′ – 3′) |
|---|---|---|---|
| ISG15 (control)* | ISRE | GATCGGAAAGGGAAACCGAAACTGAAGCC | |
| ALX1* | V$IRF7_01 | IRF7 | AGTTCTAATGAATATGAAAATAGGCGGGCG |
| PLA1A* | V$CART1_01 | ALX1 | GAGGCTAGTTAATGATTAGTGAAATCCACG |
| IFNA5 | V$CART1_01 | ALX1 | ATTAAAATTTAATGGGATTTTTAGTTAGAA |
| IFNA7 | V$CART1_01 | ALX1 | TGAACATACTAATTTCCATTTTCTAAATGC |
| FOXC1 | V$STAT1_01 | STAT1 | GGGCTCCGCTGCCCGGAAAAAAGTGTAACT |
| IFNA14* | V$FREAC3_01 | FOXC1 | GTGCATAGGTCTTAAATAAGGAACATAC |
| CREM | V$FREAC3_01 | FOXC1 | CAAATGGCTCAGCAAATAAAAATGTTAA |
| CXCL9 | V$FREAC3_01 | FOXC1 | GAAATGAATATCCTAAATAAATATGATCCC |
| PELI1 | V$FREAC3_01 | FOXC1 | CCTTATTAAACTGCAAATAAAATGCTGTGA |
| RUNX3 | V$CREB_Q4_01 | CREM | CACCTGGGCCGTGATGTCACGGCCTTTTA |
| RUNX3* | V$AML_Q6 | RUNX3 | CACCTGGGCCGTGATGTCACGGCCTTTTA |
| CCL3 | V$AML_Q6 | RUNX3 | TATCCTGAGCCCCTGTGGTCACCAGGGACC |
Validated by EMSA
Results
In order to define the transcriptional regulatory network underlying an uninhibited antiviral response, we performed genome-wide transcriptional profiling of human monocyte-derived DCs infected with NDV. Differentiated DCs from two human donors, each at two different instances, were infected in vitro with NDV and microarray analysis was performed over the first 18 hours post-infection.
1. Timing of gene expression is highly conserved
To determine the degree of variability present during the initial phases of the anti-NDV response, we compared the timing of gene expression changes between individuals and across experiments. The initial up-regulation time for each gene was estimated by fitting a logistic function to the mRNA expression time-series (see Figure 1 and Methods). The logistic function is a commonly used model for transcriptional regulation and visual inspection of the data suggested this was appropriate for many of the genes known to participate in the antiviral response (e.g., IFNB1, see Figure 1). This model-based approach allowed us to estimate the up-regulation time at a finer resolution than the microarray sampling. Another advantage is that the estimate is less sensitive to variation in individual expression values since the entire time-course is fit by the model. Focusing on a representative set of genes known to participate in pathogen responses (29). We identified 94 up-regulated genes that displayed expression patterns with an acceptable fit to the logistic function. These were used to measure the degree of conservation in the anti-NDV response. The selected genes spanned a wide range of up-regulation times, although none were found to be up-regulated at later time-points (after 12 hours post-infection, see Figure 2), indicating either the relatively early initiation of the response or the difficulty of fitting expression profiles that do not reach saturation.
Figure 2. The anti-NDV response is highly correlated across samples and donors.
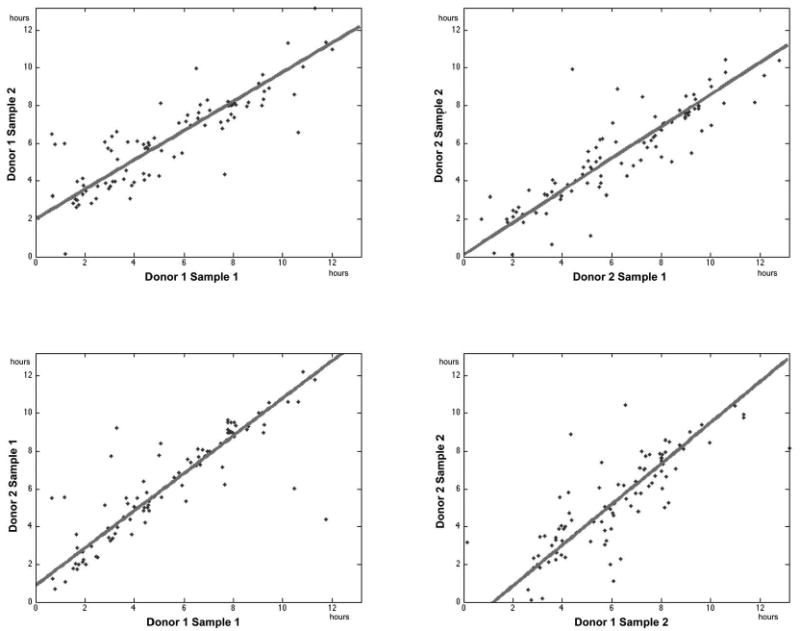
The initial up-regulation times were estimated for a set of genes known to be involved in pathogen responses using a model-based analysis. Up-regulation times for individual genes (points) were compared across samples from the same donor (upper row) and between donors for the same sample (bottom row). The extent of conservation was determined using orthogonal least-squares linear regression (solid lines). The correlation for each comparison was, starting at the top left corner and moving clockwise: 0.85, 0.88, 0.81 and 0.87.
To quantify the overall conservation of the regulatory progression between samples and subjects, we assessed the relative degree of similarity in the up-regulation times of the selected pathogen response genes. As can be readily seen in Figure 2, the estimated up-regulation times were very highly correlated both between donors and across samples, resulting in correlation coefficients ranging between 0.8 and 0.9. This indicated that the initial steps of the antiviral response are ordered in a highly conserved progression of gene expression. Such a high degree of conservation in the time progression, as our results indicated, is most likely the result of a tightly controlled set of regulatory mechanisms that operate as the system progresses through time. Surprisingly, the variance in up-regulation times appeared relatively constant over time (Figure 2), suggesting the existence of feedback mechanisms to dampen any noise that might accumulate as the signal propagates through the network (30, 31). To identify the regulatory cascade underlying this tightly controlled system, we first focused on the events occurring at distinct time-points and then connected this information across time into a coherent higher-level transcriptional network. We focused specifically on up-regulated genes since down-regulation times were not correlated across donors or samples (Supplementary Figure 1).
2. Multi-factor cascading control of the antiviral genetic program
In this section we implemented our time-centric view by identifying and analyzing sets of genes, that were first up-regulated at each time point (i.e., 1, 2, 4, 6, 8, 10, 12, 14, 16 and 18 hours post-infection, see Figure 3A). This approach contrasts with the more standard analyses that first cluster genes across a set of experiments and then analyze these refined subsets for functional enrichment, transcription factor activity, etc. (16, 32, 33) It also differs from the straightforward approach of treating each time-point independently, since the entire time-series is used to determine the point of initial up-regulation.
Figure 3. Dynamic activity profiles and target overlap for transcription factors in the NDV response network.
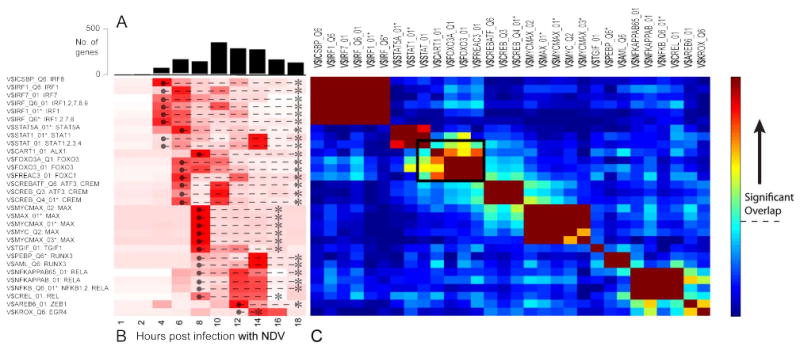
(A) The number of genes first up-regulated at each time point, split by TF (white bar) and non-TF (black bar) genes. (B) Heatmap showing the over-representation of targets associated with each of the TRANSFAC matrices in the network (rows) over time (columns). The colors are row normalized -log(P values). Darker red indicates greater inferred activity of the transcription factor(s). The temporal activity window of each TF matrix (● --- *) was inferred from the union of the activity of all the individual TFs represented by that matrix. (C) Heatmap quantifying the extent of overlap between predicted targets of each TRANSFAC matrix (rows and columns). Colors indicate -log(P values) of the hypergeometric test. The threshold for statistical significance assuming a Bonferroni-corrected P value of 0.05 is indicated by the dashed line on the color bar. Matrices that could be individually removed without any loss of coverage are marked with an asterisk (*). The black box indicates a region of high overlap between TFs from different families, suggesting possible cooperativity.
2a. Transcriptional regulators
The activation of the anti-viral response is complex and involves many viral and cellular determinants. Due to the high level of correlation we found between samples and the careful temporal progression it implied, we analyzed the underlying regulatory controls in a temporal succession. Starting from the 1351 up-regulated genes, we considered sets of genes that were first differentially-expressed at each time-point separately, and attempted to infer the transcription factors involved in regulating them. Transcriptional regulators for each time-slice were identified by testing for statistical enrichment of their putative targets (as described in Methods). That is, if among the set of up-regulated genes an unusually high number contain binding sites for a particular TF, that factor is likely involved in regulating the genes under consideration. Statistical significance was assessed using the hypergeometric distribution to measure the degree to which a given regulator's set of targets is over-represented in the sample of genes under consideration compared with a representative background set.
Using information from the TRANSFAC database (27), we identified 80 transcription factor binding matrices (motifs) annotated to human TF genes that were up-regulated during at least one point in our microarray time-series. We restricted the TRANSFAC database in this way because we were only interested in those transcription factors most likely to participate in the regulatory program as conduits of the transcriptional signals (16, 32, 33), implying differential-expression at the mRNA level. While it would be conceptually simple to extend the analysis to all TFs included in TRANSFAC, computing the p value for all TRANSFAC matrices would also greatly reduce statistical power as a result of the multiple hypothesis correction. For each of these 80 matrices, we determined the set of putative target genes by scanning the promoter regions, and requiring that potential binding sites be conserved in chimp and mouse (see Methods). This kind of phylogenetic footprinting has been shown to decrease the number of false positive binding sites (34).
Our enrichment analysis found a total of 30 matrices whose targets were significantly over-represented during at least one time-point (FDR q < 0.05). We generated a temporal enrichment profile for each of these matrices by identifying the different time points during which their targets were over-represented. As seen in Figure 3B, the activity of most of the matrices, and by implication the TFs they represent, spans several hours. Moreover, we observed multiple temporal phases in the response, each driven by distinct groups of transcription factors. In agreement with many previous studies of the innate antiviral response (6), IRF-based activation was evident in the initial wave of transcriptional up-regulation. In our analysis, this initial wave begins 4 hours post-infection, somewhat later than expected. This is likely because genes are assigned to time-points somewhat later than their actual up-regulation due to the stringent differential-expression criteria used here. Similarly, STAT activity was apparent by 4-6 hours post infection, and peaked at 14 hours post-infection. The middle phase of the response was driven by a variety of TFs, many of which have not been previously implicated in antiviral responses (see section 3a). Overall, the inferred enrichment profiles strongly suggested a cascade of TFs that drive different temporal phases of the response (Figure 3B).
2b. Distributed overlap and redundancy of transcription target genes
Having determined the individual regulators of the response, we focused on their target genes to determine the extent of cooperative regulation and redundancy. It is quite clear that there is a great amount of redundancy between the targets of the different matrices. Of the 30 TRANSFAC matrices implicated, none has more than ∼10% unique targets (and many have less). Moreover, most individual genes are targeted by more than one matrix. This can arise when a single TRANSFAC matrix is associated with multiple genes (e.g., the association of V$IRF_Q6 with several IRFs), or when the TFs are members of a complex that is represented by multiple matrices (e.g., NFKB1, NFKB2, REL and RELA). In other cases, a high overlap of target genes could indicate cooperative regulation. To identify these potential interactions, we quantified the extent of overlap in the target gene sets for all of the TRANSFAC matrices implicated in the anti-NDV response (Figure 3C). As expected, the most significant overlap of target genes occurred for matrices that describe members of the same TF family or complex. These are readily apparent in the dark blocks along the diagonal in Figure 3C. However, in a few cases, significant overlap was observed between different TF families. The most striking example involves the matrices encoding the STATs, ALX1, FOXO3 and FOXC1, whose targets overlap ∼30% on average (Figure 3C, black box). Within this group of core TFs, the highest pair-wise overlap of target genes occurs for ALX1 and FOXO3, and we hypothesize that these two TFs may be part of a single cis-regulatory module. In general, we predicted that most genes would be regulated by multiple TFs, with only 150 genes containing binding sites corresponding to a single matrix.
3. Causal linkage generates unified regulatory cascade
We sought to generate a transcriptional regulatory network that could connect the transcription factors associated with each phase of the response into a coherent linked cascade. This kind of representation required us to shift our focus from TRANSFAC matrices, which can each be annotated to multiple TFs, to a framework that considers individual TF activity over time.
3a. The DC antiviral transcriptional network
We generated an initial set of network links by identifying all pairs of TFs in which one was a putative regulator of the other. In order to reduce the potential for false positive regulatory relationships, we limited the time frame during which a TF could be implicated as having an important role in regulating a potential target. This was accomplished by defining an activity window for each TF (see Methods). We removed all network links where the initial up-regulation of the target gene occurred outside the activity window of the regulator. This pruning removed 37 links producing a final network that consisted of 24 TFs and 133 regulatory links. To visualize the resulting network (Figure 4), each TF was placed at the time its mRNA was first up-regulated in the response. We also considered the placement of TFs based on their activity, but ruled this out for two main reasons. First, many of the TRANSFAC matrices were enriched at multiple time points making the choice of placement somewhat arbitrary. Second, this scheme does not allow for differentiation between TFs that are annotated to the same TRANSFAC matrix. Placing genes at the time of their first differential expression provides TF-specific information and, in combination with the activity heatmap (Figure 3B), leads to a clearer view of the temporal progression of the network. This placement scheme is also consistent with our view of the biological process as a step-wise cascade where the up-regulation of the TF is tied to its activity. To provide additional resolution, genes appearing within the same time-slice were ordered based on the up-regulation time estimated by our model-based analysis (Section 1). To interpret the network visualization in Figure 4, it is helpful to keep in mind that links connect regulators to targets, and that arrow-tails indicate up-regulation of the regulator, while arrow-heads indicate activity of the regulator.
Figure 4. Transcription regulatory network for the uninhibited antiviral response.
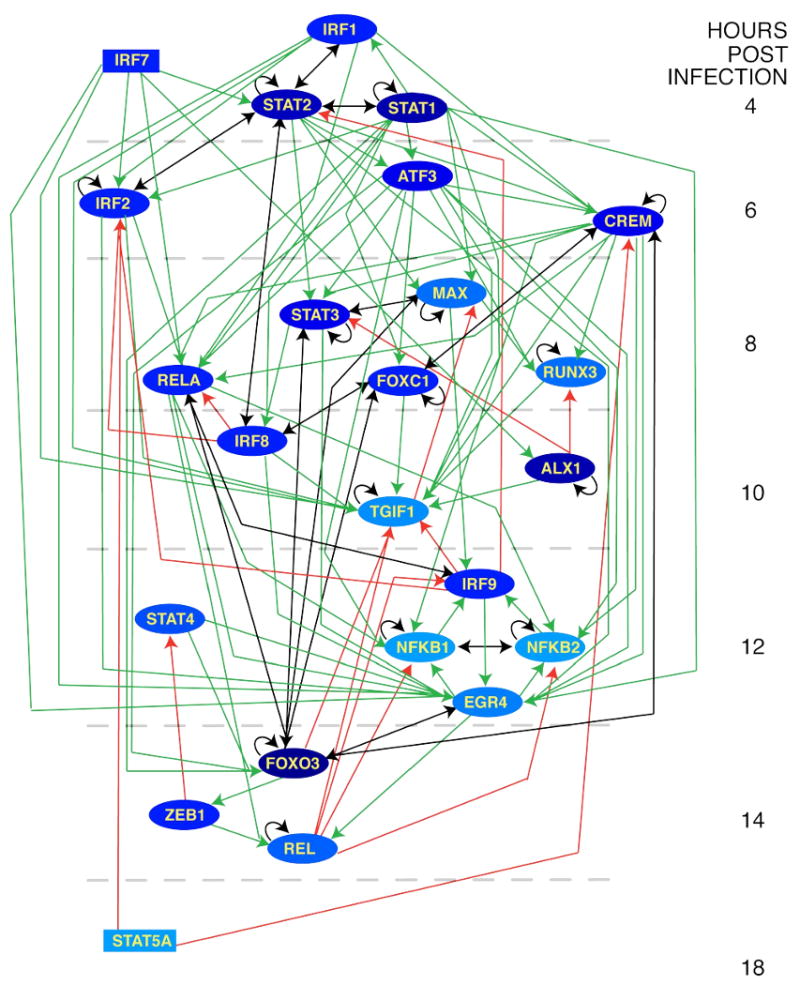
Each node represents a transcription factor with inferred activity in the anti-NDV response. Edges connect regulators to targets so that arrow-tails indicate up-regulation of the regulator, while arrow-heads indicate activity of the regulator on the target. Regulatory relationships can be either feed-forward (green links), feed-back (red links) or reciprocal (black links). Time in the figure progresses vertically down, with nodes placed in the time-slice during which the gene is first differentially expressed. Within each time-slice, TFs are ordered based on the sigmoid analysis wherever possible. Node color reflects importance measured by number of outgoing links to all gene targets (i.e., total number of genes, not just TF, targeted by the node in question), with darker color corresponding to more highly connected nodes. Rectangular nodes indicate TFs with no predicted regulators.
The resulting network of 24 TFs spans virtually the entire time-period analyzed. The TFs in this network are predicted to regulate 779 of 1351 (58%) up-regulated genes. As mentioned above, the transcriptional cascade we have discovered includes many TFs already associated with the interferon response (e.g., IRFs, STATs, NFkB) (6). It additionally includes ATF3 and TGIF1, which were previously implicated by other systems-biology analyses (16, 33). In all, 18 of 24 transcription factors implicated in the transcriptional cascade controlling the antiviral response appear in the known general pathogen response signature (29) or the core DC response signature (1) (Figure 5). Clearly, our approach is effective at capturing the known biology of the system.
Figure 5. Comparison of the anti-NDV transcriptional response with other pathogen responses.
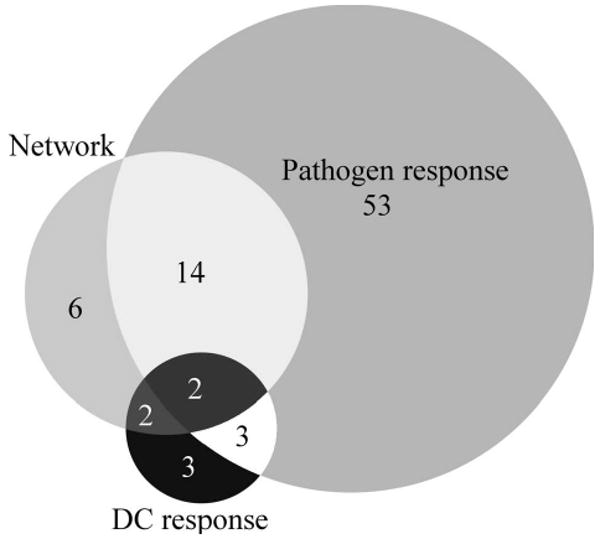
Transcription factors defined by the inferred network were compared with transcription factors from two published gene signatures: the general pathogen response defined in (29) and the core DC response defined in (1). Transcription factors in these signatures were identified by their annotation in (39) or linkage to a vertebrate TRANSFAC matrix (see Methods).
The network contains both feed-forward links, which propagate the transcriptional signal through time, as well as feed-back links, where TFs may influence the activity of targets that have previously been up-regulated (Figure 4). Feed-back links, while serving as potential conduits of regulatory activity, do not neatly fit into our idealized view of a regulatory cascade where up-regulation of TFs at the mRNA level drives the next wave of transcriptional changes. Thus, it is important to note that excluding these links only disconnects a single TF (STAT5A) from our network. We chose to visualize these links in order to present potentially important information on candidate feedback circuits. In order to understand whether the inferred network architecture was effective in capturing the underlying transcriptional cascade, we reasoned that true regulatory interactions would link genes that appeared close together in time. To test this hypothesis, we compared the average link length (i.e., the absolute difference in up-regulation time between the regulator and target) in the inferred network with that found in a set of random networks. To generate each random network, all up-regulated genes were randomly assigned an initial differential expression time, and transcription factors were randomly assigned an activity window from the set of observed profiles. Networks were inferred from these randomized data using the same method as the observed data, including the determination of enriched TRANSFAC matrices, etc. We found that the average link length in the real network (3.2 hours) was significantly shorter than those of the random networks (P<0.002 for 1000 random networks). A similar result was obtained when the link lengths were computed over all the target genes and not just the TFs appearing in Figure 4 (P< 0.005 for 1000 random networks). We conclude that our network is effective in capturing the underlying biology and produces a pattern that is consistent with a step-wise transcriptional signal propagation.
3b. Experimental validation of regulatory links
The network implicated six novel TFs in the antiviral response (Figure 5). We applied multiple criteria for selecting the most promising of these factors along with a set of their predicted regulators and targets for experimental validation by electromobility shift assay (EMSA). First, we looked for a robust up-regulation pattern in the TF mRNA expression, and focused particularly on those up-regulated in the middle phase of the response. Second, we eliminated TFs with non-specific binding signatures so that the true sites would be easier to identify (Table 1). Finally, we selected TFs with targets either in the constructed network or in the known pathogen response gene set, additionally selecting targets with very good matches to the TF's binding signature. To ensure the reliability of the EMSA validation we verified that such targets did not overlap with predicted binding sites for any other matrixes annotated to TFs associated with pathogen responses (1, 29) or appearing in our network. Our set of chosen TFs included ALX1, FOXC1 and RUNX3. Of these, ALX1 and FOXC1 were of particular interest, since they belonged to the group of transcription factors with evidence for a significant overlap among their target sets (see section 2b and Figure 3C). As a group, these TFs had at least one binding site in 70% of all the network targets, suggesting they are critical factors driving the observed up-regulation pattern. We sought to place these TFs in a functional context by performing a gene ontology (GO) analysis of their predicted target genes. FOXC1, RUNX3 and ALX1 targets share many of the same functions; however they have distinct profiles (Figure 6). The targets of RUNX3 include genes related to the T cell response, and the factor appears functionally similar to known players ATF3 and CREM. In contrast, ALX1 and FOXC1 both cluster together with several STATs, although FOXC1 targets more genes related to development.
TABLE I. Novel transcription factors predicted by the network analysis. Factors listed in bold were experimentally tested using EMSA.
| Gene Symbol | TRANSFAC matrix | TRANSFAC motif | First expressed (hours) |
|---|---|---|---|
| ALX1 | V$CART1_01 | 10 | |
| FOXC1 | V$FREAC3_01 | 8 | |
| FOXO3 | V$FOXO3_01* | 14 | |
| MAX | V$MYCMAX_02* | 8 | |
| RUNX3 | V$AML_Q6* | 8 | |
| ZEB1 | V$AREB6_01 | 14 |
Multiple TRANSFAC matrices are significant, only the one with the most significant P value is indicated
Figure 6. Gene ontology analysis of TF targets.
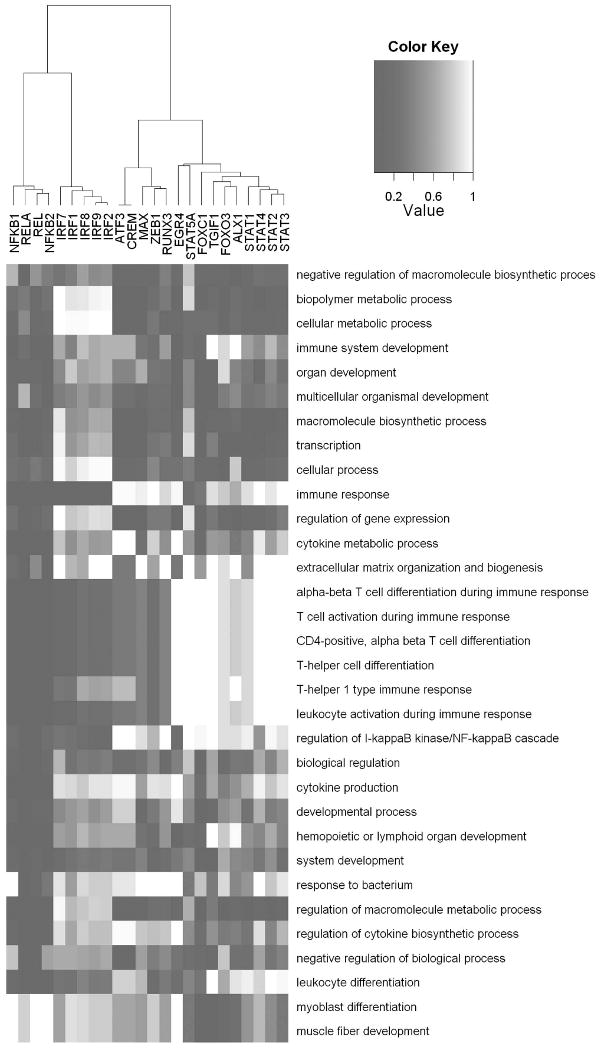
Each row corresponds to a GO term that was significantly enriched (p<0.001) for the targets of at least one transcription factor. The colors indicate absolute P values (darker for increased significance) computed using the conditional test in the GOstats package in Bioconductor. Hierarchical clustering of the columns was carried out using the Euclidean distance metric and Ward's linkage.
To validate the chosen target sites associated with our three novel TFs, we performed EMSAs with NDV-infected whole cell extract using 32P labeled oligonucleotides. EMSA probes were designed to include core target sites flanked with the endogenous genomic sequence. In comparing uninfected whole cell extract to extract derived from 4, 6, and 8 hours post-infection, we were able to verify four uncharacterized, virus inducible elements (Figure 7). TF binding assays using a characterized IRF7 element of ISG15, and a putative ISRE site upstream of the ALX1 transcription start site (TSS), both demonstrated virus inducible binding that was evident at 4 hours post-infection and was sustained for the duration of the sampling (Figure 7A and 7B). Furthermore, a putative ALX1 target element also demonstrated virus-inducible occupancy during infection (Figure 7C). This element upstream of the PLA1A gene mediated the assembly of a single DNA binding complex estimated to be 75-150kD. Moreover, binding of the ALX1 promoter element in PLA1A appeared to by dynamic, as a second faster migrating complex was visible by 8 hours post-infection, suggesting a time-dependent change in the composition of this complex (Figure 7C). Two additional non-ISRE binding sites were also verified by EMSA, including putative binding sites for FOXC1and RUNX3 (Figure 7D and 7E). Taken together, these data corroborate both microarray data and computational analyses, suggesting a complex transcriptional regulatory network that may depend on the cooperative activities of multiple TFs.
Figure 7. Experimental validation of transcription factor network connections.

Electromobility shift assays (EMSAs) were performed at 0, 4, 6 and 8 hours post-infection to test for virus-inducible binding at predicted binding sites. (A) Positive control demonstrating virus-inducible binding to an ISRE element in the promoter of ISG15. As validation of the TF network connections, virus-inducible binding was demonstrated for predicted binding sites of (B) IRF7, (C) ALX1, (D) FOXC1 and (E) RUNX3. The probe sequences (detailed in Table 2) encompass predicted binding sites found in the promoters of (B) ALX1, (C) PLA1A, (D) IFNA14 and (E) RUNX3 as specified in methods. TF-probe complexes are indicated with arrows.
Discussion
The activation of viral pattern sensors combined with cytokine signaling initiates a genetic program in DCs that is critical to controlling infection. We have found that the timing of this program is highly conserved. In order to deduce the underlying regulatory architecture, we developed an integrative method to reverse engineer the transcriptional network and its progression through time. Using genome-wide transcriptional profiling data covering the first 18 hours post-infection, our approach identified a single regulatory network composed of 24 transcription factors that accounts for the up-regulation of a majority of genes (Figure 4). This network captures and connects through time many known elements of the antiviral response, including IRFs, STATs and NFkB. The cascading pattern of TF activity (Figure 3B) and the interconnectedness of the network (Figure 4) combined with the tight conservation of target up-regulation times (Figure 2), all indicate an integrated control as opposed to an underlying parallel architecture. It is important to carefully interpret the network structure and ordering of events defined by the predicted regulatory network since the overall genetic program results from the integration of multiple signals that may arrive at different times. The NDV infection was performed using an MOI of 0.5 so that only approximately half the cells are infected and thus many cells are simply responding to the interferon and other cytokines secreted by infected cells, rather than directly to the virus. While this implies that the gene expression measurements reflect the operation of two distinct signaling pathways, the inferred network structure suggests that both rapidly converge on an overlapping set of downstream transcriptional regulators. Nevertheless, this could explain why NFkB activity follows STAT activity in our network. We conclude that the uninhibited antiviral response is the result of a single transcriptional cascade with a convergent architecture, and is not implemented as a series of independent transcriptional events.
Six transcription factors whose involvement in the network was predicted by our method are not part of the general pathogen response signature (29) or the DC core response (1). These represent potentially novel antiviral TFs: ALX1, FOXC1, FOXO3, MAX, RUNX3 and ZEB1. In order to validate the transcriptional network, we attempted to experimentally validate the regulatory connections for three of these novel transcription factors (ALX1, FOXC1 and RUNX3). We considered both incoming links, testing regulation of the novel TF, and outgoing links, testing the ability of the novel TF to regulate other genes. Using EMSA, we validated 4 out of the 12 regulatory relationships tested indicating an antiviral role for all of the TFs tested. Moreover, this success rate likely represents a lower bound for the specificity of our method in determining regulatory relationships for two main reasons. First, we did not include the many well-known players in our experimental validation. Second, a negative EMSA result may simply reflect sub-optimal binding conditions or be indicative of a relatively unstable complex. Furthermore, although the temporal activation of PLA1A, IFNA14 and RUNX3 does not necessarily correlate to the binding kinetics of ALX1, FOXC1 and RUNX3 putative binding sites respectively, this is likely a reflection of their individual transcriptional potentials or ability to recruit DNA modifying enzymes. In the case of the putative FOXC1 binding site, this element represents the first documented example of a non-IRF controlling the transcription of this genetic cluster. Although this site was found to overlap the TATA-box, it has also been observed that FOX proteins can regulate genes through direct binding to TATA-boxes (35). Further experiments will be needed to verify the true impact of this site and the cause for the FOXC1 binding site we have found.
ALX1 had the highest number of experimentally validated links. Based on the occupancy of the IRF7 upstream of the ALX1 TSS, it would appear that transcription is, in part, mediated directly by Type I interferon signaling (Figure 7B). In the network, ALX1 is predicted to cooperate with IRFs in the regulation of down-stream genes as part of a feed-forward loop (Figure 8). ALX1 encodes for CART1, a paired-class homeodomain protein that is necessary for survival of the forebrain mesenchyme in rodents (36). While the binding site preferences for CART1 have been characterized, (37) the function of this protein in humans is not known. Although the precise role for CART1 in the antiviral response is not yet clear, a gene ontology analysis of ALX1 predicted targets suggests that this factor is functionally similar to STAT1 and FOXO3 (Figure 6). ALX1 target genes are involved in a variety of functions, but the most enriched GO category predicts that this factor is most likely involved in the negative regulation of macromolecule biosynthetic processes (GO:0010558 – see Figure 6). Our network analysis places ALX1 within a well-known network motif (38), supporting a critical role for this transcription factor in coordinating the antiviral response (Figure 8). Our experimental results also appear to indicate the workings of such a feed forward control element of PLA1A by ALX1 and another virus activated transcription factor. Looking at our EMSA results we see that following the assembly of a single DNA binding complex at 4 hours, a second faster migrating complex was visible by 8 hours post-infection (Figure 7B). These results suggest the exciting possibility that ALX1, and other novel TFs identified in this study, may cooperate both with each other, or with known virus activated factors such as IRF3, IRF7, STAT1, and/or NFkB.
Figure 8. Network motif involving the putative antiviral transcription factor ALX1.
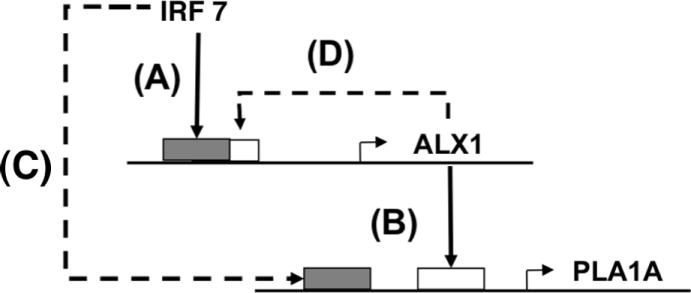
(A) The ALX1 gene is activated by IRF7. (B) ALX1 activates other genes such as PLA1A. The solid lines (A,B) represent EMSA-validated network connections. The dashed lines, completing a feed-forward loop (C) and indicating auto-regulation (D), were predicted computationally.
Combinatorial regulation can play an important role in mammalian gene regulation, but is not specifically incorporated in our approach. However, multiple regulators are predicted for most target genes and the potential for combinatorial control can be investigated indirectly by analysis of TF target overlap (Figure 3C). Consistent with our idea of cascading control, we found that most of the implicated TFs do not exhibit significant pair-wise overlap of target genes. However, a cluster of high overlap, including ALX1 (mentioned above) and also FOXO3, FOXC1 and STAT, was identified and may also reflect cooperative activity (black box, Figure 3C). Together these TFs account for approximately 70% of the genes controlled by the network. The cooperative nature of the network is further evidenced by the fact that only ∼19% of genes controlled by the network are targeted by a single matrix. Thus, while TFs pass along the ‘baton’ in an orderly fashion, individual genes may be controlled by multiple TFs at various points in the cascade and the network as a whole is the minimal unit of control.
The network building approach developed here is generally applicable to transcriptional profiling time-series. It differs from most current analyses in several important ways. First, we grouped genes according to their initial time of up-regulation. Second, instead of simply identifying the controlling TFs, we connected these together mechanistically to generate a complete transcriptional cascade. In cases where the time resolution of microarray sampling may not be sufficiently dense to isolate genes with common cis-regulatory logic, we suggest that the model-based analysis might be generalized to estimate up-regulation times on a finer scale. Several assumptions underlying our network reconstruction method are important to keep in mind. The analysis is limited to transcription factors whose binding preferences are known and are included in the TRANSFAC database. Nevertheless, as we have demonstrated, it is possible to implicate factors with previously unknown functions such as ALX1. Our method is also restricted to TFs that are differentially-expressed at the mRNA level. Consequently, it will miss factors that are post-transcriptionally regulated, which may be particularly important in the earliest stages of the response. Furthermore, since only up-regulated genes are included, the analysis will also not identify transcriptional repressors. While it is conceptually possible to extend the network reconstruction procedure to down-regulated genes, the lack of correlation among down-regulation times (Supplementary Figure 1) suggested that a transcriptional cascade may not be the best model for these data.
To study the highly dynamic processes involved in immune interaction with pathogens requires a methodology that incorporates time directly into the analysis rather than subsuming it. The method presented here is a first step in the construction of such a methodology. Using our time-centric promoter analysis methods we have elucidated the transcriptional network underlying an uninhibited antiviral response in human DCs. Our results indicate a robust convergent design and stepwise execution of the antiviral program. While inherently limited to discovering regulation by TFs whose binding preferences are known (and annotated in TRANSFAC), the inferred network nonetheless accounts for a majority of up-regulated genes and time points. The identification of key transcriptional players in the antiviral response, along with knowledge of their timing and regulatory architecture, provides a framework to identify the specific mechanisms used by human pathogens to subvert normal immune function.
Supplementary Material
The initial down/up-regulation times were estimated for the set of differentially-expressed genes in the NDV response using a model-based analysis. Down/up-regulation times for individual genes (points) are shown for the (A) 601 down-regulated and (B) 411 up-regulated genes whose expression profiles could be fit to a logistic function as described in Methods. The correlation across donors for sample 1 was (A) R = 0.28 for the down-regulated genes and (B) R = 0.79 for the up-regulated genes. Similar results were obtained from sample 2, and when considering sample-to-sample variability for the same donor (not shown).
Acknowledgments
Funding: This work was supported by NIH NIAID Contract No. HHSN266200500021C. JLD was supported in part by NIH Grant T15 LM07056 from the National Library of Medicine.
Abbreviations used
- DC
dendritic Cell
- EMSA
electromotility shift assay
- IFN
Interferon
- NDV
Newcastle disease virus
- TF
transcription factor
- TSS
transcription start site
Footnotes
Author contributions: EZ and UH designed the computational experiments and analyzed the data. JS and JGW performed the microarray experiments. AMP and BRtO performed the EMSA experiments. SM carried out the analysis of binding sites and JLD wrote the TF target identification program. SCS and SHK conceived the study. SHK designed the methods and helped analyze the data. All authors read and commented on the manuscript.
Conflicts of interest: none declared.
References
- 1.Huang Q, Liu D, Majewski P, Schulte L, Korn J, Young R, Lander E, Hacohen N. The plasticity of dendritic cell responses to pathogens and their components. Science. 2001;294:870–875. doi: 10.1126/science.294.5543.870. [DOI] [PubMed] [Google Scholar]
- 2.Bonjardim C, Ferreira P, Kroon E. Interferons: Signaling, antiviral and viral evasion. Immunology Letters. 2009;122:1–11. doi: 10.1016/j.imlet.2008.11.002. [DOI] [PMC free article] [PubMed] [Google Scholar]
- 3.Geiss GK, Carter VS, He Y, Kwieciszewski BK, Holzman T, Korth MJ, Lazaro CA, Fausto N, Bumgarner RE, Katze MG. Gene Expression Profiling of the Cellular Transcriptional Network Regulated by Alpha/Beta Interferon and Its Partial Attenuation by the Hepatitis C Virus Nonstructural 5A Protein. J Virol. 2003;77:6367–6375. doi: 10.1128/JVI.77.11.6367-6375.2003. [DOI] [PMC free article] [PubMed] [Google Scholar]
- 4.Mibayashi M, Martinez-Sobrido L, Loo Y, Cardenas W, Gale M, Jr, Garcia-Sastre A. Inhibition of retinoic acid-inducible gene I-mediated induction of beta interferon by the NS1 protein of influenza A virus. J Virol. 2007;81:514–524. doi: 10.1128/JVI.01265-06. [DOI] [PMC free article] [PubMed] [Google Scholar]
- 5.Zilliox M, Parmigiani G, Griffin D. Gene expression patterns in dendritic cells infected with measles virus compared with other pathogens. PNAS. 2006;103:3363–3368. doi: 10.1073/pnas.0511345103. [DOI] [PMC free article] [PubMed] [Google Scholar]
- 6.Haller O, Kochs G, Weber F. The interferon response circuit: Induction and suppression by pathogenic viruses. Virology. 2006;344:119–130. doi: 10.1016/j.virol.2005.09.024. [DOI] [PMC free article] [PubMed] [Google Scholar]
- 7.Park MS, Shaw ML, Munoz-Jordan J, Cros JF, Nakaya T, Bouvier N, Palese P, Garcia-Sastre A, Basler CF. Newcastle Disease Virus (NDV)-Based Assay Demonstrates Interferon-Antagonist Activity for the NDV V Protein and the Nipah Virus V, W, and C Proteins. J Virol. 2003;77:1501–1511. doi: 10.1128/JVI.77.2.1501-1511.2003. [DOI] [PMC free article] [PubMed] [Google Scholar]
- 8.Honda K, Sakaguchi S, Nakajima C, Watanabe A, Yanai H, Matsumoto M, Ohteki T, Kaisho T, Takaoka A, Akira S, Seya T, Taniguchi T. Selective contribution of IFN-α/β signaling to the maturation of dendritic cells induced by double-stranded RNA or viral infection. Proceedings of the National Academy of Sciences of the United States of America. 2003;100:10872–10877. doi: 10.1073/pnas.1934678100. [DOI] [PMC free article] [PubMed] [Google Scholar]
- 9.Martinez-Sobrido L, Gitiban N, Fernandez-Sesma A, Cros J, Mertz SE, Jewell NA, Hammond S, Flano E, Durbin RK, Garcia-Sastre A, Durbin JE. Protection against Respiratory Syncytial Virus by a Recombinant Newcastle Disease Virus Vector. J Virol. 2006;80:1130–1139. doi: 10.1128/JVI.80.3.1130-1139.2006. [DOI] [PMC free article] [PubMed] [Google Scholar]
- 10.Peng X, Chan EY, Li Y, Diamond DL, Korth MJ, Katze MG. Virus-host interactions: from systems biology to translational research. Current Opinion in Microbiology. 2009;12:432–438. doi: 10.1016/j.mib.2009.06.003. [DOI] [PMC free article] [PubMed] [Google Scholar]
- 11.Tan K, Tegner J, Ravasi T. Integrated approaches to uncovering transcription regulatory networks in mammalian cells. Genomics. 2008;91:219–231. doi: 10.1016/j.ygeno.2007.11.005. [DOI] [PubMed] [Google Scholar]
- 12.Segal E, Shapira M, Regev A, Pe'er D, Botstein D, Koller D, Friedman N. Module networks: identifying regulatory modules and their condition-specific regulators from gene expression data. Nature Genetics. 2003;34:166–176. doi: 10.1038/ng1165. [DOI] [PubMed] [Google Scholar]
- 13.Bar-Joseph Z, Gerber GK, Lee TI, Rinaldi NJ, Yoo JY, Robert F, Gordon DB, Fraenkel E, Jaakkola TS, Young RA, Gifford DK. Computational discovery of gene modules and regulatory networks. Nat Biotechnol. 2003;21:1337–1342. doi: 10.1038/nbt890. [DOI] [PubMed] [Google Scholar]
- 14.Ernst J, Vainas O, Harbison C, Simon I, Bar-Joseph Z. Reconstructing dynamic regulatory maps. Nature-EMBO Molecular Systems Biology. 2007;3:74. doi: 10.1038/msb4100115. [DOI] [PMC free article] [PubMed] [Google Scholar]
- 15.Nilsson R, Bajic VB, Suzuki H, di Bernardo D, Bjˆrkegren J, Katayama S, Reid JF, Sweet MJ, Gariboldi M, Carninci P, Hayashizaki Y, Hume DA, Tegner J, Ravasi T. Transcriptional network dynamics in macrophage activation. Genomics. 2006;88:133–142. doi: 10.1016/j.ygeno.2006.03.022. [DOI] [PubMed] [Google Scholar]
- 16.Gilchrist M, Thorsson V, Li B, Rust AG, Korb M, Kennedy K, Hai T, Bolouri H, Aderem A. Systems biology approaches identify ATF3 as a negative regulator of Toll-like receptor 4. Nature. 2006;441:173–178. doi: 10.1038/nature04768. [DOI] [PubMed] [Google Scholar]
- 17.Petrocca F, Lieberman J. Micromanagers of immune cell fate and function. Adv Immunol. 2009;102:227–244. doi: 10.1016/S0065-2776(09)01204-8. [DOI] [PubMed] [Google Scholar]
- 18.Sallusto F, Nicolo C, De Maria R, Corinti S, Testi R. Ceramide Inhibits Antigen Uptake and Presentation by Dendritic Cells. J Exp Med. 1996;184:2411–2416. doi: 10.1084/jem.184.6.2411. [DOI] [PMC free article] [PubMed] [Google Scholar]
- 19.Chang WLW, Baumgarth N, Yu D, Barry PA. Human Cytomegalovirus-Encoded Interleukin-10 Homolog Inhibits Maturation of Dendritic Cells and Alters Their Functionality. J Virol. 2004;78:8720–8731. doi: 10.1128/JVI.78.16.8720-8731.2004. [DOI] [PMC free article] [PubMed] [Google Scholar]
- 20.Park M, Garcia-Sastre A, Cros JF, Basler CF, Palese P. Newcastle disease virus V protein is a determinant of host range restriction. J Virol. 2003;77:9522–9532. doi: 10.1128/JVI.77.17.9522-9532.2003. [DOI] [PMC free article] [PubMed] [Google Scholar]
- 21.Fernandez N, Lozier A, Flament C, Ricciardi-Castagnoli P, Bellet D, et al. Dendritic cells directly trigger NK cell functions: Cross-talk relevant in innate anti-tumor immune responses in vivo. Nature Medicine. 1999;5:405–411. doi: 10.1038/7403. [DOI] [PubMed] [Google Scholar]
- 22.Benjamini Y, Hochberg Y. Controlling the False Discovery Rate: A Practical and Powerful Approach to Multiple Testing. Journal of the Royal Statistical Society Series B (Methodological) 1995;57:289–300. [Google Scholar]
- 23.Falcon S, Gentleman R. Using GOstats to test gene lists for GO term association. Bioinformatics. 2007;23:257–258. doi: 10.1093/bioinformatics/btl567. [DOI] [PubMed] [Google Scholar]
- 24.Pruitt K, Tatusova T, Maglott D. NCBI Reference Sequence (RefSeq): a curated non-redundant sequence database of genomes, transcripts and proteins. Nucleic Acids Res. 2005;33:D501–504. doi: 10.1093/nar/gki025. [DOI] [PMC free article] [PubMed] [Google Scholar]
- 25.Blanchette M, Kent WJ, Riemer C, Elnitski L, Smit AF, Roskin KM, Baertsch R, Rosenbloom K, Clawson H, Green ED, Haussler D, Miller W. Aligning multiple genomic sequences with the threaded blockset aligner. Genome Res. 2004;14:708–715. doi: 10.1101/gr.1933104. [DOI] [PMC free article] [PubMed] [Google Scholar]
- 26.Kel A, Gössling E, Reuter I, Cheremushkin E, Kel-Margoulis O, Wingender E. MATCH: A tool for searching transcription factor binding sites in DNA sequences. Nucleic Acids Res. 2003;31:3576–3579. doi: 10.1093/nar/gkg585. [DOI] [PMC free article] [PubMed] [Google Scholar]
- 27.Matys V, Fricke E, Geffers R, Gössling E, Haubrock M, Hehl R, Hornischer K, Karas D, Kel AE, Kel-Margoulis OV, Kloos DU, Land S, Lewicki-Potapov B, Michael H, Münch R, Reuter I, Rotert S, Saxel H, Scheer M, Thiele S, Wingender E. TRANSFAC: transcriptional regulation, from patterns to profiles. Nucleic Acids Res. 2003;31:374–378. doi: 10.1093/nar/gkg108. [DOI] [PMC free article] [PubMed] [Google Scholar]
- 28.Bruford EA, Lush MJ, Wright MW, Sneddon TP, Povey S, Birney E. The HGNC Database in 2008: a resource for the human genome. Nucl Acids Res. 2008;36:D445–448. doi: 10.1093/nar/gkm881. [DOI] [PMC free article] [PubMed] [Google Scholar]
- 29.Jenner R, Young R. Insights into host responses against pathogens from transcriptional profiling. Nat Rev Microbiol. 2005;3:281–294. doi: 10.1038/nrmicro1126. [DOI] [PubMed] [Google Scholar]
- 30.Dublanche Y, Michalodimitrakis K, Kummerer N, Foglierini M, Serrano L. Noise in transcription negative feedback loops: simulation and experimental analysis. Mol Syst Biol. 2006;2 doi: 10.1038/msb4100081. [DOI] [PMC free article] [PubMed] [Google Scholar]
- 31.Skotheim JM, Di Talia S, Siggia ED, Cross FR. Positive feedback of G1 cyclins ensures coherent cell cycle entry. Nature. 2008;454:291–296. doi: 10.1038/nature07118. [DOI] [PMC free article] [PubMed] [Google Scholar]
- 32.Ravasi T, Wells C, Hume D. Systems biology of transcription control in macrophages. BioEssays. 2007;29:1215–1226. doi: 10.1002/bies.20683. [DOI] [PubMed] [Google Scholar]
- 33.Ramsey SA, Klemm SL, Zak DE, Kennedy KA, Thorsson V, Li B, Gilchrist M, Gold ES, Johnson CD, Litvak V, Navarro G, Roach JC, Rosenberger CM, Rust AG, Yudkovsky N, Aderem A, Shmulevich I. Uncovering a Macrophage Transcriptional Program by Integrating Evidence from Motif Scanning and Expression Dynamics. PLoS Comput Biol. 2008;4:e1000021. doi: 10.1371/journal.pcbi.1000021. [DOI] [PMC free article] [PubMed] [Google Scholar]
- 34.Sauer T, Shelest E, Wingender E. Evaluating phylogenetic footprinting for human-rodent comparisons. Bioinformatics. 2006;22:430–437. doi: 10.1093/bioinformatics/bti819. [DOI] [PubMed] [Google Scholar]
- 35.Wierstra I, Alves J. FOXM1c transactivates the human c-myc promoter directly via the two TATA boxes P1 and P2. FEBS Journal. 2006;273:4645–4667. doi: 10.1111/j.1742-4658.2006.05468.x. [DOI] [PubMed] [Google Scholar]
- 36.Zhao Q, Behringer RR, de Crombrugghe B. Prenatal folic acid treatment suppresses acrania and meroanencephaly in mice mutant for the Cart1 homeobox gene. Nature Genetics. 1996;13:275–283. doi: 10.1038/ng0796-275. [DOI] [PubMed] [Google Scholar]
- 37.Cai RL. Human CART1, a paired-class homeodomain protein, activates transcription through palindromic binding sites. Biochem Biophys Res Commun. 1998;250:305–311. doi: 10.1006/bbrc.1998.9257. [DOI] [PubMed] [Google Scholar]
- 38.Milo R, Shen-Orr S, Itzkovitz S, Kashtan N, Chklovskii D, Alon U. Network Motifs: Simple Building Blocks of Complex Networks. Science. 2002;298:824–827. doi: 10.1126/science.298.5594.824. [DOI] [PubMed] [Google Scholar]
- 39.Roach JC, Smith KD, Strobe KL, Nissen SM, Haudenschild CD, Zhou D, Vasicek TJ, Held GA, Stolovitzky GA, Hood LE, Aderem A. Transcription factor expression in lipopolysaccharide-activated peripheral-blood-derived mononuclear cells. Proceedings of the National Academy of Sciences. 2007;104:16245–16250. doi: 10.1073/pnas.0707757104. [DOI] [PMC free article] [PubMed] [Google Scholar]
Associated Data
This section collects any data citations, data availability statements, or supplementary materials included in this article.
Supplementary Materials
The initial down/up-regulation times were estimated for the set of differentially-expressed genes in the NDV response using a model-based analysis. Down/up-regulation times for individual genes (points) are shown for the (A) 601 down-regulated and (B) 411 up-regulated genes whose expression profiles could be fit to a logistic function as described in Methods. The correlation across donors for sample 1 was (A) R = 0.28 for the down-regulated genes and (B) R = 0.79 for the up-regulated genes. Similar results were obtained from sample 2, and when considering sample-to-sample variability for the same donor (not shown).