

Abstract
Periodic cellwide depolarizations of mitochondrial membrane potential (ΨM) which are triggered by reactive oxygen species (ROS) and propagated by ROS-induced ROS release (RIRR) have been postulated to contribute to cardiac arrhythmogenesis and injury during ischemia/reperfusion. Two different modes of RIRR have been described: ΨM oscillations involving ROS-sensitive mitochondrial inner membrane anion channels (IMAC), and slow depolarization waves related to mitochondrial permeability transition pore (MPTP) opening. In this study, we developed a computational model of mitochondria exhibiting both IMAC-mediated RIRR and MPTP-mediated RIRR, diffusively coupled in a spatially extended network, to study the spatiotemporal dynamics of RIRR on ΨM. Our major findings are: 1), as the rate of ROS production increases, mitochondria can exhibit either oscillatory dynamics facilitated by IMAC opening, or bistable dynamics facilitated by MPTP opening; 2), in a diffusively-coupled mitochondrial network, the oscillatory dynamics of IMAC-mediated RIRR results in rapidly propagating (∼25 μm/s) cellwide ΨM oscillations, whereas the bistable dynamics of MPTP-mediated RIRR results in slow (0.1–2 μm/s) ΨM depolarization waves; and 3), the slow velocity of the MPTP-mediated depolarization wave is related to competition between ROS scavenging systems and ROS diffusion. Our observations provide mechanistic insights into the spatiotemporal dynamics underlying RIRR-induced ΨM oscillations and waves observed experimentally in cardiac myocytes.
Introduction
As the dominant source of ATP generation in cardiac myocytes, mitochondria are essential for normal cardiac function (1,2). An adult cardiac myocyte contains ∼7000 mitochondria, which are positioned along the myofibrils in a highly ordered network. Under normal conditions, mitochondria are polarized, with a membrane potential (ΨM) of ∼−180 mV maintained across the inner membrane by the respiratory chain. ΨM provides the driving force for proton influx through ATP synthase, which is coupled to ATP synthesis. When mitochondria depolarize (ΨM ∼ 0), however, ATP synthase reverses, consuming ATP to pump protons out of the matrix. It is well known that excessive levels of reactive oxygen species (ROS) can trigger ΨM depolarization. Fluorescence indicators used to measure ΨM, such as tetramethylrhodamine ethyl ester or tetramethylrhodamine methyl ester, generate ROS when illuminated by laser light, conveniently allowing the effects of ROS production on ΨM to be directly investigated (3). Using two-photon confocal excitation to illuminate a small area in a tetramethylrhodamine ethyl ester-loaded cardiac myocyte, Aon et al. (4,5) showed that locally generated ROS triggered cellwide ΨM oscillations and fast propagating waves, with a wave velocity estimated at 22 μm/s. Using similar methods, Brady et al. (6) also showed cellwide ΨM fluctuations and traveling waves; however, the wave velocity was <0.1 μm/s. In our own experiments using whole-cell illumination instead of localized photoactivation, we have observed both ΨM oscillations and slow waves, the latter wave velocities ranging from 0.1 to 2.2 μm/s (7) (and H. Honda, J. –H. Yang, and J. N. Weiss, unpublished data). Theories have been proposed to explain the underlying mechanisms of ΨM oscillations and waves, such as percolation theory (5,8), coupled oscillators (9), and excitable medium (7,10,11). However, a cohesive understanding of the spatiotemporal dynamics underlying these observations is lacking.
Mechanistically, evidence has been presented that cellwide ΨM oscillations and waves are caused by a positive feedback loop in ROS-induced ROS release (RIRR) (3–6,11–14). Under normal conditions, mitochondrial respiration is accompanied by low-level ROS production neutralized by powerful antioxidant systems. During metabolic stresses (e.g., ischemia and reperfusion), however, ROS levels can increase, which in turn can trigger additional ROS production and release from the mitochondria. Two different mechanisms of RIRR have been proposed: one is related to the inner membrane anion channel (IMAC) regulation (4,5,12), and the other to the mitochondrial permeability transition pore (MPTP) regulation (3,6,11,13,14).
Aon et al. (4) proposed IMAC-mediated RIRR to explain cellwide oscillations and waves observed in their experiments, from which Cortassa et al. (12) developed a mathematical model incorporating the sensitivity of IMAC to superoxide anion (O−2) in the intermembrane space into their previous model of mitochondrial energetics (15). That is, as matrix O−2 generated by electron transport complexes diffuses into the intermembrane space, IMAC open probability increases, creating a positive feedback loop releasing more O−2 into the intermembrane space. This positive feedback loop can cause limit cycle oscillations, providing a mechanistic explanation for the ΨM oscillations observed in their experiments. Brady et al. (6), on the other hand, found that the slow mitochondrial waves in their experiments were associated with matrix calcein release indicating MPTP opening, and were also inhibited by MPTP blockers such as cyclosporin A. They postulated that ΨM oscillations were mediated by MPTP-induced RIRR. No model has yet been presented for MPTP-mediated RIRR.
So far, no spatial model of either IMAC-mediated or MPTP-mediated RIRR has been developed to investigate how the mitochondrial network responds to these dynamical behaviors. Even if different RIRR mechanisms are involved, an interesting question is why the wave velocities are so different (two orders of magnitude), despite the same method of induction by laser illumination.
In this study, we first developed a single mitochondrion model of RIRR that includes both IMAC-mediated and MPTP-mediated RIRR. We then diffusively coupled individual mitochondria in a two-dimensional array of voxels, each containing the single mitochondrion model with appropriate matrix, intermembrane space, and cytoplasmic volumes. We show that, depending on the rate of ROS production, the single mitochondrion model can exhibit either limit-cycle ΨM oscillations due to the IMAC-mediated RIRR or bistability due to the MPTP-mediated RIRR. In the two-dimensional mitochondrial network, localized elevation of ROS production (analogous to localized laser-triggered ROS production) induces global ΨM oscillations due to rapid propagation of IMAC-mediated RIRR, whereas MPTP-mediated RIRR causes slow ΨM waves, consistent with both sets of experimental observations. We show that the self-amplifying nature of these RIRR processes results in a natural progression from cellwide ΨM oscillations to irreversible ΨM depolarization.
Mathematical Models
Single mitochondrion model incorporating both IMAC-mediated and MPTP-mediated RIRR
We developed a single mitochondrion model that incorporates both IMAC-mediated and MPTP-mediated RIRR (Fig. 1 A). Three compartments, the mitochondrial matrix, intermembrane space, and cytoplasm, are included. O−2 is produced in the matrix by Complexes I and III (16–19), and can only exit from the matrix into the intermembrane space through IMAC. (We ignored the minor component of O−2, which directly exits Complex III to the intermembrane space, as it had no qualitative effect on dynamics.) In the matrix, intermembrane space, and cytoplasm, O−2 is converted by superoxide dismutase (SOD) to H2O2 at rates VSOD,M, VSOD,I, and VSOD,C, respectively. H2O2 is allowed to diffuse freely between all three compartments, and in the matrix is degraded by peroxidases such as glutathione peroxidase, which in the process converts reducing cofactors (RED, such as GSH) to their oxidized forms (OX, such as GSSG) at a rate VRED. In the cytoplasm and intermembrane space, H2O2 is degraded directly (e.g., by catalase and peroxidases) at rates VD,I and VD,C, respectively. For simplicity, we omitted the RED/OX system in the intermembrane and cytoplasmic spaces, because it had no qualitative effects on dynamics.
Figure 1.
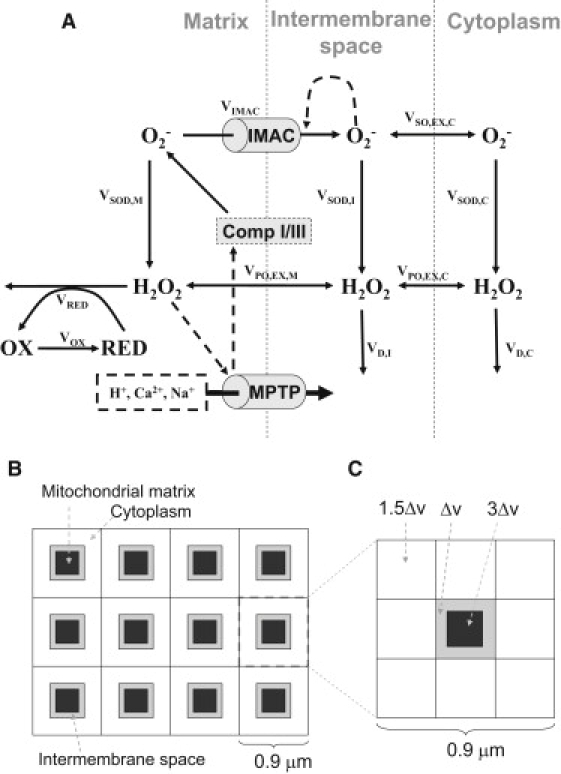
Schematic diagrams of ROS-induced ROS release models. (A) The single mitochondrion model including both IMAC- and MPTP-mediated pathways. (B) Schematic diagram of the spatial model of mitochondrial network. (C) For computational purposes, each unit is composed of 3 × 3 voxels representing a mitochondrion with its surrounding cytoplasm: the center voxel represents both the matrix (black) and the intermembrane space (gray), and the surrounding eight lattices are the neighboring cytoplasm. The relative volumes of each type of voxel are marked proportionately to the basic unit of volume Δv, corresponding to a volume ratio among matrix, intermembrane space, and cytoplasm of 3:1:12.
We modeled IMAC-mediated RIRR following Cortassa et al. (12). When O−2 production in the matrix increases to a critical level, its leakage through IMAC into the intermembrane space further activates IMAC, which releases more O−2 from the matrix, forming a positive feedback loop. As IMAC opening is progressively activated, ΨM becomes depolarized. However, as O−2 released into the intermembrane space and cytoplasm is converted by SOD to H2O2, IMAC deactivates, which allows electron transport to restore ΨM. This mechanism is consistent with the experimental finding that SOD mimetics prevented ΨM depolarization due to IMAC-mediated RIRR (4), but not MPTP-mediated RIRR (6,13).
We introduced MPTP-mediated RIRR into the model as follows. As proposed by Brady et al. (6,11), we assume that when H2O2 generated from O−2 accumulates sufficiently, a downstream product of H2O2, such as hydroxyl radicals or an oxidized lipid, activates MPTP opening. Because the specific downstream peroxide or oxidized lipid has not been identified, for simplicity we assume it to be proportional to H2O2 concentration. MPTP-mediated RIRR is then modeled as follows. When matrix H2O2 accumulates sufficiently (associated with RED depletion), MPTP opens, depolarizing ΨM. Consistent with experimental findings (20,21), we assume that when MPTP opening occurs, O−2 production by Complexes I/III transiently accelerates. This leads to more H2O2 production, which further activates MPTP in a positive feedback loop.
Our model has several differences from the model of Cortassa et al. (12). In our model, O−2 generation is an adjustable parameter, rather than a variable linked to energy metabolism, so that it can be flexibly manipulated to study dynamics. In addition, our model includes a formulation of MPTP regulation, which was not modeled by Cortassa et al. The differential equations and details of the mathematical models are presented in the Appendix.
Two-dimensional mitochondrial network model
We simulated a two-dimensional mitochondrial network consisting of 50 × 10 coupled voxels (Fig. 1 B), with each unit containing the three-compartment single mitochondria model described above. The spatial scale of a unit is 0.9 μm, and thus two-dimensional network size is 45 × 9 μm, representing ∼1/3 of a typical myocyte's area. Both O−2 and H2O2 diffuse freely between the intermembrane space and adjacent cytoplasmic space, as well as in the cytoplasmic space. To diffusively couple the network, we divided each unit into 3 × 3 voxels (Fig. 1 C), with the center voxel representing the volumes of matrix and the intermembrane space, and the surrounding eight voxels the volume of surrounding cytoplasm. The matrix, intermembrane, and cytoplasm compartments were fixed at a volume ratio of 3:1:12 (mitochondria accounts for ∼25% of the cellular space (22)). Note that in Fig. 1 C, the voxels are not drawn to scale. Further modeling and computational details are presented in the Appendix.
Numerical methods
The steady state and its stability of the single mitochondrion model were analyzed using MATLAB (The MathWorks, Natick, MA). The differential equations of the single mitochondrion model and the network model were numerically solved by Euler method with a time step 10−4 s.
Results
Temporal dynamics of the single mitochondrial model
In the single mitochondrion model, O−2 production rate (Vs) was set to VS = kshunt(1 + αMPTP), where kshunt represents O−2 production due to endogenous respiration modified by external factors such as laser scanning-induced O−2 production, and kshuntαMPTP is the additional component of O−2 production associated with MPTP opening. When kshunt is small (normal conditions), O−2 and H2O2 concentrations are low and the open probabilities of IMAC and MPTP are close to zero, and ΨM is accordingly well polarized and stable (Fig. 2). As kshunt increases, however, matrix O−2 progressively increases. When kshunt reaches > 0.025 mM/s, the leak of matrix O−2 through IMAC into the intermembrane space raises intermembrane space O−2 sufficiently to cause regenerative IMAC opening due to the positive feedback, releasing more O−2 from the matrix. Once O−2 released from the matrix is degraded by cytoplasmic SOD, IMAC deactivates, restoring ΨM until sufficient O−2 builds up in the matrix to begin a new cycle. When kshunt exceeds 0.105 mM/s, however, cytoplasmic SOD cannot effectively degrade cytoplasmic O−2 to a low enough level to deactivate IMAC. At this point, the steady state becomes stable again and oscillations cease, with ΨM remaining depolarized. The mechanism of limit-cycle oscillations due to IMAC-mediated RIRR is similar to that proposed by Cortassa et al. (12).
Figure 2.
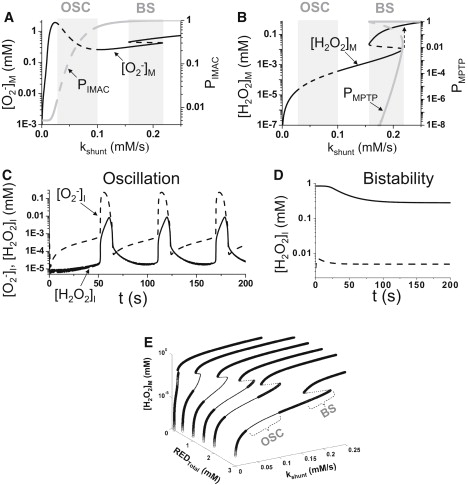
Dynamical behaviors of the single mitochondrion model. (A) Steady-state matrix superoxide concentration ([O−2]M, black line) and IMAC open probability (PIMAC, gray line) versus kshunt. Dashed segments are unstable steady states. (B) Steady-state matrix H2O2 concentration ([H2O2]M, gray line) and MPTP open probability (PMPTP, gray line) versus kshunt. Dashed segments are unstable steady states. Loss of stability of the steady state leads to oscillations (OSC zones in A and B) and bistability (BS zones in A and B). Dashed arrow indicates that as kshunt increases continuously, a sudden jump occurs in H2O2 concentration. (C) The intermembrane superoxide concentration ([O−2]I, dashed line) and intermembrane H2O2 concentration ([H2O2]I, solid line) versus time for kshunt = 0.08 mM/s, which is in the oscillatory regime. (D) The intermembrane H2O2 concentration in the bistable regime showing two stable steady states (solid and dashed lines) resulted from two initial conditions at kshunt = 0.2 mM/s. (E) Steady-state matrix H2O2 concentration ([H2O2]M) versus kshunt and REDTotal. The thick segments are the stable steady states. The thin segments are unstable steady states. “OSC” and “BS” mark the oscillatory and bistable regions, respectively.
With further increases in kshunt, MPTP-mediated RIRR comes into play. At a critical value (0.16 mM/s in Fig. 2, A and B), matrix O−2 elevates H2O2 (via SOD) to a level that triggers the MPTP opening, which, in turn, transiently further accelerates O−2 production by Complex I/III, forming another positive feedback loop causing bistability. In the bistable regime, the O−2 and H2O2 concentrations can either reside in a low stable state, with MPTP closed, or a high stable state with MPTP open (Fig. 2 B), depending on the initial conditions of the system. As shown in Fig. 2 D, when the initial H2O2 is low in the intermembrane space, MPTP are at the lower steady state (dashed line in Fig. 2 D). When the initial H2O2 was high, they transition to the higher steady state (solid line in Fig. 2 D). For kshunt > 0.22 mM/s, both O−2 and H2O2 increase as kshunt increases and MPTP open completely (Fig. 2, A and B). Thus, as kshunt gradually increases from a low number (e.g., 0.15 mM/s) to a high number (e.g., 0.25 mM/s), H2O2 jumps suddenly (dashed arrow in Fig. 2 B) to a very high level, and then increases further as kshunt increases due to the transient acceleration of O−2 production when MPTP opens. In Fig. 2 E, we show the steady states versus kshunt and the REDTotal (total GSH/GSSH) in a three-dimensional plot, showing that as REDTotal decreases, both the oscillatory and bistable regions shrink and eventually disappear, i.e., MPTP remains open at even very low kshunt values. This illustrates the critical importance of antioxidants.
We also studied how other parameters affect the oscillatory and bistable dynamics. Increasing the maximum O−2 release rate (kIMAC) from 0.5 s−1 to 5 s−1 narrowed the oscillatory regime from the kshunt interval [0.025, 0.1] to [0.025, 0.075], and the period of oscillation decreased from 35 s to 5 s. kIMAC had little effect on bistable behavior due to MPTP opening, however. The Hill coefficient and dissociation constant used in formulating the open probabilities of IMAC and MPTP also affect the ranges of oscillatory and bistable dynamics. For instance, when the Hill coefficient for the IMAC open probability function was reduced from 3 to 2, oscillations occurred over a much narrower kshunt interval, although the MPTP transition was not significantly affected. Similarly, when the MPTP open probability function was reduced from 10 to 2, bistability occurred over a much narrower kshunt interval, although IMAC-mediated RIRR was not significantly affected.
In summary, in this model, IMAC-mediated RIRR causes limit cycle oscillations, whereas MPTP-mediated RIRR results in bistability. As will be demonstrated below, these two dynamics result in different spatiotemporal dynamics in the mitochondrial network.
Spatiotemporal dynamics of the mitochondrial network model
To study how the dynamics of IMAC-mediated and MPTP-mediated RIRR affect the cellwide behavior of the mitochondrial network, we incorporated the single mitochondrion volume units into a two-dimensional array, coupled by diffusion of O−2 and H2O2 through the cytoplasmic space, as shown in Fig. 1, B and C. To mimic the localized laser scanning protocol used by Aon et al. (5) to induce IMAC-mediated RIRR, we increased kshunt in a small area of 7 × 7 units (cyan voxel in Fig. 3 C) in the center of the two-dimensional lattice (Fig. 3 C). Due to high kshunt in this area, O−2 accumulates to a high enough level to induce limit cycle oscillations as a result of IMAC-mediated RIRR. O−2 released from this area diffuses to neighboring regions, elevating intermembrane space O−2 sufficiently to induce IMAC opening in adjacent mitochondria. This results in a O−2 wave originating from the central area, which propagates outwardly (Fig. 3 A), triggering cellwide ΨM depolarization (Fig. 3 B). Subsequently, as matrix O−2 released into the intermembrane and cytoplasmic space is dismutated, IMAC shuts off and ΨM repolarizes. This process repeats itself, producing periodic cellwide ΨM oscillations (Fig. 3, C and D). For the parameter settings used in the two-dimensional model, the ΨM depolarization wave propagated at a speed of ∼25 μm/s, in agreement with experimental observations by Aon et al. (5). Since propagation is fast, mitochondria in the whole system appear to oscillate almost synchronously when imaged at frame speeds >1 s, as typical in experiments (Fig. 3, C and D).
Figure 3.
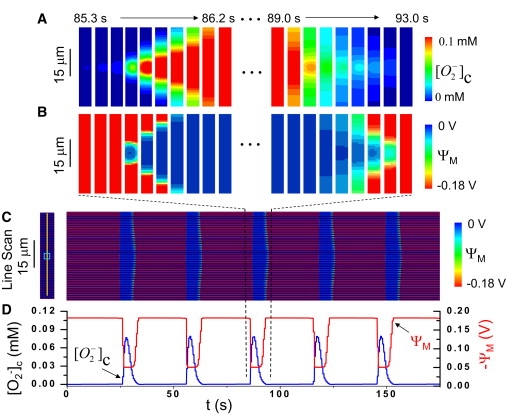
Cellwide ΨM oscillations due to fast waves of IMAC-mediated RIRR. (A–C) Periodic cellwide ΨM oscillations over a long timescale are shown in the line scan in panel C, with the scanned line and laser stimulated area as marked in the left panel. For one of these cellwide oscillations (between the dashed lines), panels A and B show snapshots of cytoplasmic O−2 and ΨM at uniform time intervals corresponding to the start (left panels) and end (right panels) of the oscillation. The mitochondrial depolarization starts from the laser stimulated area (cyan box in the left panel in C) and propagates to both ends of the whole cell. (D) The average ΨM and O−2 of the network versus time. In this simulation, kshunt was set to be 0.2 mM/s in the mitochondria in the center region (cyan box in the left panel in C) and 0.05 mM/s elsewhere.
To mimic the whole-cell laser-scanning protocol used by Brady et al. (6) to induce MPTP-mediated RIRR, we increased kshunt to 0.2 mM/s over the whole network, and set four rows of mitochondria at the bottom to an even higher value (0.35 mM/s), to reflect a degree of spatial heterogeneity in the network (i.e., a localized region responding to the same laser intensity with greater O−2 production). In this case, a ΨM depolarization wave originating from the left end (which is first to exceed the bistability threshold due to the higher kshunt value) propagates slowly through the network, with a wave velocity of 2.1 μm/s. The wave velocity depends strongly on the rate of H2O2 degradation or buffering determined by the parameters kRED, kD,I, and kD,C. As the values of these parameters increases, wave velocity slows due to enhanced H2O2 degradation, which is equivalent to reducing the excitability of the medium. For example, when kRED was increased from 3000 s−1 to 10,000 s−1, the velocity decreased from 7 μm/s to 2 μm/s (Fig. 4 B). This velocity can be further reduced if we also increase the H2O2 degradation rate in the intermembrane and cytoplasmic space, biologically corresponding to GSH/GSSH ratios, peroxidase, and catalase activities in these compartments. For example, by adding H2O2 degradation to the cytoplasm, we could reduce the wave velocity to 0.3 μm/s.
Figure 4.
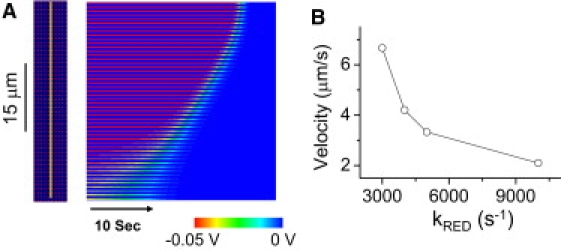
MPTP-mediated slow ΨM depolarization wave. (A) Space-time plot of ΨM recorded along the yellow line indicated on the left, after simulated laser stimulation of the whole area. The mitochondrial depolarization wave begins from the bottom and propagates slowly to the top, taking 24 s to propagate 50 μm. (B) The wave velocity versus kRED. kshunt was set to 0.35 mM/s in the bottom four rows of mitochondria and 0.2 mM/s elsewhere.
To simulate the effects of SOD mimetics, we increased kM,SOD from 0.01 mM/s to 1.0 mM/s. For parameters corresponding to IMAC-mediated waves in Fig. 3, the oscillations disappeared. For the parameters corresponding to slow MPTP-mediated waves in Fig. 4, however, the slow waves still occurred. This is consistent with the experimental finding that SOD mimetics prevented ΨM depolarization due to IMAC-mediated RIRR (4), but not MPTP-mediated RIRR (6,13).
Finally, we mimicked a scenario in which kshunt increases linearly as a function of time. This would correspond to a situation in which ongoing cycles of IMAC-mediated RIRR cause:
-
1.
Progressive depletion of antioxidant capacity (e.g., the GSH/GSSG ratio decreases); and
-
2.
Progressive damage to the distal electron transport chain and/or progressive release of matrix cytochrome c, such that O−2 production from reduced Complexes I/III progressively increases over time (23).
Fig. 5 shows that under these conditions, a series of ΨM oscillations due to IMAC-mediated RIRR culminates in sustained IMAC-mediated ΨM depolarization, followed later by a slow ΨM depolarization wave due to MPTP-mediated RIRR. Eventually, MPTP opening becomes irreversible after the final slow ΨM depolarization wave. Although we assumed, for simplicity, a linear increase of kshunt over time, a nonlinear pattern would produce the same qualitative results, altering only the time points at which bifurcations occurred.
Figure 5.
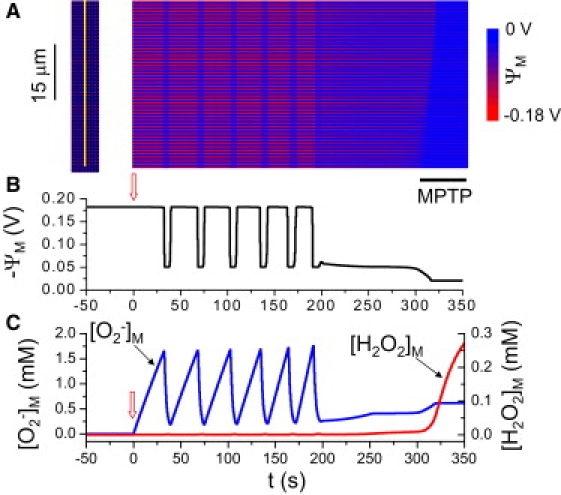
IMAC-mediated ΨM oscillations triggering an MPTP-mediated final depolarization wave. (A) Space-time plot of ΨM recorded along the yellow line indicated at the left. O−2 production rate increased progressively over time, most rapidly in the lower four rows of mitochondria (where kshunt = 0.35[0.3 + 0.7 min (1,e0.02t/150)]), and more slowly elsewhere (kshunt = 0.2[0.3 + 0.7 min (1,e0.02t/150)]). (B) Average ΨM versus time. (C) Mitochondrial O−2 (blue) and H2O2 (red) concentrations versus time. kshunt was initially zero and started to increase at the upward arrows. Black bar below the snapshot indicates the final MPTP-mediated slow wave.
Discussion
In this study, we developed a mitochondrial model exhibiting both IMAC-mediated and MPTP-mediated RIRR, and examined how the dynamics of these two RIRR mechanisms interact to produce ΨM oscillations and waves in a two-dimensional diffusively coupled mitochondrial network. In the single mitochondrion model, we find that IMAC-mediated RIRR generates limit-cycle dynamics, which in the network produces cellwide ΨM oscillations due to fast propagating ΨM depolarization waves. In contrast, MPTP-mediated RIRR causes bistable dynamics, which generates slowly propagating waves in the mitochondrial network, eventually leading to irreversible ΨM depolarization.
These findings recapitulate experimental observations in isolated myocytes subjected to laser-induced ROS. Consistent with the findings of Aon et al. (4,5) in which laser illumination of a small spot induced cellwide ΨM oscillations with a fast wave velocity at ∼22 μm/s, IMAC-mediated RIRR reproduces a comparable wave-conduction velocity due to the rapid diffusion of O−2 released from the matrix into the intermembrane space. Once released from the matrix, however, O−2 degradation in the intermembrane space and cytoplasm is much faster than its production. O−2 thus returns quickly to a level which causes IMAC to shut off until O−2 accumulates again in the matrix for the next cycle. This is the classical mechanism of positive feedback causing oscillations through substrate depletion (24). The wave is mediated by the diffusion of O−2 from one unit to the other to activate IMAC opening, forming a classic excitable medium.
MPTP-mediated RIRR, on the other hand, occurs in the model with an initially higher O−2 production rate, consistent with the larger region illuminated by the laser protocol used by Brady et al. (6). The resulting higher matrix O−2 production leads (via SOD) to higher matrix H2O2 levels and its downstream products, which triggers MPTP opening. MPTP opening transiently accelerates O−2 production from Complexes I/III (20,21), generating more H2O2 in a positive feedback cycle which results in bistability. The wave velocity for MPTP-mediated RIRR is much slower (0.1–2 μm/s). In excitable media, wave velocity is determined by diffusion rates and excitability, such that faster diffusion or greater excitability gives rise to faster wave velocity. As the diffusion constants of O−2 and H2O2 were set to be the same in our model, the differences in wave velocity are due to the differences in the excitability between the IMAC-mediated and MPTP-mediated RIRR processes. Fig. 4 B demonstrates that the H2O2 scavenging rate is a major factor lowering the excitability of MPTP-mediated RIRR, because increasing the H2O2 degradation rate reduces the velocity.
Consistent with the experimental findings of Aon et al. (4,5) that MPTP inhibitors such as cyclosporine A did not inhibit IMAC-mediated, cellwide synchronous ΨM oscillations, we found that preventing MPTP opening in the model also did not prevent IMAC-mediated ΨM oscillations. Similar to the model of Cortassa et al. (12), our model predicts that interventions which reduce O−2 production (kshunt) or increase O−2 scavenging (kRED) will suppress IMAC-mediated ΨM oscillations, as observed experimentally (12). Finally, Aon et al. (25) reported that the susceptibility of permeabilized myocytes to ΨM depolarization depended on the GSH/GSSH ratio, with a ratio of 150:1–100:1 favoring the IMAC-mediated ΨM depolarization, and a ratio of <50:1 favoring the MPTP-mediated ΨM depolarization. In our model, the GSH/GSSG ratio is represented phenomenologically as the RED/OX ratio, which ranged from 9:1 to 1.4:1 during IMAC-mediated ΨM oscillations, and <0.03:1 during MPTP-mediated ΨM depolarization, in qualitative agreement with these experimental results. Consistent with the findings of Brady et al. (6) that the SOD mimetic TMPyP blocked IMAC-mediated RIRR oscillations without preventing slow waves due to MPTP-mediated RIRR, we reproduced the same results by increasing the SOD activity in our model.
We previously reported that isolated myocytes exposed to anoxia-reoxygenation initially developed both fast reversible ΨM oscillations, followed subsequently by a slow ΨM depolarization wave (7). Like laser-induced injury, we speculated that the ROS burst upon reoxygenation set into motion progressively increasing ROS production, resulting from ROS-induced damage to electron transport complexes impeding electron flow through the distal respiratory chain. Under these conditions, redox centers in Complex I or III remain partially reduced and generate excessive O−2. As this excessive O−2 production persists, it consumes antioxidants and further impairs electron transport in adjacent mitochondria (by similarly damaging their electron transport chain), further increasing O−2 production until IMAC opening is triggered and IMAC-mediated RIRR propagates rapidly through the cell. During IMAC-mediated cellwide ROS oscillations, progressive ROS toxicity accumulates, further accelerating O−2 production and reducing antioxidant capacity until O−2 and H2O2 levels reach the threshold for MPTP activation, producing a final slow irreversible wave. As shown in Fig. 5, the features of our model, in which separate dynamical mechanisms account for IMAC-mediated and MPTP-mediated ΨM waves, predict this behavior when O−2 production rate kshunt is progressively increased over time. Because our model assumes that O−2 production due to MPTP opening is persistent, ΨM remains irreversibly depolarized at the end. However, the burst of O−2 production with MPTP opening may only be transient (20,21), due to loss of pyridine nucleotides with prolonged MPTP openings, resulting in oxidation of electron transport redox centers. Depending on the amplitude and duration of the transient O−2 burst that occurs with MPTP opening, as well as the value of kshunt, oscillatory behavior can result, such that slow ΨM depolarization waves from MPTP-mediated RIRR can be either reversible or irreversible. In addition, in our model, we only allowed the O−2 to exit the mitochondria through the IMAC, but it should be noted that O−2 can also exit through MPTP once it opens. This limitation does not affect the results shown in Figs. 4 and 5, as IMAC channels are always open before the MPTP opens. However, if MPTP opening is oscillatory, rather than bistable, the interactions between IMAC and MPTP oscillations could be affected by O−2 efflux through both channels.
In this study, we used a simplified model to study the oscillatory and wave dynamics of mitochondria depolarization, ignoring the detailed regulation of energy metabolism and other mechanisms of metabolic oscillations as shown in previous modeling studies (15,26–31). We assumed a constant O−2 production rate, whereas this rate is variable in real systems. However, because the dynamical bifurcations are set by reaching threshold concentrations of key ROS species, nonlinear O−2 production rates should affect the dynamics only quantitatively, and not qualitatively. Another limitation is that many of the details of the proposed regulatory mechanisms assumed in the model remain controversial or incompletely defined (e.g., sensitivity of IMAC channels to intermembrane space O−2, the identity of the precise ROS species activating MPTP opening, etc.). For example, alternative models of IMAC-mediated RIRR have been proposed (31). Nevertheless, our conclusions are not likely to be strictly model-dependent, as the dynamical behaviors observed here are generic properties of excitable and oscillatory media. Although the model can be improved as more detailed physiological information becomes available, it may be useful, even in its present form, for generating predictions that can be tested experimentally. For example, following upon the observation that rotenone suppressed the ROS burst upon MPTP opening (13), we would expect rotenone to delay irreversible MPTP-mediated ΨM depolarization. Another prediction arising from Fig. 5 is that under conditions in which fast IMAC-mediated RIRR waves precede slow MPTP-mediated RIRR waves, such as we previously reported in isolated myocytes exposed to anoxia-reoxygenation (7), mitochondrial ΨM should already be partially depolarized by open IMAC channels (in the range of −40 mV) before the onset of the slow wave in which ΨM becomes fully depolarized due to MPTP opening. It may be possible to adjust the concentrations of ΨM indicators such as tetramethylrhodamine methyl ester concentrations to detect these predicted differences.
Appendix
The single mitochondrion model
The differential equations
The differential equations for the single mitochondrion model shown in Fig. 1 A are as follows:
Matrix
| (1) |
Intermembrane space
| (2) |
Cytoplasm
| (3) |
where SO is the superoxide (O−2) concentration, PO the peroxide (H2O2) concentration, and RED the concentration of the reduced species. Subscripts M, I, and C represent matrix, intermembrane space, and cytoplasm. RI,M is the intermembrane space to matrix volume ratio and RI,C the intermembrane space/cytoplasm volume ratio. The volume ratios RI,M = 1/12 and RI,C = 1/3 were adopted from van Beek (32). The rate constants in Eqs. 1–3 are defined in Fig. 1 A and described in detail in the following sections.
O−2 production
Here we assume that the O−2 production rate VS depends on the external ROS stress (kshunt) and is accelerated by MPTP opening, i.e., VS = kshunt (1 + αMPTP), where αMPTP = aPMPTP. The value a is a constant and PMPTP is the MPTP open probability. According to Cortassa et al. (their Eq. 26 and Fig. A5) (15), the normal respiration rate is in the range of 0–10 mM/s. Because 1–2% of the daily oxygen consumption was estimated to mitochondrial O−2 production (33), a normal O−2 production rate of 0.05 mM/s, i.e., kshunt = 0.05 mM/s, is reasonable. During laser scanning, we assume that the O−2 generation rate increases to ∼10% of oxygen consumption, and therefore choose kshunt to be between 0 and 0.35 mM/s. This is the same kshunt range was used by Cortassa et al. (12) We assume that the MPTP opening is directly regulated by matrix H2O2 (because the exact ROS species derived from H2O2 is unknown). As there is no experimental data on exactly how MPTP opening is regulated, we set its open probability to be a Hill function of the matrix peroxide, i.e.,
where hMPTP is the Hill coefficient and KPO,MPT is the peroxide concentration at the half MPTP conductance.
O−2 release through IMAC
Cortassa et al. (12) formulated the IMAC channel conductance as a complex function of ΨM, based on experimental measurements from a 108-pS channel described by Borecký et al. (34). However, in the measurements of Borecký et al., the conductance of the channel is almost constant at the negative potentials and thus the current through the channel is ∝ΨM. As the mitochondrial potential ΨM is always negative, we use the simple formulation of the current-voltage relationship as
where kΨ,IMAC is maximum channel conductance and PIMAC is the open probability of IMAC. Following the hypothesis of Cortassa et al. (12) that the opening of the IMAC is induced by O−2 in the intermembrane space, we assume that the open probability of IMAC follows a Hill function of intermembrane O−2 concentration (a Michaelis-Menten formulation was used by Cortassa et al. (12)), i.e.,
where hIMAC is the Hill coefficient, and KSO,IMAC is the intermembrane superoxide concentration at the half-IMAC open probability. In addition, when ΨM suddenly dissipates (e.g., to almost zero in the model of Cortassa et al.) once the IMAC channel opens, and then repolarizes once the IMAC channel closes, the effects of ΨM on O−2 release through the IMAC are negligible. Thus, we assume that the superoxide release rate is proportional to the superoxide in the matrix, i.e.,
where kIMAC is the maximum subconductance of O−2. Although our formulations are simpler than the formulations of Cortassa et al., when we substituted ours by those of Cortassa et al., we obtained similar bifurcation diagrams to the diagrams shown in Fig. 2, i.e., as kshunt increased, we first observed the oscillatory dynamics due to the IMAC opening and then the bistable dynamics due to the MPTP opening.
O−2 dismutation
The dismutase rates (VSOD,M, VSOD,I, and VSOD,C) are assumed to be Hill functions of O−2, as they are catalyzed by the superoxide dismutase species (SOD), i.e.,
and
where kSOD,I, kSOD,C, and kSOD,M are maximum dismutation rates, and KSOM, KSOI, and KSOC are the Michaelis-Menten constants. Because SOD inside the matrix may differ from outside, we assume that KSOI and KSOC are the same, but different from KSOM. The maximum SOD production rates in the intermembrane space (kSOD,I) and cytoplasm (kSOD,C) are set at 0.1 mM/s, which are in the same range used by Cortassa et al. (their Fig. A4) (12). We used a smaller value for the matrix SOD rate, i.e., kSOD,M = 0.01 mM/s.
H2O2 degradation
The matrix H2O2 degradation rate is proportional to the matrix H2O2 concentration (POM), and is also regulated by the ratio of reduced/oxidized species,
where
and where REDTotal is the total reduced and oxidized species concentration which is set to be 3 mM according to Aon et al. (25). The OX can be converted back to RED with a rate
and kOX is a constant. The H2O2 degradation rate is set as
where kRED is constant and KREDOX is the Michaelis-Menten constant. H2O2 in the cytoplasm (POC) and in the intermembrane space (POI) are assumed to be degraded with fixed rates, i.e.,
and
where kD,I and kD,C are constants.
O−2 and H2O2 diffusion
O−2 diffuses freely between the intermembrane space and cytoplasm, so we simply set the diffusion rate as
where kSO,EX,C is a constant. H2O2 diffuses freely between different compartments and we set the diffusion rates as
and
where kPO,EX,M and kPO,EX,C are constants. Because the mitochondrial intermembrane space is close to the matrix, we assume that the exchange between intermembrane space and matrix is much faster than the exchange between intermembrane space and cytoplasm, i.e., kSO,EX,M = 10kSO,EX,C. Based on our own measurements (P. Korge and J. N. Weiss, unpublished data), we obtained an oxygen diffusion coefficient in water to be ∼1400 μm2/s. The diffusion coefficient of oxygen in blood was estimated to be 1200 μm2/s (35,36). In this study, we set the diffusion coefficients of O−2 and H2O2 to be D = 112.5 μm2/s, assuming that the complex cytoplasm environment causes a much slower diffusion. Using this diffusion rate, the rate constant is estimated as kSO,EX,C = 4D/Δx2 = 5000 s−1.
The spatial mitochondrial network model
The single mitochondrion model is used for each unit. The differential equations for the matrix in unit are
| (4) |
We add the mitochondrial membrane potential (ΨM) into the system, as described by the fourth expression in Eq.4. In this model, we simply use the ΨM production rate as VΨ, S = 3.5 V/s, and assume ΨM usage (including leak) rate to be VΨ, U = kΨ,U ΨM. The current-voltage relationship of IMAC is (see O−2 Release Through IMAC):
We also assume that MPTP conductance is proportional to its opening probability, and thus the current-voltage relationship is
The differential equations for O−2 and H2O2 in the intermembrane space (for any voxel in Fig. 1 B) are
| (5) |
where
and
are the fluxes between the intermembrane voxel and its four neighboring cytoplasmic voxels (see Fig. 1 C). The values k = D/Δx2 and D = 112.5 μm2/s constitute the diffusion constant and Δx = 0.3 μm. The value α = 2/3 is the volume ratio of the intermembrane voxel and the cytoplasmic voxel.
We assume that O−2 and H2O2 diffuse freely in the cytoplasmic space. The governing equations are
| (6) |
At the border between intermembrane space and cytoplasm (the border between the shaded voxel and the open voxel in Fig. 1 C), the boundary condition is
where
We use no-flux boundary condition for the whole domain, i.e.,
where Lx and Ly are the dimensions of the two-dimensional network.
Except for the parameters defined above, other parameters were arbitrarily adjusted to produce the dynamics in the model. All parameters are listed in Table 1.
Table 1.
Model parameters
| Symbols | Description | Value | Unit |
|---|---|---|---|
| kshunt | O−2 production rate constant. | 0–0.35 | mM/s |
| KPO,MPTP | H2O2 concentration at the half MPTP conductance. | 0.015 | mM |
| hMPTP | Hill coefficient of MPTP activation kinetics. | 10 | |
| kSOD,M | Maximum matrix SOD rate. | 0.01 | mM/s |
| kSOD,I | Maximum SOD rate constant in the intermembrane space. | 0.1 | mM/s |
| kSOD,C | Maximum SOD rate constant in the cytoplasm. | 0.1 | mM/s |
| KSOM | Michaelis-Menten constant of matrix SOD. | 0.02 | mM |
| KSOI | Michaelis-Menten constant of intermembrane space SOD. | 0.02 | mM |
| KSOC | Michaelis-Menten constant of cytoplasmic SOD. | 0.02 | mM |
| REDTotal | Total concentration of reduced/oxidized species in the matrix. | 3 | mM |
| kRED | Rate constant of H2O2 degradation in the matrix. | 10,000 | s−1 |
| KREDOX | Michaelis-Menten constant of H2O2 degradation in the matrix. | 50 | |
| kD,I | H2O2 degradation rate constant in the intermembrane space. | 0.05 | s−1 |
| kD,C | H2O2 degradation rate constant in the cytoplasm. | 0.05 | s−1 |
| kIMAC | Maximum IMAC O−2 conductance. | 0.5 | s−1 |
| hIMAC | Hill coefficient of IMAC activation kinetics. | 3 | |
| KSO,IMAC | O−2 concentration at the half-IMAC conductance. | 0.004 | mM |
| kSO,EX,C | O−2 diffusion rate between intermembrane space and cytoplasm. | 5000 | s−1 |
| KPO,EX,M | H2O2 diffusion rate between matrix and intermembrane space. | 50,000 | s−1 |
| KPO,EX,C | H2O2 diffusion rate between intermembrane space and cytoplasm. | 5000 | s−1 |
| kOX | Rate constant of oxidized species to reduced species. | 0.08 | s−1 |
| RI,C | Intermembrane space to cytoplasm volume ratio. | 1/12 | |
| RI,M | Intermembrane space/matrix volume ratio. | 1/3 | |
| a | O−2 production rate constant induced by MPTP. | 0.5 | |
| kΨ,U | Constant of membrane potential usage. | 19.2 | s−1 |
| kΨ,IMAC | Constant of membrane potential loss due to IMAC opening. | 50 | s−1 |
| kΨ,MPTP | Constant of membrane potential loss due to MPTP opening. | 100 | s−1 |
| D | Diffusion constant. | 112.5 | μm 2/s |
Acknowledgments
This study was supported by National Institutes of Health grant Nos. P01 HL080111 and R01 HL095663, National Science Foundation of China, (grant No. 10971152 to L.Y.), and by the Laubisch and Kawata endowments.
We thank Henry Honda and Jun-Hai Yang for helpful discussions.
References
- 1.Stanley W.C., Recchia F.A., Lopaschuk G.D. Myocardial substrate metabolism in the normal and failing heart. Physiol. Rev. 2005;85:1093–1129. doi: 10.1152/physrev.00006.2004. [DOI] [PubMed] [Google Scholar]
- 2.Saks V., Dzeja P., Wallimann T. Cardiac system bioenergetics: metabolic basis of the Frank-Starling law. J. Physiol. 2006;571:253–273. doi: 10.1113/jphysiol.2005.101444. [DOI] [PMC free article] [PubMed] [Google Scholar]
- 3.Hüser J., Blatter L.A. Fluctuations in mitochondrial membrane potential caused by repetitive gating of the permeability transition pore. Biochem. J. 1999;343:311–317. [PMC free article] [PubMed] [Google Scholar]
- 4.Aon M.A., Cortassa S., O'Rourke B. Synchronized whole cell oscillations in mitochondrial metabolism triggered by a local release of reactive oxygen species in cardiac myocytes. J. Biol. Chem. 2003;278:44735–44744. doi: 10.1074/jbc.M302673200. [DOI] [PubMed] [Google Scholar]
- 5.Aon M.A., Cortassa S., O'Rourke B. Percolation and criticality in a mitochondrial network. Proc. Natl. Acad. Sci. USA. 2004;101:4447–4452. doi: 10.1073/pnas.0307156101. [DOI] [PMC free article] [PubMed] [Google Scholar]
- 6.Brady N.R., Elmore S.P., Westerhoff H.V. Coordinated behavior of mitochondria in both space and time: a reactive oxygen species-activated wave of mitochondrial depolarization. Biophys. J. 2004;87:2022–2034. doi: 10.1529/biophysj.103.035097. [DOI] [PMC free article] [PubMed] [Google Scholar]
- 7.Honda H.M., Korge P., Weiss J.N. Mitochondria and ischemia/reperfusion injury. Ann. N. Y. Acad. Sci. 2005;1047:248–258. doi: 10.1196/annals.1341.022. [DOI] [PubMed] [Google Scholar]
- 8.Aon M.A., Cortassa S., O'Rourke B. Mitochondrial criticality: a new concept at the turning point of life or death. Biochim. Biophys. Acta. 2006;1762:232–240. doi: 10.1016/j.bbadis.2005.06.008. [DOI] [PMC free article] [PubMed] [Google Scholar]
- 9.Aon M.A., Cortassa S., O'Rourke B. The fundamental organization of cardiac mitochondria as a network of coupled oscillators. Biophys. J. 2006;91:4317–4327. doi: 10.1529/biophysj.106.087817. [DOI] [PMC free article] [PubMed] [Google Scholar]
- 10.Weiss J.N., Yang L., Qu Z. Systems biology approaches to metabolic and cardiovascular disorders: network perspectives of cardiovascular metabolism. J. Lipid Res. 2006;47:2355–2366. doi: 10.1194/jlr.R600023-JLR200. [DOI] [PubMed] [Google Scholar]
- 11.Brady N.R., Hamacher-Brady A., Gottlieb R.A. A wave of reactive oxygen species (ROS)-induced ROS release in a sea of excitable mitochondria. Antioxid. Redox Signal. 2006;8:1651–1665. doi: 10.1089/ars.2006.8.1651. [DOI] [PubMed] [Google Scholar]
- 12.Cortassa S., Aon M.A., O'Rourke B. A mitochondrial oscillator dependent on reactive oxygen species. Biophys. J. 2004;87:2060–2073. doi: 10.1529/biophysj.104.041749. [DOI] [PMC free article] [PubMed] [Google Scholar]
- 13.Zorov D.B., Filburn C.R., Sollott S.J. Reactive oxygen species (ROS)-induced ROS release: a new phenomenon accompanying induction of the mitochondrial permeability transition in cardiac myocytes. J. Exp. Med. 2000;192:1001–1014. doi: 10.1084/jem.192.7.1001. [DOI] [PMC free article] [PubMed] [Google Scholar]
- 14.Zorov D.B., Juhaszova M., Sollott S.J. Mitochondrial ROS-induced ROS release: an update and review. Biochim. Biophys. Acta. 2006;1757:509–517. doi: 10.1016/j.bbabio.2006.04.029. [DOI] [PubMed] [Google Scholar]
- 15.Cortassa S., Aon M.A., O'Rourke B. An integrated model of cardiac mitochondrial energy metabolism and calcium dynamics. Biophys. J. 2003;84:2734–2755. doi: 10.1016/S0006-3495(03)75079-6. [DOI] [PMC free article] [PubMed] [Google Scholar]
- 16.Turrens J.F., Alexandre A., Lehninger A.L. Ubisemiquinone is the electron donor for superoxide formation by complex III of heart mitochondria. Arch. Biochem. Biophys. 1985;237:408–414. doi: 10.1016/0003-9861(85)90293-0. [DOI] [PubMed] [Google Scholar]
- 17.Messner K.R., Imlay J.A. Mechanism of superoxide and hydrogen peroxide formation by fumarate reductase, succinate dehydrogenase, and aspartate oxidase. J. Biol. Chem. 2002;277:42563–42571. doi: 10.1074/jbc.M204958200. [DOI] [PubMed] [Google Scholar]
- 18.Yankovskaya V., Horsefield R., Iwata S. Architecture of succinate dehydrogenase and reactive oxygen species generation. Science. 2003;299:700–704. doi: 10.1126/science.1079605. [DOI] [PubMed] [Google Scholar]
- 19.Turrens J.F. Mitochondrial formation of reactive oxygen species. J. Physiol. 2003;552:335–344. doi: 10.1113/jphysiol.2003.049478. [DOI] [PMC free article] [PubMed] [Google Scholar]
- 20.Batandier C., Leverve X., Fontaine E. Opening of the mitochondrial permeability transition pore induces reactive oxygen species production at the level of the respiratory chain complex I. J. Biol. Chem. 2004;279:17197–17204. doi: 10.1074/jbc.M310329200. [DOI] [PubMed] [Google Scholar]
- 21.Wang W., Fang H., Cheng H. Superoxide flashes in single mitochondria. Cell. 2008;134:279–290. doi: 10.1016/j.cell.2008.06.017. [DOI] [PMC free article] [PubMed] [Google Scholar]
- 22.Bers D.M. Kluwer Academic; Dordrecht, The Netherlands: 2001. Excitation-Contraction Coupling and Cardiac Contractile Force. [Google Scholar]
- 23.Chen Q., Moghaddas S., Lesnefsky E.J. Ischemic defects in the electron transport chain increase the production of reactive oxygen species from isolated rat heart mitochondria. Am. J. Physiol. Cell Physiol. 2008;294:C460–C466. doi: 10.1152/ajpcell.00211.2007. [DOI] [PubMed] [Google Scholar]
- 24.Tyson J.J., Chen K.C., Novak B. Sniffers, buzzers, toggles and blinkers: dynamics of regulatory and signaling pathways in the cell. Curr. Opin. Cell Biol. 2003;15:221–231. doi: 10.1016/s0955-0674(03)00017-6. [DOI] [PubMed] [Google Scholar]
- 25.Aon M.A., Cortassa S., O'Rourke B. Sequential opening of mitochondrial ion channels as a function of glutathione redox thiol status. J. Biol. Chem. 2007;282:21889–21900. doi: 10.1074/jbc.M702841200. [DOI] [PMC free article] [PubMed] [Google Scholar]
- 26.Wu F., Yang F., Beard D.A. Computer modeling of mitochondrial tricarboxylic acid cycle, oxidative phosphorylation, metabolite transport, and electrophysiology. J. Biol. Chem. 2007;282:24525–24537. doi: 10.1074/jbc.M701024200. [DOI] [PubMed] [Google Scholar]
- 27.Dash R.K., Beard D.A. Analysis of cardiac mitochondrial Na+-Ca2+ exchanger kinetics with a biophysical model of mitochondrial Ca2+ handling suggests a 3:1 stoichiometry. J. Physiol. 2008;586:3267–3285. doi: 10.1113/jphysiol.2008.151977. [DOI] [PMC free article] [PubMed] [Google Scholar]
- 28.Yang J.H., Yang L., Weiss J.N. Glycolytic oscillations in isolated rabbit ventricular myocytes. J. Biol. Chem. 2008;283:36321–36327. doi: 10.1074/jbc.M804794200. [DOI] [PMC free article] [PubMed] [Google Scholar]
- 29.Zhou L., Salem J.E., Cabrera M.E. Mechanistic model of cardiac energy metabolism predicts localization of glycolysis to cytosolic subdomain during ischemia. Am. J. Physiol. Heart Circ. Physiol. 2005;288:H2400–H2411. doi: 10.1152/ajpheart.01030.2004. [DOI] [PubMed] [Google Scholar]
- 30.Zhou L., Cabrera M.E., Stanley W.C. Regulation of myocardial substrate metabolism during increased energy expenditure: insights from computational studies. Am. J. Physiol. Heart Circ. Physiol. 2006;291:H1036–H1046. doi: 10.1152/ajpheart.01382.2005. [DOI] [PubMed] [Google Scholar]
- 31.Saleet Jafri M., Kotulska M. Modeling the mechanism of metabolic oscillations in ischemic cardiac myocytes. J. Theor. Biol. 2006;242:801–817. doi: 10.1016/j.jtbi.2006.05.007. [DOI] [PubMed] [Google Scholar]
- 32.van Beek J.H.G.M. Adenine nucleotide-creatine-phosphate module in myocardial metabolic system explains fast phase of dynamic regulation of oxidative phosphorylation. Am. J. Physiol. Cell Physiol. 2007;293:C815–C829. doi: 10.1152/ajpcell.00355.2006. [DOI] [PubMed] [Google Scholar]
- 33.Cadenas E., Davies K.J. Mitochondrial free radical generation, oxidative stress, and aging. Free Radic. Biol. Med. 2000;29:222–230. doi: 10.1016/s0891-5849(00)00317-8. [DOI] [PubMed] [Google Scholar]
- 34.Borecký J., Jezek P., Siemen D. 108-pS channel in brown fat mitochondria might be identical to the inner membrane anion channel. J. Biol. Chem. 1997;272:19282–19289. [PubMed] [Google Scholar]
- 35.Wyman J. Facilitated diffusion and the possible role of myoglobin as a transport mechanism. J. Biol. Chem. 1966;241:115–121. [PubMed] [Google Scholar]
- 36.Keener J.P., Sneyd J. Springer; New York: 1998. Mathematical Physiology. [Google Scholar]