

Abstract
It is well known that proteins denature under high pressure. The mechanism that underlies such a process is still not clearly understood, however, giving way to controversial interpretations. Using molecular dynamics simulation on systems that may be regarded experimentally as limiting examples of the effect of high pressure on globular proteins, such as lysozyme and apomyoglobin, we have effectively reproduced such similarities and differences in behavior as are interpreted from experiment. From the analysis of such data, we explain the experimental evidence at hand through the effect of pressure on the change of water structure, and hence the weakening of the hydrophobic effect that is known to be the main driving force in protein folding.
Introduction
The hydrophobic interaction is of paramount importance for the stabilization of many biological components and plays a decisive role in the folding of proteins (1). The interpretation of this effect was based traditionally on the oil-in-water model (2). However, the model appears to fail under applied pressure, which produces protein denaturation (3). In this study, we show that there are no contradictions between the model and the results, at any pressure, and we clarify the actual driving mechanism of denaturation by pressure. The hydrophobic effect is an important case of what are usually referred to as entropic forces. It arises from the difference in density between the open order arrangement of water in the neighborhood of a nonpolar surface and the more disordered water structure in the bulk. The effect of pressure is to strongly modify the structure of water, bringing these two structures together. This decreases the entropic gain of minimizing the exposed nonpolar surfaces to the solvent, and eventually kills completely the hydrophobic interaction, with the consequent denaturation of the protein. We have been able to see this mechanism in action by the use of molecular dynamics (MD) simulation. Two hydrated proteins, apomyoglobin and lysozyme, were studied at different applied pressures. Our results show that there is a direct correlation between the denaturation of these proteins and the loss in hydrophobic interaction as direct consequence of the changes in water structure.
The modern concept of hydrophobic interaction was formulated by Kauzmann in 1959 (1). It constitutes the dominating interaction in the protein folding process. The proposed explanation of hydrophobic interaction, in terms of an increase in the entropy of the system due mainly to the contribution of water, was widely accepted shortly after its proposal, although the experimental demonstration arrived many years later (4–6). The presence of a nonpolar surface induces a rearrangement of water, favoring a low density tetrahedral structure. Association of nonpolar solutes reduces the surface exposed, changing the water structure into a more compact and less ordered state with a consequent increase in entropy that makes this association stable. A simple thermodynamic analysis of the effect of pressure says that the equilibrium constant of a process K is given by:
| (1) |
where ΔV is the volume change, R is the universal gas constant, T the temperature, and p the pressure.
According to Eq. 1, the application of pressure would favor a process that results in a decrease of the system volume (ΔV negative). This is precisely the case in hydrophobic interaction, where water in the neighborhood of the nonpolar surface shifts from a low to a high density state. This simple thermodynamic analysis leads us to the expectation that the hydrophobic interaction would be enhanced by pressure. Experience does not confirm this expectation: although the hydrophobic interaction is indeed enhanced by the application of moderate pressures, it is eventually weakened at higher pressures (3). This apparent paradox is resolved easily if we study in some detail the properties of water itself.
Water exhibits some peculiarities in its behavior that single it out from most liquids, the so-called anomalies (7). This peculiar behavior is due to its distinctive structure. Experiments show that at high pressure most of these unique characteristics are lost (8). Because most properties of water are due to the existence of a hydrogen bond network, the changes are interpreted as evidence of a change in the structure, moving from an open thetrahedrical structure to a compact hexagonal one. Water diffusion (9), neutron scattering (10), and small-angle x-ray diffraction (11) confirm this hypothesis.
Under pressure, the low density state of water becomes depleted. Thus, the hydration environment of nonpolar substances will be comprised mostly of high density water. As a consequence, the association of nonpolar particles, and the concomitant release of the nonpolar hydration shell back to the water bulk state, no longer offers a thermodynamic (entropic) gain and, therefore, will not be favored by high pressure.
Although the change in water structure from open thetrahedral coordination to a compact hexagonal one is accepted in general and qualitative terms, the actual pressure at which the transition from one structure to another becomes noticeable remains under discussion.
The behavior of water viscosity with pressure shows an initial decrease, reaching a minimum value <2 kbar, after which it shows a permanent increase, and from this point on, it shows a behavior much like that of a regular liquid (12). Trace diffusion results (9) show a change in slope from a decreasing to an increasing diffusion coefficient value. In this study, the change in behavior is visible ∼1.5 kbar.
More conclusive results are due to measurements of the self-diffusion coefficient using the pulsed gradient spin-echo technique by Prielmeier et al. (13). The main conclusion, referring to our point or interest, is that rotational diffusion is enhanced much more strongly by pressure than translational diffusion. This is explained by the fact that thetrahedrical structure constrains molecules in a well-defined orientational state, whereas under pressure the number of first neighbor's increases as the tetrahedrality is broken down. The effect is observed from 243 K to 363 K and appears <2 kbar.
Inelastic x-ray scattering studies of water (11) have found that “discernible pressure-dependent effects include a slight increase of the pre-edge intensity and the shifting of the main edge toward higher energy at 0.25 GPa” (11). These changes in the near-edge structure in liquid water have been interpreted as caused by an increase in uncorrelated hydrogen bonds in water induced by pressure.
The evidence mentioned above convinces us that the effect on water structure, and hence on hydrophobic effect, is present from 3 kbar.
As the very nature of the hydrophobic effect relays on the existence of an open tetrahedral structure, such crucial changes in the solvent structure under pressure alter the hydrophobic effect, becoming greatly weakened at high pressures. The hydrophobic effect plays a key role in the stability of proteins. It is therefore natural to consider that the conclusion stated above should be highly significant when considering the effect of pressure on the structure of proteins.
The thermodynamic analysis of the process of unfolding is usually done with the expressions given by Hawley (14), Smeller (15), and Wiedersich et al. (16). This approach, used to derive the expression for free energy of denaturation, assumes constant values of the partial derivatives of volume and entropy with temperature and pressure. However, not only do these values not remain constant, but their change is not linear. Moreover, water properties exhibit a drastic change when crossing the barrier of ∼2 kbar. Clearly, a complete and comprehensive thermodynamic description of protein denaturation under pressure is yet to be achieved.
Alternatively, methods that offer detailed information with atomistic resolution may offer a different perspective that can help to shed some light on the overall picture.
Simulation techniques such as Monte Carlo (17), replica exchange (18), and other mean field theoretical methods (19), although lacking in time correlation, have proven very valuable due to their enhanced sampling power, also contributing to evidence many molecular and energetic aspects still inaccessible to MD. Although computer power has increased enormously in the last decade, achieving the pressure-induced completely unfolded state of a globular protein, such as apomyoglobin, through classical MD remains out of reach.
Nevertheless, MD simulation has proven to be notably successful at accurately predicting experimental results that lay much outside the elapsed simulated time, besides describing the time correlated details regarding the onset of the cold denaturing process (20).
Methods
We carried out the MD simulations using the GROMACS 3.2.1 package (21–23). We used all-atoms force field (24,25) for the minimization process, as well as for all the MD simulation steps and kept all protein bond lengths constrained using the LINCS algorithm (26). Water molecules were constrained using the SETTLE algorithm (27). For the calculation of electrostatic forces we applied the reaction field method. Lennard-Jones interactions were calculated within a cut-off radius of 1.4 nm.
For all the simulation runs we have used a Xeon-based, dual-processor cluster, running under GNU/Linux and for all plots and graphics MS Windows or GNU/Linux, using the reference Visual MD package, Swiss PDB Viewer, or XGrace software.
As starting configurations for apomyoglobin we have used the high and low pressure crystal structures for sperm whale myoglobin (PDB codes 1JP8 and 1VXD, respectively) and generated the topology using the PDB2GMX tool, with standard pH 5.0 amino acid protonation states and removing all nonprotein residues.
The SPC/E (28) water model was used for both high and low pressure systems. This model has been extensively tested to carry out appropriately under a variety of conditions. Recently, particular attention has been drawn to its correct performance regarding the hydrophobic effect. Namely, it has been tested for the solvation of amino acids analogs (29), resulting the best of the water models tested for three different force fields, including the one used here. Additionally, it has been found to satisfactorily reproduce experimental behavior under high pressure conditions, as is shown in a recent systematic study on PVT properties, under a wide range of temperature and pressure conditions, showing remarkable agreement with the most recently published high-pressure experimental data, with errors <1.0% (30).
The starting system consisted of a cubic simulation box of X = 7.19617 nm, Y = 7.19617 nm, and Z = 7.19617nm, with a total volume of 372,653 nm3, containing one apomyoglobin molecule and 11,663 water molecules.
After equilibration at 1 kbar we carried out a 180 ns long MD simulation for both the 1 bar and 3 kbar systems. All of the analysis corresponds to the of these 180 ns long MD simulations. Pressure was controlled using the Berendsen thermostat (31).
The root mean-square deviation (RMSD) reference structures and normalization method were produced as follows. On equilibrating both the high and low pressure systems during a period of 10 ns, the last ns of this period for each simulation run was analyzed to produce appropriate reference structures (i.e., the average structure for the 9–10 ns simulation period) for the whole protein, as well as reference standard deviation values (i.e., root mean-square fluctuation) for the α-carbons of the protein.
Results and Discussion
To focus the study on the effect of pressure in the changes on hydrogen bond network, one can follow such changes by the analysis of hydrogen bonds (HB) distribution using MD simulation.
Fig. 1 shows the distribution of hydrogen bonds in water at 300 K and 1 bar, 3 kbar, and 10 kbar. At these values of temperature and pressure, water remains in the liquid state. Most hydrogen bonds are distributed between the states of three and four hydrogen bond per water molecule. We can note that, as pressure increases, the number of four HB per molecule decreases, raising the population number for three and five, respectively. Although this phenomenon is most noticeable at 10 kbar, it becomes already visible at 3 kbar, showing that the weakening of HB networking is already present. Such changes in water structure are well known (32–34) and their consequences on the hydrophobic effect quite relevant.
Figure 1.
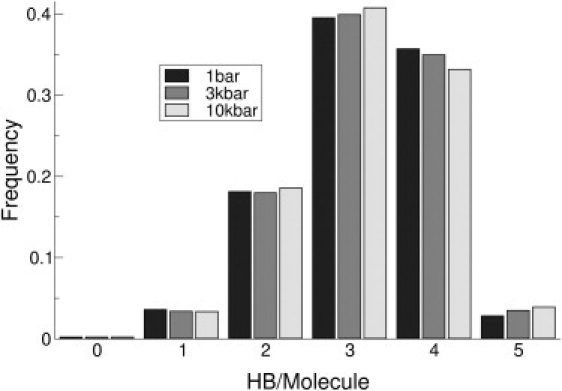
Hydrogen bond distribution of SPC/E water at 300 K at: 1 bar (black), 3 kbar (dark gray), and 10 Kbar (light gray), as obtained by MD simulation. We can observe an increase in three and five HB/mol coordination states, at the expense of four HB/mol, with the rise in pressure. The criteria used to consider the formation of a hydrogen bond was an OHO angle along the bond not <145°, and an O–H distance not >0.24 nm. The error bars have not been incorporated because they are undetectable visually.
Thermodynamically, this change in water structure as a function of pressure means that when computing the free energy of interaction of nonpolar substances in water we must include a term that takes into account the change in entropy with pressure not as in a uniform media, but considering the intrinsic contribution of the structural change.
Previous studies by MD of Lennard-Jones particles in SPC/E water (28) at different conditions of pressure and temperature (35) have qualitatively described the experimental behavior of simple hydrophobic substances in water, as would be expected from the weakening of the hydrogen bond network.
Long MD simulations on apomyoglobin allowed us to follow the process of denaturation by pressure. Fig. 2 shows the average RMSD of the protein α-carbon atoms as a function of time at pressures of 1 bar and 3 kbar. The time dependence of the RMSD gives us information about the structural stability of the molecule. Analyzing the simulation at 1 bar we can see that the protein fluctuates around a homogenous structure. At 3 kbar, a notorious deviation from the initial structure is seen after the first 20 ns and continues to change in multiple steps during the complete run (180 ns). This shows that the protein structure has changed but indicates nothing about the denaturation mechanism.
Figure 2.
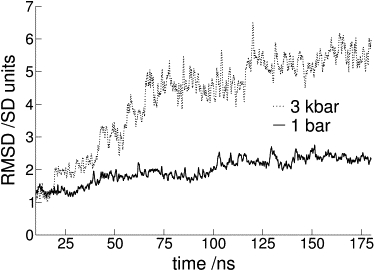
Normalized RMSD (average over all α-carbon atoms of the protein during the whole simulation). The RMSD of the position of α-carbon atoms of the protein along the simulation time shows that at 1 bar the protein remains fluctuating around a homogeneous structure, whereas at 3 kbar a monotonic deviation from the initial structure may be observed. For a better comparison of the high and low pressure RMSD, data has been normalized with the standard deviation values on the ns scale for each system respectively.
The evolution of the solvent accessed surface (SAS) suggests the nature of denaturation under pressure. Looking at the evolution of the hydrophobic and hydrophilic SAS (Fig. 3) it becomes clear that their behavior distinctly differ. Whereas at 1 bar both surfaces fluctuate around a relatively stable average value, at 3 kbar the hydrophobic SAS shows a constant increase rate.
Figure 3.
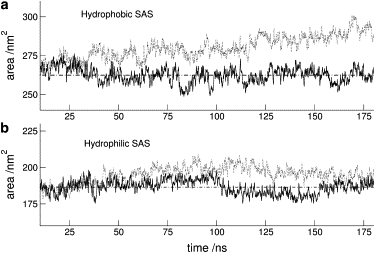
(a) Hydrophobic and (b) hydrophilic SAS: 1 bar (solid line); 3 kbar (dotted line). The horizontal lines (– · – ·) correspond to 1 bar average. We can see that both surfaces at 1 bar fluctuate around a relatively stable value, but the 3 kbar surfaces do not. Although the 3 kbar hydrophilic surface behavior does not allow for any definite conclusion, the constant increase rate in the hydrophobic SAS along the total run shows the wakening of the hydrophobic interaction, which in turn leads to protein unfolding.
We have observed the same phenomenon for lysozyme in which, under pressure, the relative hydrophobic area increases, producing an inversion of the hydrophilic/hydrophobic area ratio (36). Fig. 4 displays the Connelly (37) representation of the solvent accessible surface for the low and high pressure average structures. Looking at the upper part of the figures we can observe that a crevice has appeared on the high pressure structure, which does not exist in the structure at 1 bar. This crevice allows water to come in contact with regions that were previously part of the native protein core, and therefore totally inaccessible to the solvent. MD allows us to follow the process as a function of time and see that the opening of the crevice starts slowly, thus gradually exposing the protein interior to the solvent. However, the crevice does not account for the total hydrophobic SAS increase. Many hydrophobic groups tend to protrude from the surface as well, thus contributing to the total hydrophobic SAS increase.
Figure 4.
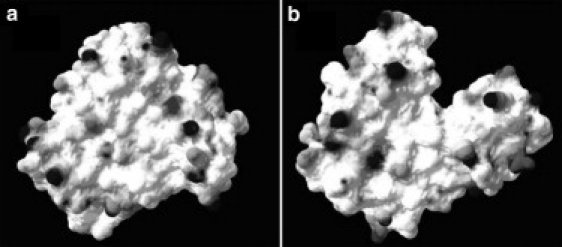
Connelly surface of apomyoglobin. (a) 1 bar. (b) 3 kbar. The color surface corresponds to the electrostatic potential: gray charged, white neutral. This surface is computed rolling a sphere of radius equal to that of a water molecule along the protein, thus evaluating the molecular area accessible to the solvent.
The hydrophobic effect is not a force in the regular sense of the word, but rather a selection of different thermodynamic states. This interaction becomes apparent when a collision of nonpolar particles takes place. The contact of hydrophobic groups is maintained both by dispersion forces and entropy gain. Although on the change in solvent structure the entropy gain is immediately lost, the contact will be kept by dispersion forces, until thermal effects finally overrun this weak interaction. Movements of large protein domains are slow, and their opening and closing motions present a characteristic time that may reach up to 100 ns (38). In a regular situation the hydrophobic effect will help to close an interdomain opening, but the lack of hydrophobic interaction will allow it to remain open, thus altering the overall structure.
The effect of pressure may be different when we have a tightly bound structure (e.g., disulfide bonds covalently stabilizing interdomain interactions) with few readily exposed nonpolar residues. In such a case pressure will cause a general compression of the structure and, unless the protein is otherwise perturbed (either thermally or through the addition of a chemical chaotropic reagent), it will keep its compact conformation. In this situation denaturation would be triggered by any important structural perturbation.
This is exemplified perfectly when comparing the consequences of high pressure on apomyoglobin and lysozyme. They can be regarded as examples of the limiting behavior for globular proteins under pressure. Lysozyme has four disulfide bonds (roughly one bond every 30 residues) whereas apomyoglobin has none (for a total of 153 residues). Although lysozyme is structurally affected by pressure, it keeps a defined structure within the global native fold, which allows for the observation of such changes to be described, both by NMR experiments (39) and simulation (36). Apomyoglobin, on the contrary, is continuously changing, probably toward a completely unfolded state, as is shown experimentally (40) and in these results (preliminary results can be seen in McCarthy and Grigeria (41)).
Assuming that proteins under pressure denature because of the weakening of the hydrophobic effect, comparison may be made between the behavior of proteins and simple nonpolar solutes under pressure. If this approach is taken with a naïve interpretation we will face a serious contradiction (42). In proteins, volume changes on unfolding are positive at low pressure and negative at high pressure, whereas simple nonpolar solutes show the opposite behavior, i.e., the ΔV of transfer from a nonpolar environment to water is negative at low pressure and positive at high pressure.
At low pressures the negative value of the excess volume for the transfer of hydrocarbons from nonpolar medium to water is due mainly to the packing effect (43), because nonpolar molecules are able to accommodate relatively well when surrounded by low density state water. Thus, packing effects are expected to overrun the positive contribution of the hydrophobic hydration. At higher pressures, due to the modified water structure, the transfer is made to a water medium depleted in its low density state.
Water in the vicinity of nonpolar groups shows a much higher compressibility than that of both hydrophilic hydration and bulk water (44,45). Therefore, under high pressure conditions, the exposure of the hydrophobic core of a globular protein to the solvent naturally results in a decrease of the volume of the system. Thus, the unfolding/denaturing process will be favored.
Two phenomena are present under high pressure: the weakening of hydrophobic interaction as a driving force to start the process and a decrease in the volume of the system as the hydrophobic core is exposed. This process leads to a tighter packing of water around nonpolar molecules (46) and an increase in the nonpolar surface accessible, as is shown in Fig. 3.
The increasing of nonpolar solvation is not a unique feature of high pressure denaturation, it is also a common feature of cold denaturation (47,48).
Moderate pressures do not produce full unfolding of proteins and, although the protein may lose activity due to structure changes, almost no exposure of hydrophobic groups is produced. It should be noted that the system volume change is not always positive (3).
The volume change has contributions due to the exposure of polar and nonpolar groups, electrostriction, and elimination of cavities. At high pressure the hydrophobic effect, the main factor in maintaining native structure, decays. Even under the complete absence of hydrophobic interactions, the hydrophobic groups cannot be freely transferred from the protein interior to the solvent, because they are not isolated, like in the case of simple solutes, but connected to the amino acid chain and subject to geometrical constraints.
It has been shown recently that different regions of globular proteins show different sensitivities to pressure (49,50). Equally, studies with cavity-creating mutations (3,51,52) have suggested that the elimination of internal voids may be the predominant contribution to negative value of ΔV in most proteins; therefore volume changes as a function of pressure cannot be assigned to a single process.
Hayakawa et al. (53) have studied the denaturation of ovalbumin, bovine serum albumin, and β-lactoglobulin using spectrofluorometry, specific rotation analysis, and differential scanning calorimetry, by action of pressure and chaotropic reagents, such as urea and guanidine hydrochloride. The effect of pressure, is detected at 2 kbar, and is similar to that produced by the cleavage of the hydrogen bonds by the chemical agents.
We have already mentioned the behavior of lysozyme that presents a native-like conformer at 3 kbar, whereas at the same pressure apomyoglobin starts to unfold. This is not a surprise because in the first case we are dealing with a protein that has four disulfide bonds, which tightly restrain conformational changes in the overall tertiary fold. The latter case not only lacks disulfide bonds but also has its prosthetic heme group removed. rendering a much less stable native fold. Therefore, it is not possible to define a critical pressure for any globular protein because the denaturation effect will depend on the structural characteristics of each particular case.
We can conclude that the main driving force of protein denaturation at high pressures is the decrease of the hydrophobic effect as a consequence of the changes in water structure, without contradicting any of the current theories on the hydrophobic effect.
Acknowledgments
We thank Dr. S. A. Grigera for comments. J.R.G. is a member of the Carrera del Investigador of CONICET. A.N.M.C. is a member of the Carrera del Investigador of CIC.
This work was partially supported by the Consejo Nacional de Investigaciones Científicas y Técnicas of Argentina, the University of La Plata, the Comisión de Investigaciones Científicas de la Provincia de Buenos Aires, and the Agencia Nacional de Promoción Científica y Tecnológica of Argentina.
References
- 1.Kauzmann W. Some factors in the interpretation of the protein denaturation. Adv. Protein Chem. 1959;14:1–63. doi: 10.1016/s0065-3233(08)60608-7. [DOI] [PubMed] [Google Scholar]
- 2.Jaenicke R. Protein folding: local structures, domains, subunits, and assemblies. Biochemistry. 1991;30:3147–3161. doi: 10.1021/bi00227a001. [DOI] [PubMed] [Google Scholar]
- 3.Royer C. Revisiting volume changes in pressure-induced protein unfolding. Biochim Biophys Acta. 2002;1595:201–209. doi: 10.1016/s0167-4838(01)00344-2. [DOI] [PubMed] [Google Scholar]
- 4.Goldammer V., Hertz H.G. Molecular motion and structure of aqueous mixtures with nonelectrolytes as studied by nuclear magnetic relaxation methods. J. Phys. Chem. 1970;74:3734–3755. [Google Scholar]
- 5.Hallenga K., Grigera J.R., Berendsen H.J.C. Influence of hydrophobic solutes on the dynamic behavior of water. J. Phys. Chem. 1980;84:2381–2390. [Google Scholar]
- 6.Rezus Y.L.A., Bakker H.J. Observation of immobilized water molecules around hydrophobic groups. Phys. Rev. Lett. 2007;99:148301. doi: 10.1103/PhysRevLett.99.148301. [DOI] [PubMed] [Google Scholar]
- 7.Franks F. Royal Society of Chemistry; Cambridge, UK: 2000. Water: A Matrix of Life. [Google Scholar]
- 8.Landolt-Börnstein . Numerical Data and Functions in Physics. Vol. 4. Springer-Verlag; Heidelberg, New York: 1980. [Google Scholar]
- 9.Woolf L.A. Tracer diffusion of tritiated water (THO) in ordinary water (H2O) under pressure. J. C. S. Faraday I. 1975;71:784–796. [Google Scholar]
- 10.Starr F.W., Bellissent-Funel M.C., Stanley H.E. Structure of supercooled and glassy water under pressure. Phys. Rev. E. Stat. Phys. Plasmas Fluids Relat. Interdiscip. Topics. 1999;60:1084–1087. doi: 10.1103/physreve.60.1084. [DOI] [PubMed] [Google Scholar]
- 11.Cai Y.Q., Mao H.K., Kao C.C. Ordering of hydrogen bonds in high-pressure low-temperature H2O. Phys. Rev Lett. 2005;94:025502. doi: 10.1103/PhysRevLett.94.025502. [DOI] [PubMed] [Google Scholar]
- 12.Horne R.A., Johnson D.S. The effect of electrolyte on the viscosity of water under pressure. J. Phys. Chem. 1966;70:2182–2190. [Google Scholar]
- 13.Prielmeier F.X., Lang E.W., Lüdemann H.D. Diffusion in supercooled water to 300 MPa. Phys. Rev. Lett. 1987;59:1128–1131. doi: 10.1103/PhysRevLett.59.1128. [DOI] [PubMed] [Google Scholar]
- 14.Hawley S.A. Reversible pressure—temperature denaturation of chymotrypsinogen. Biochemistry. 1971;10:2436–2442. doi: 10.1021/bi00789a002. [DOI] [PubMed] [Google Scholar]
- 15.Smeller L. Pressure-temperature phase diagrams of biomolecules. Biochim. Biophys. Acta. 2002;1595:11–29. doi: 10.1016/s0167-4838(01)00332-6. [DOI] [PubMed] [Google Scholar]
- 16.Wiedersich J., Köhler S., Friedrich J. Temperature and pressure dependence of protein stability: the engineered fluorescein-binding lipocalin FluA shows an elliptic phase diagram. Proc. Natl. Acad. Sci. USA. 2008;105:5756–5761. doi: 10.1073/pnas.0710409105. [DOI] [PMC free article] [PubMed] [Google Scholar]
- 17.Marqués M.I., Borreguero J.M., Dokholyan N.V. Possible mechanism for cold denaturation of proteins at high pressure. Phys. Rev. Lett. 2003;91:138103. doi: 10.1103/PhysRevLett.91.138103. [DOI] [PubMed] [Google Scholar]
- 18.Hummer G., Garde S., Paulaitis M.E. The pressure dependence of hydrophobic interactions is consistent with the observed pressure denaturation of proteins. Proc. Natl. Acad. Sci. USA. 1998;95:1552–1555. doi: 10.1073/pnas.95.4.1552. [DOI] [PMC free article] [PubMed] [Google Scholar]
- 19.Bryngelson J.D., Onuchic J.N., Wolynes P.G. Funnels, pathways, and the energy landscape of protein folding: a synthesis. Proteins. 1995;21:167–195. doi: 10.1002/prot.340210302. [DOI] [PubMed] [Google Scholar]
- 20.Chara O., MacCarthy A.N., Grigera J.R. Studying the unfolding kinetics of proteins under pressure using long molecular dynamic simulation runs. J. Biol. Phys. 2007;33:523–539. doi: 10.1007/s10867-008-9083-2. [DOI] [PMC free article] [PubMed] [Google Scholar]
- 21.Berendsen H.J.C., van der Spoel D., van Drunen R. GROMACS: a message-passing parallel molecular dynamics implementation. Comput. Phys. Commun. 1995;91:43–56. [Google Scholar]
- 22.Lindahl E., Hess B., van der Spoel D. GROMACS 3.0: a package for molecular simulation and trajectory analysis. J. Mol. Model. 2001;7:306–317. [Google Scholar]
- 23.van Gunsteren W.F., Berendsen H.J.C. Computer simulation of molecular dynamics: methodology, applications, and perspectives in chemistry. Angew. Chem. Int. Ed. Engl. 1990;29:992–1023. [Google Scholar]
- 24.van Gunsteren W.F., Berendsen H.J.C. Biomos BV; Groningen, The Netherlands: 1987. GROMOS-87 Manual. [Google Scholar]
- 25.Buuren A.R., Marrink S.J., Berendsen H.J.C. A molecular dynamics study of the decane/water interface. J. Phys. Chem. 1993;97:9206–9212. [Google Scholar]
- 26.Hess B., Bekker H., Fraaije J.G.E.M. LINCS: a linear constraint solver for molecular simulations. J. Comput. Chem. 1997;18:1463–1472. [Google Scholar]
- 27.Miyamoto S., Kollman P.A. SETTLE: an analytical version of the SHAKE and RATTLE algorithms for rigid water models. J. Comput. Chem. 1992;13:952–962. [Google Scholar]
- 28.Berendsen H.J.C., Grigera J.R., Straatsma T.P. The missing term in effective pair potentials. J. Phys. Chem. 1987;91:6269–6271. [Google Scholar]
- 29.Hess B., van der Vegt N.F.A. Hydration thermodynamic properties of amino acid analogues: a systematic comparison of biomolecular force fields and water models. J. Phys. Chem. B. 2006;110:17616–17626. doi: 10.1021/jp0641029. [DOI] [PubMed] [Google Scholar]
- 30.Zhang Z., Duan Z. Prediction of the PVT properties of water over wide range of temperatures and pressures from molecular dynamics simulation. Phys. Earth Planet. Inter. 2005;149:335–354. [Google Scholar]
- 31.Berendsen H.J.C., Postma J.P.M.A., Haak J.R. Molecular dynamics with coupling to an external bath. J. Chem. Phys. 1984;81:3684–3690. [Google Scholar]
- 32.Postorino P., Tromp R.H., Nielson G.W. The interatomic structure of water at supercritical temperatures. Nature. 1993;366:668–670. [Google Scholar]
- 33.Errington J.R., Debenedetti P.G. Relationship between structural order and the anomalies of liquid water. Nature. 2001;409:318–321. doi: 10.1038/35053024. [DOI] [PubMed] [Google Scholar]
- 34.Leberman R., Soper A.K. Effect of high salt concentrations on water structure. Nature. 1995;378:364–366. doi: 10.1038/378364a0. [DOI] [PubMed] [Google Scholar]
- 35.Ferrara C.G., MacCarthy A.N., Grigera J.R. Clustering of Lennard-Jones particles in water: temperature and pressure effects. J. Chem. Phys. 2007;127::104502. doi: 10.1063/1.2768966. [DOI] [PubMed] [Google Scholar]
- 36.McCarthy A.N., Grigera J.R. Effect of pressure on the conformation of proteins. A molecular dynamics simulation of lysozyme. J. Mol. Graph. Model. 2006;24:254–261. doi: 10.1016/j.jmgm.2005.09.007. [DOI] [PubMed] [Google Scholar]
- 37.Eisenhaber F., Lijnzaad F., Scharf M. The double cube lattice method: efficient approaches to numerical integration of surface area and volume and to dot surface contouring of molecular assemblies. J. Comput. Chem. 1995;16:273–284. [Google Scholar]
- 38.McCammon J.A., Harvey S.C. Cambridge University Press; Cambridge, UK: 1987. Dynamics of Proteins and Nucleic Acids. [Google Scholar]
- 39.Akasaka K. Highly fluctuating protein structures revealed by variable-pressure nuclear magnetic resonance. Biochemistry. 2003;42:10875–10885. doi: 10.1021/bi034722p. [DOI] [PubMed] [Google Scholar]
- 40.Kitahara R., Yamada H., Wright P.E. High pressure NMR reveals that apomyoglobin is an equilibrium mixture from the native to the unfolded. J. Mol. Biol. 2002;320:311–319. doi: 10.1016/S0022-2836(02)00449-7. [DOI] [PubMed] [Google Scholar]
- 41.McCarthy A.N., Grigera J.R. Pressure denaturation of apomyoglobin: a molecular dynamics simulation study. Biochim. Biophys. Acta. 2006;1764:506–515. doi: 10.1016/j.bbapap.2005.11.015. [DOI] [PubMed] [Google Scholar]
- 42.Kauzmann W. Thermodynamics of unfolding. Nature. 1987;325:763–764. [Google Scholar]
- 43.Imai T., Hirata F. Hydrophobic effect on partial molar volume. J. Chem. Phys. 2005;122:094509. doi: 10.1063/1.1854626. [DOI] [PubMed] [Google Scholar]
- 44.Smolin N., Winter R. A molecular dynamics simulation of SNASE and its hydration shell at high temperature and high pressure. Biochim. Biophys. Acta. 2006;1764:522–534. doi: 10.1016/j.bbapap.2006.01.003. [DOI] [PubMed] [Google Scholar]
- 45.Sarupria S., Garde S. Quantifying water density fluctuations and compressibility of hydration shells of hydrophobic solutes and proteins. Phys. Rev. Lett. 2009;103:037803. doi: 10.1103/PhysRevLett.103.037803. [DOI] [PubMed] [Google Scholar]
- 46.Paschek D., Hempel S., Garcia A.E. Computing the stability diagram of the Trp- Cage miniprotein. Proc. Natl. Acad. Sci. USA. 2008;118:17754–17759. doi: 10.1073/pnas.0804775105. [DOI] [PMC free article] [PubMed] [Google Scholar]
- 47.Lopez C.F., Darst R.K., Rossky P.J. Mechanistic elements of protein cold denaturation. J. Phys. Chem. B. 2008;112:5961–5967. doi: 10.1021/jp075928t. [DOI] [PubMed] [Google Scholar]
- 48.Holzmann J., Ludwig R., Geiger A. Pressure and salt effects in simulated water: two sides of the same coin? Angew. Chem. Int. Ed. 2007;46:8907–8911. doi: 10.1002/anie.200702736. [DOI] [PubMed] [Google Scholar]
- 49.Fuentes E., Wand J. Local dynamics of apocytochrome b562 examined by the dependence of hydrogen exchange on hydration pressure. Biochemistry. 1998;47:9877–9883. doi: 10.1021/bi980894o. [DOI] [PubMed] [Google Scholar]
- 50.Refaee M., Tezuka T., Williamson M.P. Pressure-dependent changes in the solution structure of hen egg-white lysozyme. J. Mol. Biol. 2003;327:857–865. doi: 10.1016/s0022-2836(03)00209-2. [DOI] [PubMed] [Google Scholar]
- 51.Torrent J., Connelly J.P., Vilanova M. Pressure versus heat-induced unfolding of ribonuclease A: the case of hydrophobic interactions within a chain-folding initiation site. Biochemistry. 1999;42:5952–5961. doi: 10.1021/bi991460b. [DOI] [PubMed] [Google Scholar]
- 52.Lassalle M.W., Yamada H., Akasaka K. Filling a cavity dramatically increases pressure stability of the c-Myb R2 subdomain. Proteins. 2001;45:96–101. doi: 10.1002/prot.1128. [DOI] [PubMed] [Google Scholar]
- 53.Hayakawa I., Linko Y.Y., Linko P. Mechanism of high pressure denaturation of proteins. Lebensm. Wiss. Technol. 1996;29:756–762. [Google Scholar]