

Abstract
It is plain enough that a horse is made for running, but similar statements about motile cells are not so obvious. Here the basis for structure-function relations in cell motility is explored by application of a new computational technique that allows realistic three-dimensional simulations of cells migrating on flat substrata. With this approach, some cyber cells spontaneously display the classic irregular protrusion cycles and handmirror morphology of a crawling fibroblast, and others the steady gliding motility and crescent morphology of a fish keratocyte. The keratocyte motif is caused by optimal recycling of the cytoskeleton from the back to the front so that more of the periphery can be devoted to protrusion. These calculations are a step toward bridging the gap between the integrated mechanics and biophysics of whole cells and the microscopic molecular biology of cytoskeletal components.
Introduction
When cultured on a flat surface, most animal cells spread into a round pancake and then become polarized with a leading edge driving forward-movement and a trailing edge that appears to retard it. Despite this general similarity, there exists a remarkable variety of cellular shapes and levels of motility ranging from the nimble but stably gliding crescent of the fish keratocyte to the slower, ever-changing protrusion-retraction cycles of the handmirror fibroblast. Much effort has been expended to understand this diversity of form and function in biochemical terms, e.g., by correlating changes of morphology and motility with differences in the expression of various proteins (1), differences in the activity of Rho GTPases (2), and differences in the localization of various components of the cytoskeletal machinery (3). On the other hand, such approaches do not address the root question of physical mechanism. What is there about a certain cellular structure that causes a certain style of motility (or vice versa)?
Of all model systems where cellular locomotion is studied, fish keratocytes display unparalleled uniformity and stability in both morphology and behavior (see (4), for a review). Yet the origin and relation of form and function in keratocytes remains a puzzle, and although significant insights have been developed (5–7), there is no current work that explains, from first principles, why/how these cells exhibit their stereotypic appearance and behavior. To attack such questions we have developed a low-Reynolds number hydrodynamic finite element code called Cytopede. It is specifically tailored to the modeling of thin, reactive, viscoelastic bodies spread on flat surfaces and is thus applicable to most laboratory studies where cells are plated on dishes or coverslips. Crucially, it is capable of making direct contact with datasets such as actin speckle microscopy and traction force microscopy (8,9).
We present here early findings regarding the morphology of migrating cells obtained with Cytopede. First, we show that simple physicomechanical models of cytoskeletal rheology and protrusive activity can predict key characteristic shapes and locomotory features observed in living cells. Second, we show that the transition between fibroblast and keratocytelike motility can be accomplished by simple modification of a pair of critical mechanical parameters. Third, and most importantly, we use cytomechanical modeling to highlight key predictions and ambiguities in our current understanding of the forces and interactions that control cells at the macroscopic level. We hope that these will serve to motivate new experimental studies.
We encourage readers to download Movie S1, Movie S2, Movie S3, and Movie S4, available in the Supporting Material. We find that the intrinsically dynamical interplay of cell shape and motility makes it difficult to appreciate either aspect on the basis of still images alone.
The Model
For modeling purposes, we will consider the migration of a cell to result from an interplay among properties of its cytoplasm, its membrane, and the substratum. Our approach to the cytoplasm rests on two conceptual paradigms. First, that it is essentially a porous composite medium composed partly of a cross-linked polymer network (the cytoskeleton) and partly of an aqueous medium (the cytosol). Second, that there exists a mesoscopic length scale, small compared to the cell but large compared to individual molecules at which the properties of the cytoskeleton and of the cytosol can be described by continuous fields (i.e., by coarse-graining). From this, it is possible to define the cytoskeletal and cytosolic volume fraction θn and θs and corresponding velocity fields vn and vs at every point inside the cell (subscripts s and n hereafter denote solvent/cytosolic and network/cytoskeletal quantities, respectively). General equations of mass and momentum conservation can then be formulated to govern the time evolution of these fields (see Appendix) and thereby determine the motion of the cell and the flows within the cell. This reactive interpenetrating flow formalism (10) has been used to successfully model, in two dimensions, a number of cellular phenomena such as sea urchin egg cytokinesis (11) or neutrophil phagocytosis (12). In this work, a full three-dimensional model is used.
Aspects of motility that are subject to biological control are embodied by a set of constitutive relations and boundary conditions which feed into the basic evolution equations. Examples of such laws are conversion of cytosol to cytoskeleton by polymerization, changes in cytoskeletal material properties due to cross-linking, surface stresses due to membrane tension, and dynamics of adhesion and peeling. For this study, the needed constitutive rules are minimal. First, the cytoskeletal volume fraction at chemical equilibrium is generally ∼0.1%, but with provision for a 10-fold increase at protruding edges where polymerization is stimulated. The bulk cytoskeletal turnover timescale τn is taken to be ∼20 s but with provision for a 10-fold decrease at edges where polymerization or depolymerization is stimulated. As a mechanical material, the cytoskeletal network phase is essentially viewed as a glassy polymer melt with creep viscosity proportional to density and with baseline value of ∼50 Pa s when θn = 0.1%.
Protrusion of the cell boundary is caused by a thin boundary layer under the membrane in which the cytoskeletal stress in the normal direction to the membrane is proportional to the rate of polymerization (13). Assuming that the thickness of the boundary layer is ∼1 μm, the stress energy within the layer is ∼1.8 kBT per monomer (14). Flattening of the cell against the substrate is driven by contractile forces that pull the dorsal and ventral surfaces toward each other (maximum strength at the leading edge 800 pN μm−2).
When new membrane at the leading edge comes into contact with the substratum we assume immediate adhesion, and the boundary condition for the cytoskeletal velocity becomes no-slip (vn = 0 at the substratum). Detachment at the rear of the cell occurs when the contact angle falls below a threshold value. Membrane tension is taken to be proportional to area cubed (γ = 0.01(A/A0)3 mN m−1, with A0 the area of the spherical cell). The exact functional form for the area-tension relation is based on existing data in neutrophils (15) but any other steep power or exponential law can be used. In our calculations for spread cells A/A0 ∼2 – 3 so that γ ∼0.1 – 0.4 mN m−1. Finally, the cytoplasmic volume, without nucleus (which is not required for locomotion; see (16)), is taken to be ∼230 μm3 and is conserved during the simulations.
A more detailed description of the methodology is provided in the Appendix of this article.
Results
Protrusion and contraction forces must cooperate to drive flattening
The prologue to migration is initial cell-substrate attachment followed by active flattening and expansion of the adhesive contact zone. The thin symmetric morphology that emerges from the flattening process has an aspect ratio of ∼20 (diameter/height) and is stationary except for small fluctuations and internal motions. Polarized migrating cells usually emerge from such stable pancake configurations either spontaneously or under external stimulation.
We cannot here digress into the details of flattening dynamics; however, from a general physical perspective, there are two classes of mechanisms that can support what is observed. The first class includes vertical contractile forces that pull the dorsal and ventral surfaces toward each other. This modality bears some analogy to the wetting of a clean surface by a fluid under the influence of Coulomb and/or van der Waals forces (17). The second class of mechanisms is that of lateral (horizontal) forces that drive the contact line out and because of volume conservation, stretch the cell onto the substratum. This second modality can be rationalized in terms of Brownian ratchet mechanisms where protrusion force is related to cytoskeletal polymerization (18) (see Appendix).
One of our key findings from prior work with simple two-dimensional models is that both these mechanisms are required to drive flattening (12). Lateral polymerization-related protrusion forces are needed if only to generate centripetal flow of cytoskeleton which clearly cannot be driven by vertical forces. On the other hand, protrusion alone is also not sufficient. To push outward in the radial or lateral direction, the cytoskeleton needs to also push back against a well-anchored thrust plate. Vertical forces generate a compact backstop of cytoskeleton linked to adhesion sites that has high resistance to slippage and buckling under shear. Modulation of the vertical force allows engagement and disengagement of the cytoskeletal clutch that controls forward traction (19,20). In addition, if unchecked in the vertical direction, polymerization-driven protrusive force causes a large bulge at the leading edge (as also noted in (21)). Vertical contractility dampens this instability so that protrusive activity is largely directed along the substrate tangent.
A disk-shaped initial condition to the model motile cell
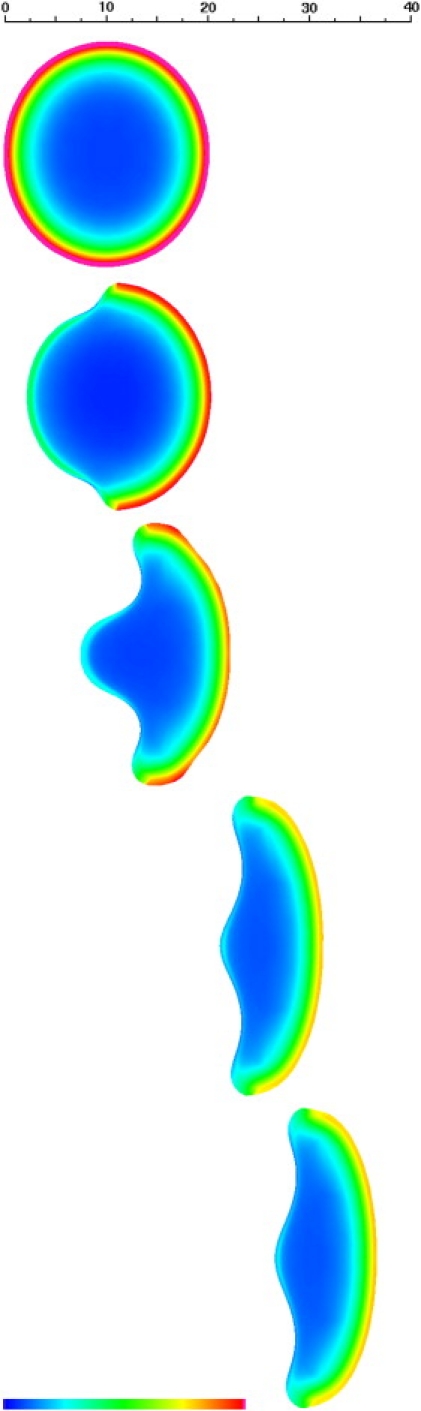
We begin with a hemispherical shape and activate the entire cell circumference with cytoskeletal polymerization coupled with vertical contractile force. This drives out the contact line, leading to a fried-egg morphology. Gradually, however, as the cell flattens (Fig. 1), its surface area increases, resisting further protrusion until, eventually, a stable equilibrium disklike shape is reached with diameter ∼20 μm, and height ∼1 μm. There is no bulge in the middle of this final disk because we have neglected the nucleus.
Figure 1.
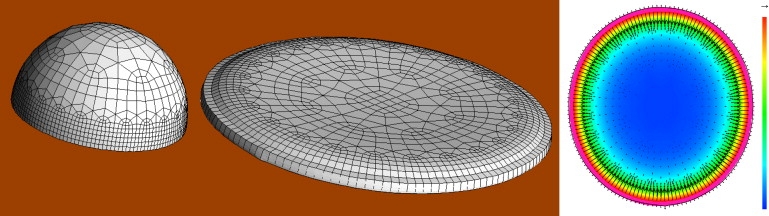
Initial flattening of a model cell from a hemisphere into a pancake shape (100 s) shown on the left. On the right, cytoskeletal density and velocity field in the flattened model cell (scale from 0 to 2% volume fraction; top-right arrow, 0.1 μm s−1). See also Movie S1 and Movie S3.
The equilibrium disk is characterized by a high density of cytoskeleton at the perimeter (volume fraction θn ∼2%), and centripetal flow of cytoskeleton, ∼0.1 μm s−1 on the dorsal surface (recall that at the ventral surface, the no-slip boundary condition enforces vn = 0). The surface tension at which further protrusion stalls is 0.4 mN m−1 and can be readily identified with a force of protrusion of ∼800 pN per μm of leading edge (12,22). This also matches the maximum compressive vertical force that is required to keep the leading edge from bulging out. It is this spread disk that provides the initial condition for all the various models of locomotion discussed below.
Minimal assumptions lead to fibroblastlike cell shapes and movements
As a first calculation, we abrogate network polymerization over 75% of the circumference of the equilibrium disk while maintaining standard activity in the remaining 25%. When the contact angle of the cell with the substratum becomes <45°, we allow peeling until the critical angle is recovered.
Starting from the initial disk, advance and retraction of different boundaries eventually leads to a cell with an unmistakable fibroblastic phenotype (as described long ago in (23)). The cyber-fibroblast takes on a handmirror, elongated shape with length ∼30 μm and migration velocity ∼0.03 μm s−1 (Fig. 2). Although its aspect remains generally triangular, its shape is subject to continual chaotic fluctuations. This dynamical behavior at steady state affects the leading edge and the tail in separate ways (Movie S1 and Movie S2 in Supporting Material).
Figure 2.
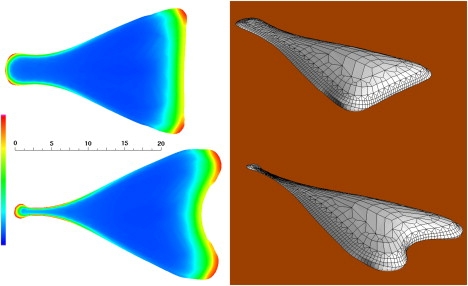
A model fibroblast at 320 s (top) and 385 s (bottom). Left panels show the ventral cytoskeletal volume fraction (scale from 0 to 2%). Right panels show three-dimensional rendering of the cell surface, surface lines correspond to the computational mesh. See Movie S1 and Movie S2.
What is seen at the leading edge are episodes of localized advance that result in the formation of pseudopodial structures followed by a phase where the rest of the activated leading edge catches up and reestablishes a nearly straight anterior contact line. In our models, this occurs because of boundary conditions: to trigger interior cytoskeletal assembly, we postulate the emission of a polymerization messenger with finite range of activity from the membrane at the leading edge. When the leading edge becomes inwardly concave, the local membrane to volume ratio increases; this triggers more polymerization, which leads to more protrusion, which in turn accentuates the concavity. The reverse is true when the leading edge becomes inwardly convex. This process is balanced by the effect of the surface tension which acts to reduce curvature.
In the cyber-fibroblast, retraction occurs spontaneously by surface tension which establishes feedback between frontal progression and rear detachment (24). However, because of its elongated nature, the tail is vulnerable to the so-called dripping faucet instability by which surface tension causes pinching off of small cytoplasts. This is what we observe in our model fibroblasts. This also terminates the simulations due to extreme distortion of the computational mesh.
The notion that tail retraction can happen without such contractility is in accord with reports about the effects of myosin inhibition in real fibroblasts (25). However, it is also clear that even without perturbation of the myosin apparatus, fibroblasts can have very long tails, and that these are more prominent when myosin IIa activity is disrupted (26,27). It would not be surprising if the need for myosin is contingent on the degree and strength of the adhesive contacts that need to be broken at the trailing edge (see Discussion below). Testing of this mechanical hypothesis will require further calculations with specialized treatment of the trailing-edge adhesive dynamics.
Slight modifications lead to the fish keratocyte
In contrast with the fibroblast, the main qualitative feature of the migrating keratocyte is the extraordinary stability of its shape, speed, and internal dynamics (28,29). At first glance, two main mechanical differences with the fibroblast are apparent:
-
1.
The fraction of the cell perimeter where active polymerization of the cytoskeleton occurs is ∼50% (approximately twice that of the fibroblast).
-
2.
Adhesion at the rear of the cell is weaker, allowing rapid detachment.
On this basis, starting again from the initial condition of a disklike spread model cell, we maintain polymerization on 50% of the cell circumference and set the critical contact angle for peeling to 80° (corresponding values were 25% and 45° for the cyber-fibroblast).
The result of this numerical experiment is shown in Fig. 3, and immediately shows a significant difficulty in that the putative model keratocyte is growing an extended tail. Closer examination reveals that this is due to a plug of swept-up cytoskeleton that is collected and trapped as the rear retracts. The huge viscosity of the material in this plug shears against the substrate and impedes the tail retraction even though there is an increased critical angle for detachment. Essentially, our cyber-keratocyte is failing because we have tried to compensate for the decreased length of the retracting margin by decreasing the force needed to cause retraction, but we have made no provision to maintain balance between the rates of translocation and the rate at which material is recycled from the back to the front.
Figure 3.
An unsuccessful model of a keratocyte at 100 s. Distance scale in μm, color represents ventral cytoskeletal volume fraction (scale 0–2%).
Accelerated disassembly of cytoskeleton at the rear produces a stable keratocytelike model
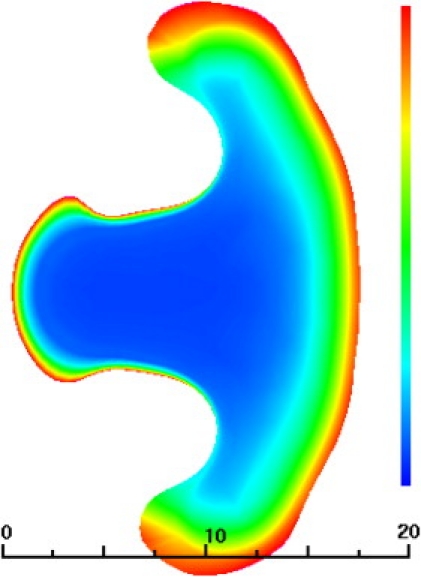
To enable faster disassembly at the rear of the cell, we increase 10-fold the equilibration rate of the cytoskeleton only at the inactive portion of the circumference of the cell so that the disassembly timescale at the trailing edges is now 2 s instead of 20 s.
As is shown in Figs. 4 and 5 (see also Movie S3 and Movie S4), after a transition from the initial disk shape that lasts ∼150 s, a stable typical keratocytelike shape emerges with a wingspan of 30 μm and a maximum longitudinal dimension of 10 μm. Compared to the initial disk, the surface area and footprint of the cell decreases; this is simply the result of a reduction of the percent of the contact line that is actively protrusive. Consequently, our model predicts a fourfold drop in surface tension after a discoid flattened cell starts to move. The passive, inactive trailing edge is thus stretched between the two wings. Despite enhanced disassembly, a small amount of cytoskeleton swept up by the rear of the cell during translation accumulates to form a dimple at the very back, which is in essence a vestigial tail (Fig. 5).
Figure 4.
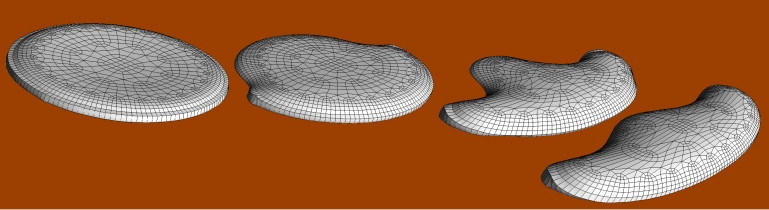
Hemispherical cell (−100 s) flattened to its equilibrium pancake shape (0 s) by activation of the entire circumference. This is followed by deactivation of half of the circumference gradually leading to a stable gliding shape resembling a keratocyte (10, 50, 200 s). See Movie S3.
Figure 5.
Ventral cytoskeletal volume fraction for the keratocyte at 0, 10, 50, 150, and 200 s. Distance scale in μm, color scale spans 0–2% volume fraction. Note the decrease in maximum cytoskeletal density between the spread discoid cell and the migrating keratocyte. This is due to the fact that in the keratocyte, the activated leading-edge moves sufficiently fast as to prevent full polymerization of cytoskeleton at a given location. See Movie S4.
The crescent shape with a >3:1 aspect ratio is in astonishing agreement with the observed geometry of real keratocytes in that it spontaneously emerges without any fine-tuning of parameters. In our cyber-keratocyte, this shape is the product of antagonistic forces: protrusion at the wings tends to expand the cell in the transverse direction but this is countered by a complex combination of surface tension, viscous stress, and hydrodynamic pressure. The detailed kinematics of flow, reaction, protrusion, and retraction at the tips of the wings conspire to produce a self-similar structure that is miraculously stable without so much as a suggestion of oscillation or wobble in the cell trajectory and contour (Movie S3 and Movie S4). Inspection of the cytoskeletal velocity field (which at the membrane itself is the velocity of the boundary, Fig. 6) shows that the kinematics of displacement are close to the predictions of graded radial extension rather than those of a solid body translation (4,28). A comparison with flow maps derived from F-actin speckle tracking (see Fig. 2.4 in (4)) shows that the flow fields are similar in our simulations with one potentially significant exception: as described below in the next paragraph, in our model, the very leading edge has both forward and rearward flow depending on height. What is observed in the laboratory frame is a zero-flow stagnation point, potentially an average of these two flow components.
Figure 6.
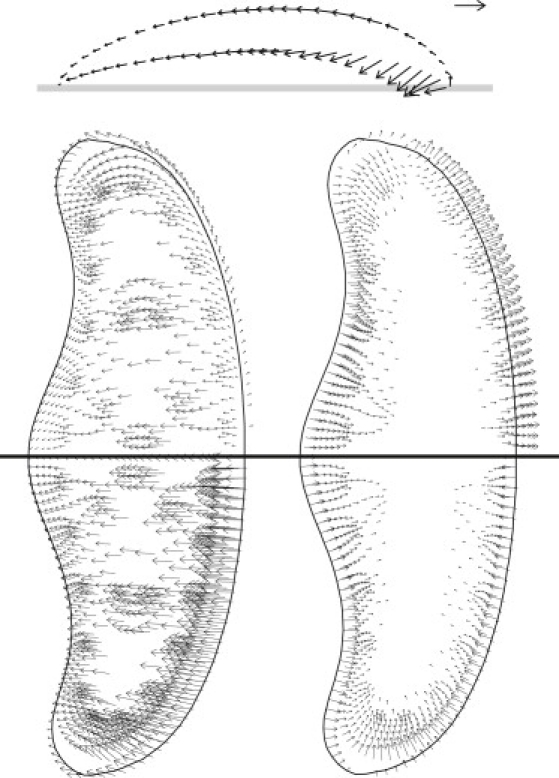
(Top) Keratocyte cytoskeletal velocity field vn at the midsagittal plane given in the cell frame of reference. Solid line represents the substratum. (Lower left) Dorsal (top-half) and midheight (bottom-half) keratocyte cytoskeletal velocity field in the cell frame. (Lower right) Same as left, but in the laboratory frame. Velocity arrow scale is 0.2 μm s−1. Note that at the membrane boundary, the cytoskeletal flow vn matches the actual motion of the boundary. However, in the interior, cytosolic flow vs is typically forward, so that vn is very different from the average volume flow v = θnvn + θsvs.
Our cyber-keratocyte migrates in a straight line at a realistic constant velocity 0.1 μm s−1. The cytoskeletal velocity field (Fig. 6) shows that the very front of the cell projects over the substrate for some distance, but is not in contact. Within this protrusion nose-cone, migration is accomplished by forward extension followed by downward contact with the substratum. Thus, at the leading edge, the vector of cytoskeletal motion is strongly dependent on the height above the substrate. In the frame of the leading edge, the network does not roll forward at the top and backward at the bottom like a tank tread, but rather rolls backward at different rates on top and bottom.
Protrusion at the wings is thwarted by the restraining role of surface tension; it is there that the classic centripetal flow is most evident because the protrusive force is unable to advance the contact line forward and instead drives the cytoskeleton backward at all levels above the substrate. Frustrated protrusion at the wings thus causes large vertical shears that apply inwardly directed viscous stresses to the substratum; these shears are of similar nature to the cell-substrate pinching tractions long known to be characteristic of the keratocyte (30). The velocity, the height, and the viscosity yield an estimate of 100 pN μm−2 as the maximum traction exerted by our model keratocyte at its wing tips. This is smaller than typically measured for keratocytes by traction microscopy and may be related to the lack of an actomyosin contractile apparatus in our model. This is consistent with the observation that tractions at the wings decrease by 50% after myosin II inhibition (31).
Discussion
The simple cellular models presented here simultaneously reproduce a range of locomotory behaviors and cellular characteristics (dimensions, cytoskeletal density, and flow) while calling upon a relatively small set of rules. Some of these rules are concerned with spatial control of cytoskeletal chemistry and are supported by experimental (3) and theoretical (6,7) reports, although they focus on largely kinematic descriptions of the cell unlike our current mechanical analysis. In general, they confirm the intuitive notion (of which we have made full use) that morphology will be highly sensitive to the spatial extent of stimulation of protrusion and retraction.
We were completely taken by surprise that models of such minimal complexity would—on essentially a first attempt—lead to distinctly recognizable motile phenotypes, and this makes us strongly suspect that basic universal principles of efficiency and parsimony are at work here. For the speedy motion of a cell on a flat substratum, it stands to reason that >50% of the circumference devoted to protrusion will be wasted, and that less would diminish the velocity. Similarly, optimization demands that disassembly of cytoskeleton keep up with assembly in the front without undue accumulation of flotsam and jetsam at the rear. Finally, a stable shape demands that the contact line dynamics (adhesion at the leading edge, peeling at the rear) be coordinated by rapid and consistent feedback between front and back (provided in our model by the cortical tension). It is probable that any underlying biological processes implementing these constraints will lead to the emergence of a similar keratocyte structure.
Conversely, a smaller fraction of activated perimeter and a less efficient cytoskeletal disassembly/detachment will lead to a fibroblastlike structure. Intermediate types between the two would lead to amoeboid phenotypes such as observed in migrating neutrophils. Fortunately, such questions can be addressed via further simulations exploring the broad parameter space of cytoskeletal chemistry and motor activity. In addition, the simulations highlight other significant issues that will have to be addressed by additional experimental and theoretical analysis; these are discussed below.
How is the volume of spread cells distributed?
Experimental studies have focused on localization of individual components of the molecular machinery of migrating cells. Unfortunately, data are much more sparse on actual thickness (height) maps of plated cells and how these correlate with cellular behavior and laboratory maneuvers. Similarly, because most prior modeling studies pertaining migrating cells have been performed in two dimensions, questions of thickness have not come to the fore in the past (32,33).
It is noteworthy that the models presented here do not account for the thin lamellipodium (or ruffling membrane) at the leading edge that is observed in many migrating cells. However, recent evidence has shown that at least in some situations, the lamellipodium is unnecessary for locomotion and that its role may be more sensory than mechanical (34,35). In our simulations, the thickness of the leading edge (∼1 μm) is determined by the balance of a vertical contractile force (possibly mediated by unconventional myosins, or by bundling of actin filaments parallel to the substratum) and a polymerization-driven protrusion force which, while pushing out, also pushes up. The protrusion force is constrained by experimental data on stall forces (12,22); this in turn sets the vertical contractility. It would be possible to make the leading-edge thinner by stronger flattening forces, but at ∼800 pN μm−2 at the very leading-edge of our models, it is already large.
Although recognizing this as an open issue with this work, we remark that the assumed nonnuclear cytoplasmic volume for our model keratocyte and fibroblast is rather low, so that for a given spread-cell-surface area, the average thickness that we obtain cannot be a gross overestimate or underestimate. Still, experimental measurements of the thickness of cells under various conditions with a cytosolic fluorophore could easily shed additional light on this question.
How are elongated cells stabilized against fragmentation by pinching?
In all simulations of elongated cells performed so far, we have observed periodic pinching-off of the tail from the cell body as seen in Fig. 2. This is a general tendency that is intrinsic to any structure with high aspect ratio for which cohesion is mediated by surface tension, because it will always be vulnerable to a dripping faucet-type of instability. Although real fibroblasts occasionally abandon part of their tail, this is not a universal rule, and this implies the existence of mechanism(s) that sense and prevent incipient fragmentation. One well-known process is that of major detachment events with abrogation of adhesion over a large portion of the tail, thus allowing its retraction in the cell body and further advancement of the leading lamella (36). Some support is provided by evidence that stretch-activated calcium channels turn on before these retraction events (37). Another possibility is that the tail is stabilized by local alteration of the viscoelastic properties of the cytoskeleton (e.g., by gelation) at the potential pinch point. And finally, one can hypothesize circumstances in which global front-to-back cohesion is mediated by internal (contractile) cytoskeletal stress fibers rather than cortical tension as discussed in the next section (see also (38)).
The main point here is that maintenance of physical integrity in motile cells is not a given—in fact, we were surprised that a model keratocyte could be obtained with minimal safeguards against fragmentation. However, we will now have to better understand how fibroblastlike cells stay in one piece.
What is the role of myosin II in the cell body?
An important result of this study is that we did not have to incorporate contractility in the cell body to replicate gross aspects of cell shape and motility with the model. Experimental evidence here is conflicting; a number of groups ((25,31,39), and J. Lee, University of Connecticut, private communication, 2008) have found that inhibition of myosin activity only has a slight impact on the morphology of motile cells, whereas others ((26,27,40,41); and for (26), note the remarkable similarity between their Fig. S3 and our Fig. 3) have found the opposite. Potential explanations for these divergent findings include a special role for myosin in breaking-off rear adhesions, which would only be apparent beyond a certain level of substratum stickiness as demonstrated in a Dictyostelium myosin null mutant (42). Another factor is the role of myosin in breaking symmetry in an initially circular cell to establish front/back polarity (5,39) in keratocytes.
An aim of our work was to construct minimal models of reduced complexity, hence the “symmetry-breaking by fiat” in the transition from a disk to a motile cell, or the conditions on retraction of the trailing edge related to the contact angle. In either case, this is a step toward a goal to create fully self-contained models which will give us the opportunity to test hypotheses regarding the mechanical functions of conventional myosin in motile cells.
Appendix
Here we provide a brief sketch of the basic evolution equations governing the models that we have presented (complete details describing the biophysical underpinnings and algorithms for implementation are the subject of another article).
Mass and momentum conservation
The volume fractions of the two phases must add up to one:
| (1) |
The cytoplasm is incompressible:
| (2) |
Network fraction (cytoskeleton) may only change by polymerization or transport:
| (3) |
J is the net rate of conversion of solvent to network (or cytosol to cytoskeleton) by polymerization at a given location.
Pressure gradients and cytoskeletal drag determine solvent flow:
| (4) |
P is the pressure, and H is the solvent-network drag coefficient. (Typically H is very small so that pressure gradients are also small, but see (43) for examples where this might not be true.)
Pressure gradients, cytoskeletal drag, and other stresss determine the flow of the network:
| (5) |
In this equation, ΨnM is the stress (tensor) due to network-membrane interactions, ΨnS is the stress due to network-substratum interactions, and ν is the network viscosity.
Constitutive equations
Prescriptions are necessary to determine J, H, ΨnM, ΨnS, and ν, and provide closure to the mass and momentum equations: these are the constitutive equations that establish the connection between physical laws and biological behavior. The constitutive parameters that are used for our calculations are listed in Table 1. Network polymerization is
| (6) |
where θeq is the equilibrium network concentration, and τn = 20 s is an equilibration timescale modulated by the local (dimensionless) concentration m of a polymerization messenger,
| (7) |
where θ0 is a baseline (quiescent) network concentration taken to be 0.1%. The polymerization messenger is generated at activated portions of the plasma membrane and diffuses into the cytoplasm with diffusion coefficient Dm = 10−8 cm2 s−1 and lifetime τm = 1 s,
| (8) |
where we neglect advection by the solvent (the Peclet number is small). The Neumann boundary condition at the membrane is
| (9) |
where εm is the local emissivity of messenger. In the simulations, εm is set to be maximum (∼10−3 cm s−1) near activated portions of the contact line and zero further out, so that m ∼10 at the activated membrane and rapidly decays into the cytoplasm over the penetration depth dm = (Dmτm)1/2 = 1 μm. Note that the messenger is, of course, a catch-all for a complicated collection of biochemical intermediates, and is not intended to represent a real single signaling molecule.
Table 1.
Modeling parameters
| Parameters | Symbol | Values | |
|---|---|---|---|
| Cytoplasmic volume | Vc | 230 μm3 | |
| Network polymerization | |||
| Base network density | θ0 | 10−3 | |
| Base network turnover time | τn | 20 s | |
| Messenger concentration | m | 0–13 | |
| Equilibrium network | θeq = θ0(1 + m) | 10−3 – 1.3 × 10⁻² | |
| Messenger diffusion coefficient | Dm | 1 μm2 s−1 | |
| Messenger decay time | τm | 1 s | |
| Messenger penetration depth | 1 μm | ||
| Messenger emissivity | εm | 0 – 2 × 10⁻³ | |
| Momentum equation | |||
| Specific network viscosity | ν0 | 5 × 10⁻⁴ Pa s | |
| Disjoining force strength | ψ0nMdMmθn | mθn × 10 mN m−1 | |
| Attractive force strength | ψ0nSdSεm | εm × (− 400 mN m−1) | |
| Network-solvent drag | H | 160 pN s μm−4 | |
Cytoplasmic volume computed from observed volume of spherical keratocytes in suspension (J. Lee, University of Connecticut, private communication, 2008). Parameters related to network concentration, viscosity, and network-solvent drag derived from neutrophil data and modeling (see (12,13), and references therein). Attractive and disjoining force strengths are the minimum values required to drive the correct flattening ratio and the correct velocities.
Network-membrane interaction
To drive protrusion, we implement a network-membrane repulsive stress term which has the form
| (10) |
where nn is the dyadic of the unit vector outward normal to the membrane. For ΨnM > 0 the effect is to cause a normal stress or pressure that acts to push the membrane out. Naturally, the network experiences an equal and opposite reaction so that this stress corresponds to a disjoining force that tends to expand the cortical network layer. In a polymerization force model, this depends on the local polymerization rate (driven by the messenger m) and the network density:
Network-substratum interaction
To limit vertical protrusion and maintain the leading-edge as thin, we implement a network-substratum attractive stress term which has the form
| (11) |
where nn is the dyadic of the unit vector downward normal to the substratum. For ΨnS < 0, the effect is to cause a stress that acts to pull the network down toward the substratum. This stress would presumably be due to molecular motors active at trans-membrane adhesion complexes anchored to the substratum. In our calculations,
where εm is the local emissivity of the messenger. Thus, the attraction is maximum where polymerization of network is maximum.
Cytoskeletal viscosity
The viscosity is taken to be linearly dependent on network concentration: We use ν0 = 5 × 10⁴ Pa s so that at baseline network concentration θ0 = 0.1%, the viscosity is 50 Pa s, but can become an order-of-magnitude larger in regions of polymerizing activity where cytoskeleton is denser.
Boundary conditions
We assume impermeability of the plasma membrane to both cytosol and cytoskeleton,
| (12) |
where n is the unit normal vector to the membrane, and vM is the velocity of the membrane. Boundary conditions differ depending on whether one is considering a contact or free boundary. For the ventral surface of the cell which is in contact with the substratum, we postulate that adhesion via trans-membrane proteins immobilizes the cytoskeleton, and we therefore set vn = 0 (stick boundary condition). The only exception is the trailing edge of the cell where we allow slippage when the contact angle decreases past a threshold value (80° for the keratocyte model, 45° for the fibroblast model). For the dorsum of the cell, the motion of the free surface is determined by balancing the internal stresses while taking into account the contribution of surface tension (there are no external stresses in this case),
| (13) |
where Ψ is the full interior network stress tensor, γ is the cortical tension, and κ is the mean curvature of the surface. The tension γ essentially reflects the availability of membrane to accommodate additional surface area (15) and should therefore be a monotonically decreasing function of total cell area. We have found that the precise functional form is not important as long as the tension increases sharply when the area becomes large, so we have simply used
| (14) |
where A is the surface area of the cell, and A0 is the area of a sphere with the volume of the cell (a constant because volume is conserved).
Supporting Material
Four movies are available at http://www.biophysj.org/biophysj/supplemental/S0006-3495(10)00004-4.
Supporting Material
Acknowledgments
This work was supported by National Institutes of Health grant No. R01 GM72002.
A current version of the Cytopede code is available by request to interested researchers.
References
- 1.Bakal C., Aach J., Perrimon N. Quantitative morphological signatures define local signaling networks regulating cell morphology. Science. 2007;316:1753–1756.. doi: 10.1126/science.1140324. [DOI] [PubMed] [Google Scholar]
- 2.Jaffe A.B., Hall A. Rho GTPases: biochemistry and biology. Annu. Rev. Cell Dev. Biol. 2005;21:247–269. doi: 10.1146/annurev.cellbio.21.020604.150721. [DOI] [PubMed] [Google Scholar]
- 3.Lacayo C.I., Pincus Z., Theriot J.A. Emergence of large-scale cell morphology and movement from local actin filament growth dynamics. PLoS Biol. 2007;5:e233. doi: 10.1371/journal.pbio.0050233. [DOI] [PMC free article] [PubMed] [Google Scholar]
- 4.Keren K., Theriot J.A. Biophysical aspects of actin-based cell motility in fish epithelial keratocytes. In: Lenz P., editor. Cell Motility, Vol. XIV, Biological and Medical Physics, Biomedical Engineering. Springer; New York: 2008. [Google Scholar]
- 5.Kozlov M.M., Mogilner A. Model of polarization and bistability of cell fragments. Biophys. J. 2007;93:3811–3819. doi: 10.1529/biophysj.107.110411. [DOI] [PMC free article] [PubMed] [Google Scholar]
- 6.Satulovsky J., Lui R., Wang Y.L. Exploring the control circuit of cell migration by mathematical modeling. Biophys. J. 2008;94:3671–3683. doi: 10.1529/biophysj.107.117002. [DOI] [PMC free article] [PubMed] [Google Scholar]
- 7.Nishimura S.I., Ueda M., Sasai M. Cortical factor feedback model for cellular locomotion and cytofission. PLOS Comput. Biol. 2009;5:e1000310. doi: 10.1371/journal.pcbi.1000310. [DOI] [PMC free article] [PubMed] [Google Scholar]
- 8.Vallotton P., Gupton S.L., Danuser G. Simultaneous mapping of filamentous actin flow and turnover in migrating cells by quantitative fluorescent speckle microscopy. Proc. Natl. Acad. Sci. USA. 2004;101:9660–9665. doi: 10.1073/pnas.0300552101. [DOI] [PMC free article] [PubMed] [Google Scholar]
- 9.Dembo M., Wang Y.L. Stresses at the cell-to-substrate interface during locomotion of fibroblasts. Biophys. J. 1999;76:2307–2316. doi: 10.1016/S0006-3495(99)77386-8. [DOI] [PMC free article] [PubMed] [Google Scholar]
- 10.Dembo M., Harlow F. Cell motion, contractile networks, and the physics of interpenetrating reactive flow. Biophys. J. 1986;50:109–121. doi: 10.1016/S0006-3495(86)83444-0. [DOI] [PMC free article] [PubMed] [Google Scholar]
- 11.He X., Dembo M. On the mechanics of the first cleavage division of the sea urchin egg. Exp. Cell Res. 1997;233:252–273. doi: 10.1006/excr.1997.3585. [DOI] [PubMed] [Google Scholar]
- 12.Herant M., Heinrich V., Dembo M. Mechanics of neutrophil phagocytosis: experiments and quantitative models. J. Cell Sci. 2006;119:1903–1913. doi: 10.1242/jcs.02876. [DOI] [PubMed] [Google Scholar]
- 13.Herant M., Marganski W.A., Dembo M. The mechanics of neutrophils: synthetic modeling of three experiments. Biophys. J. 2003;84:3389–3413. doi: 10.1016/S0006-3495(03)70062-9. [DOI] [PMC free article] [PubMed] [Google Scholar]
- 14.Kovar D.R., Pollard T.D. Insertional assembly of actin filament barbed ends in association with formins produces picoNewton forces. Proc. Natl. Acad. Sci. USA. 2004;101:14725–14730. doi: 10.1073/pnas.0405902101. [DOI] [PMC free article] [PubMed] [Google Scholar]
- 15.Herant M., Heinrich V., Dembo M. Mechanics of neutrophil phagocytosis: behavior of the cortical tension. J. Cell Sci. 2005;118:1789–1797. doi: 10.1242/jcs.02275. [DOI] [PubMed] [Google Scholar]
- 16.Verkhovsky A.B., Svitkina T.M., Borisy G.G. Self-polarization and directional motility of cytoplasm. Curr. Biol. 1999;9:11–20. doi: 10.1016/s0960-9822(99)80042-6. [DOI] [PubMed] [Google Scholar]
- 17.de Gennes P.G. Wetting: statics and dynamics. Rev. Mod. Phys. 1985;57:827–863. [Google Scholar]
- 18.Peskin C.S., Odell G.M., Oster G.F. Cellular motions and thermal fluctuations: the Brownian ratchet. Biophys. J. 1993;65:316–324. doi: 10.1016/S0006-3495(93)81035-X. [DOI] [PMC free article] [PubMed] [Google Scholar]
- 19.Mitchison T., Kirschner M. Cytoskeletal dynamics and nerve growth. Neuron. 1988;1:761–772. doi: 10.1016/0896-6273(88)90124-9. [DOI] [PubMed] [Google Scholar]
- 20.Hu K., Ji L., Waterman-Storer C.M. Differential transmission of actin motion within focal adhesions. Science. 2007;315:111–115. doi: 10.1126/science.1135085. [DOI] [PubMed] [Google Scholar]
- 21.Atilgan E., Wirtz D., Sun S.X. Morphology of the lamellipodium and organization of actin filaments at the leading edge of crawling cells. Biophys. J. 2005;89:3589–3602. doi: 10.1529/biophysj.105.065383. [DOI] [PMC free article] [PubMed] [Google Scholar]
- 22.Prass M., Jacobson K., Radmacher M. Direct measurement of the lamellipodial protrusive force in a migrating cell. J. Cell Biol. 2006;174:767–772. doi: 10.1083/jcb.200601159. [DOI] [PMC free article] [PubMed] [Google Scholar]
- 23.Abercrombie M., Heaysman J.E., Pegrum S.M. The locomotion of fibroblasts in culture. I. Movements of the leading edge. Exp. Cell Res. 1970;59:393–398. doi: 10.1016/0014-4827(70)90646-4. [DOI] [PubMed] [Google Scholar]
- 24.Chen W.T. Surface changes during retraction-induced spreading of fibroblasts. J. Cell Sci. 1981;49:1–13. doi: 10.1242/jcs.49.1.1a. [DOI] [PubMed] [Google Scholar]
- 25.Beningo K.A., Hamao K., Hosoya H. Traction forces of fibroblasts are regulated by the Rho-dependent kinase but not by the myosin light chain kinase. Arch. Biochem. Biophys. 2006;456:224–231. doi: 10.1016/j.abb.2006.09.025. [DOI] [PMC free article] [PubMed] [Google Scholar]
- 26.Even-Ram S., Doyle A.D., Yamada K.M. Myosin IIA regulates cell motility and actomyosin-microtubule crosstalk. Nat. Cell Biol. 2007;9:299–309. doi: 10.1038/ncb1540. [DOI] [PubMed] [Google Scholar]
- 27.Vicente-Manzanares M., Zareno J., Horwitz A.F. Regulation of protrusion, adhesion dynamics, and polarity by myosins IIA and IIB in migrating cells. J. Cell Biol. 2007;176:573–580. doi: 10.1083/jcb.200612043. [DOI] [PMC free article] [PubMed] [Google Scholar]
- 28.Lee J., Ishihara A., Jacobson K. Principles of locomotion for simple-shaped cells. Nature. 1993;362:167–171. doi: 10.1038/362167a0. [DOI] [PubMed] [Google Scholar]
- 29.Keren K., Pincus Z., Theriot J.A. Mechanism of shape determination in motile cells. Nature. 2008;453:475–480. doi: 10.1038/nature06952. [DOI] [PMC free article] [PubMed] [Google Scholar]
- 30.Dembo M., Oliver T., Jacobson K. Imaging the traction stresses exerted by locomoting cells with the elastic substratum method. Biophys. J. 1996;70:2008–2022. doi: 10.1016/S0006-3495(96)79767-9. [DOI] [PMC free article] [PubMed] [Google Scholar]
- 31.Jurado C., Haserick J.R., Lee J. Slipping or gripping? Fluorescent speckle microscopy in fish keratocytes reveals two different mechanisms for generating a retrograde flow of actin. Mol. Biol. Cell. 2005;16:507–518. doi: 10.1091/mbc.E04-10-0860. [DOI] [PMC free article] [PubMed] [Google Scholar]
- 32.Rubinstein B., Jacobson K., Mogilner A. Multiscale two-dimensional modeling of a motile simple-shaped cell. Multiscale Model Simul. 2005;3:413–439. doi: 10.1137/04060370X. [DOI] [PMC free article] [PubMed] [Google Scholar]
- 33.Huber F., Käs J., Stuhrmann B. Growing actin networks form lamellipodium and lamellum by self-assembly. Biophys. J. 2008;95:5508–5523. doi: 10.1529/biophysj.108.134817. [DOI] [PMC free article] [PubMed] [Google Scholar]
- 34.Gupton S.L., Anderson K.L., Waterman-Storer C.M. Cell migration without a lamellipodium: translation of actin dynamics into cell movement mediated by tropomyosin. J. Cell Biol. 2005;168:619–631. doi: 10.1083/jcb.200406063. [DOI] [PMC free article] [PubMed] [Google Scholar]
- 35.Galbraith C.G., Yamada K.M., Galbraith J.A. Polymerizing actin fibers position integrins primed to probe for adhesion sites. Science. 2007;315:992–995. doi: 10.1126/science.1137904. [DOI] [PubMed] [Google Scholar]
- 36.Chen W.T. Mechanism of retraction of the trailing edge during fibroblast movement. J. Cell Biol. 1981;90:187–200. doi: 10.1083/jcb.90.1.187. [DOI] [PMC free article] [PubMed] [Google Scholar]
- 37.Doyle A., Marganski W., Lee J. Calcium transients induce spatially coordinated increases in traction force during the movement of fish keratocytes. J. Cell Sci. 2004;117:2203–2214. doi: 10.1242/jcs.01087. http://dx.doi.org/10.1242/jcs.01087 [DOI] [PubMed] [Google Scholar]
- 38.Bischofs I.B., Klein F., Schwarz U.S. Filamentous network mechanics and active contractility determine cell and tissue shape. Biophys. J. 2008;95:3488–3496. doi: 10.1529/biophysj.108.134296. [DOI] [PMC free article] [PubMed] [Google Scholar]
- 39.Yam P.T., Wilson C.A., Theriot J.A. Actin-myosin network reorganization breaks symmetry at the cell rear to spontaneously initiate polarized cell motility. J. Cell Biol. 2007;178:1207–1221. doi: 10.1083/jcb.200706012. [DOI] [PMC free article] [PubMed] [Google Scholar]
- 40.Straight A.F., Cheung A., Mitchison T.J. Dissecting temporal and spatial control of cytokinesis with a myosin II Inhibitor. Science. 2003;299:1743–1747. doi: 10.1126/science.1081412. [DOI] [PubMed] [Google Scholar]
- 41.Schaub S., Bohnet S., Verkhovsky A.B. Comparative maps of motion and assembly of filamentous actin and myosin II in migrating cells. Mol. Biol. Cell. 2007;18:3723–3732. doi: 10.1091/mbc.E06-09-0859. [DOI] [PMC free article] [PubMed] [Google Scholar]
- 42.Jay P.Y., Pham P.A., Elson E.L. A mechanical function of myosin II in cell motility. J. Cell Sci. 1995;108:387–393. doi: 10.1242/jcs.108.1.387. [DOI] [PubMed] [Google Scholar]
- 43.Mitchison T.J., Charras G.T., Mahadevan L. Implications of a poroelastic cytoplasm for the dynamics of animal cell shape. Semin. Cell Dev. Biol. 2008;19:215–223. doi: 10.1016/j.semcdb.2008.01.008. [DOI] [PMC free article] [PubMed] [Google Scholar]
Associated Data
This section collects any data citations, data availability statements, or supplementary materials included in this article.