Abstract
The γ-aminobutyric acid type B receptor (GABABR), one of the family C G-protein-coupled receptor members, exists as a heterodimer comprised of subunits GB1 and GB2. To clarify the ligand-induced activation mechanism of the GABABR, each subunit was fused with either Cerulean or enhanced yellow fluorescent protein at its intracellular loop, and fluorescence resonance energy transfer (FRET) changes upon agonist application were monitored. As a result, FRET decreases were observed between GB1a loop 2 and GB2 loop 2 and between GB1a loop 2 and GB2 loop 1, suggesting the dissociation of intracellular domains during the receptor activation. Both intersubunit FRET pairs were expected to faithfully capture the activation of the original receptor as their pharmacological properties were highly similar to that of the wild-type receptor. However, the intrasubunit data suggest that the receptor activation does not involve major structural changes within the transmembrane domain of each subunit. By combining the results obtained from two different levels, it was concluded that the GABABR activation by agonist is associated with an asymmetrical intersubunit rearrangement of GB1a and GB2 on the membrane. This type of activation mode, an intersubunit rearrangement without apparent intrahelical structural changes, appears commonly shared by the GABABR and the metabotropic glutamate receptor 1α, another family C G-protein-coupled receptor previously studied by our group. Nevertheless, the directions of intracellular domain movements and its asymmetry observed here highlight the qualitative difference between the two receptors.
Keywords: G Proteins/Coupled Receptors (GPCR), Membrane/Biophysics, Membrane/Proteins, Methods/Fluorescence, Neurobiology/Neuroscience, Receptors/7-Helix Ligand-gated Channels, Signal Transduction
Introduction
G-protein-coupled receptors (GPCRs)2 mediate various physiological responses in cells of organisms. They are expressed on the cell membrane and are known to have extracellular N and intracellular C termini and seven-transmembrane domain (7TMD) as a commonly shared motif. These GPCRs can be categorized into three groups, family A, B, and C (1). Family A includes rhodopsin, adrenergic receptors, adenosine receptors, and muscarinic acetylcholine receptors (mAChRs), etc. Family B members are basically hormone receptors. The last group, family C, is represented by homodimeric metabotropic glutamate receptors (mGluRs) and heterodimeric GABAB receptor (GABABR), both known for their extremely large extracellular domains, the so-called venus flytrap modules (VFTM) (2).
Mechanisms of activation in GPCRs, how signals triggered by bound ligands are transmitted to their intracellular regions via 7TMD, are in general still poorly understood except for well studied family A members. The activation models proposed for family A GPCRs commonly suggest that the intracellular part of helix VI moves away from the bundle of other helices during activation (3–6). Moreover, understanding of the activation mechanism of this family is greatly aided by x-ray crystallography recently applied for several members (7–10). In contrast, not much is known for the activation mechanism of family C. This is partly because there are no receptors in this family whose full atomic coordinates are solved by x-ray crystallography. So far, this method has revealed the crystal structures of only the extracellular domains of mGluRs (11–13). No crystal structures have been reported for the GABABR yet, making a proposal of its activation model difficult.
Fluorescence resonance energy transfer (FRET)-based technology emerged during the last decade has made the investigation of GPCR activation fruitful, largely because of its ability to report events on the cell membrane in a time-lapse manner. To date, by introducing FRET fluorophores at the intracellular loop and the C terminus of receptor protomer, several studies have clarified the activation mechanism in family A and B receptors (14–16). All of them demonstrated FRET changes upon ligand applications, consistent with previously proposed intra-protomer conformational changes, thus validating the usefulness of this methodology (17, 18). As for family C, the above approach has also been applied for homodimeric mGluR1α by our group, revealing the intersubunit rearrangement upon the receptor activation by glutamate application (19). Furthermore, this work also demonstrated the absence of intrasubunit FRET changes, unlike what were seen for other family members, which suggests a qualitatively different activation mechanism for the family C receptor.
Given the limited information about the three-dimensional structures of family C GPCRs, elucidating how their 7TMDs and intracellular domains behave upon ligand binding would greatly benefit the understanding of these members in the activated state. In particular, the GABABR has not been characterized at the static crystal structure level and is less studied from the dynamic aspects. So far, some activation models for this receptor have been proposed, but these are still largely dependent on the findings from the crystallography of mGluR1α VFTM (20–22). Therefore, in this study we intended to dissect the conformational changes of the GABABR associated with ligand-induced activation by employing the FRET approach. This study will examine the receptor from two different levels, intersubunit FRET and intrasubunit FRET, both based on fluorescent proteins fused at the intracellular domain of the receptor. Because the GABABR is a heterodimer comprised of a ligand-sensing GB1a and a G-protein-coupled GB2, the receptor is expected to trigger the activation mode, which is distinct from that of homodimeric mGluR1α.
EXPERIMENTAL PROCEDURES
Molecular Biology
Throughout FRET pair construction, KOD Plus version 2 polymerase (Toyobo) was used for PCR, and each sequence was verified. Cerulean- and EYFP-coding sequences were amplified from pCerulean-N1, a homemade vector modified from pECFP-N1 based on a previous report (23), and pEYFP-N1 vectors, respectively.
GABABR Inter- and Intrasubunit FRET Constructs
For GB1a intersubunit FRET constructs, Cerulean- or EYFP-coding sequence was inserted into one of the intracellular loops by blunt-end ligation. The sites of insertion were as follows: i1 (Gln625/Pro626); i2 (Glu705/Pro706); and i3 (Thr795/Glu796). The fluorescent proteins were flanked by additionally inserted Gly-Gly-Gly peptides. GB2 constructs were designed in the same way to have fluorophore insertion sites as follows: i1 (Ser515/Pro516); i2 (Lys592/Asp593); and i3 (Ile682/Pro683). The fluorescent proteins were flanked by the GGG peptides. All intersubunit constructs were subcloned into pcDNA3. Intrasubunit FRET pairs (all designed to have EYFP at the loop and Cerulean at the C terminus) were constructed using above-mentioned intersubunit FRET constructs as templates. For GB2 FRET pairs, Cerulean-coding sequence was added after Thr818 or Asp769 at the introduced SalI site. As for GB1a FRET pairs, Cerulean sequence was added after Thr872 at the introduced SalI site. Each insert was finally subcloned into pcDNA3 vector at the EcoRI and NotI sites.
mAChR Intrasubunit FRET Constructs
First, mAChR M1 subunit sequence corresponding to Glu242–Ala337 in the third intracellular loop (i3) was truncated by initial PCR amplification from the original clone. Second, Cerulean- or EYFP-coding sequence was inserted into the i3 between Ser241 and Gly338 by blunt-end ligation. The resulting product was finally subcloned into pEYFP-N1 or pCerulean-N1 vector at the XhoI and BamHI sites.
GABABR Chimeric Subunits
The GB1a/GB2-i2Cer chimera, having the extracellular domain of GB1a and 7TMD of GB2, was fused at Pro573/Lys464. The GB2/GB1a-i2EYFP chimera, possessing the extracellular domain of GB2 and 7TMD of GB1a, was fused at Pro463/Ala574. These joints are based on previously published report by Galvez et al. (24).
Cell Culture
HEK293T cells were maintained in Dulbecco's modified Eagle's medium (Nissui Pharmaceutical) supplemented with 4 mm l-glutamine, 10% (v/v) fetal bovine serum (JRH Biosciences), 100 units/ml penicillin, and 100 μg/ml streptomycin (Sigma). Cells were incubated at 37 °C under 5% CO2 and passaged when they reached 90% confluence. cDNAs were transfected by Lipofectamine 2000 reagent (Invitrogen) according to the manufacturer's instructions. 4–6 h after transfection, cells were reseeded onto glass-bottom dishes (Matsunami or AGC Techno Glass). Experiments were carried out within 24–36 h after transfection.
Total Internal Reflection Fluorescence Image Acquisition and FRET Analysis
Cells on a glass-bottom dish were continuously perfused with HEPES-based buffer (140 mm NaCl, 3.4 mm KOH, 10 mm HEPES, 1.0 mm Ca2+, 1.3 mm Mg2+, 10 mm glucose; adjusted at pH 7.4) by gravity at a rate of about 3 ml/min, and ligands were applied by changing the perfusion solutions. All ligands were purchased from Tocris Bioscience except for CGP7930 from Sigma. Fluorescence from single cells expressing the Cerulean and EYFP pair was imaged and measured using a total internal reflection fluorescence microscope (IX71, Olympus Corp.) equipped with an oil-immersion objective lens (60×, 1.45 numerical aperture) and He-Cd (442 nm) and Ar (515 nm) lasers. Cerulean was excited by the 442-nm laser line, and the emission signals from Cerulean and EYFP via FRET were divided by DM505 dichroic mirror (Chroma Technology) mounted on image splitter (SIP-FRET, Olympus Corp.) and then passed through S470/30 and S535/30 (Chroma Technology) filters, respectively. The divided images were amplified by an image intensifier unit (C8600, Hamamatsu Photonics) and then simultaneously recorded using a cooled CCD camera (MicroMAX: 512BFT, Roper Scientific). The exposure time was 100 ms, and images were collected every 3 s.
Throughout this study, all FRET values are expressed as the net FRET (nF) normalized by the Cerulean intensity, calculated by the following formula: nF/Cerulean = (IFRET − (ICerulean × 0.37))/ICerulean, where IFRET and ICerulean denote the background-subtracted intensities of EYFP via FRET and Cerulean, respectively. The factor 0.37, a bleed through fraction of Cerulean fluorescence into the FRET channel in our setup, was experimentally determined. Although the fraction of EYFP fluorescence by direct excitation of acceptor at 442 nm is not subtracted in this calculation, its validity has been confirmed (supplemental data 1). Similar ways of calculation are also adopted by other studies as well (14, 16). The data are expressed as means ± S.E., with n indicating the number of data. Concentration-response curves were fitted to logistic curves using Origin 6.1 software (OriginLab). Differences between groups were statistically analyzed by Tukey's test using KyPlot software (Kyence). Values of p < 0.05 were considered as statistically significant.
Saturation Radioligand Binding Assay
Membrane fractions were prepared from HEK293T cells transfected with GB1a and GB2 constructs. The membrane preparation (90–147 μg of protein) was incubated with various concentrations (2.8–14 nm) of radiolabeled GABABR antagonist [3H]CGP54626 (specific activity was 40 Ci/mmol, American Radiolabeled Chemicals) in the presence of 50 mm Tris acetate buffer, pH 7.6, for 40 min at 20 °C. The reaction was terminated by filtration on GF/B filters. The filters were quickly washed with ice-cold binding buffer and counted by a scintillation counter. Specific binding was determined by subtracting nonspecific binding obtained in the presence of 2 mm GABA. Saturation binding curves were fitted to a one-site binding model, and Kd and Bmax values were calculated by Prism4 (GraphPad Software).
RESULTS
Intersubunit FRET between GB1a and GB2
Six GB1a constructs were made by inserting a fluorescent protein into the first (i1), second (i2), or third (i3) intracellular loop of the subunit. These are GB1a-i1Cerulean (Cer), GB1a-i2Cer, GB1a-i3Cer, and their EYFP versions. In the same manner, six GB2 constructs were made as follows: GB2-i1EYFP, GB2-i2EYFP, GB2-i3EYFP, and their Cerulean versions. In case GB1a is fixed as a donor and GB2 is fixed as an acceptor, nine heterodimeric combinations are available using the above constructs. Normal membrane expression of all these heterodimers was confirmed by total internal reflection fluorescence microscopy. The GB1a constructs were functional when paired with GB2 wild-type as they activated G-protein-coupled inwardly rectifying potassium type 2 (GIRK2) channel upon agonist application (supplemental data 2). These results, consistent with earlier studies (24, 25), indicate that the intracellular domain of GB1a appears irrelevant for the normal GABABR function. The GB2 constructs paired with GB1a wild-type were nonfunctional, as predicted from the same previous studies (data not shown).
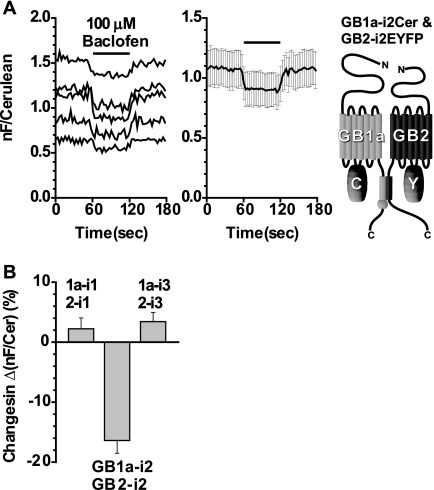
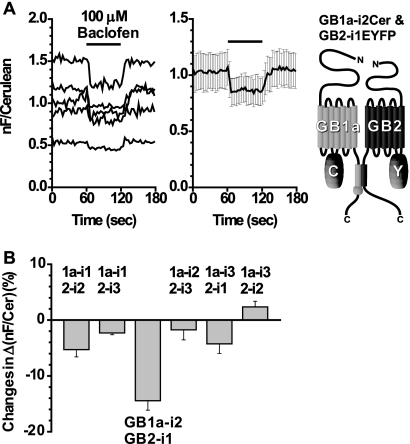
To test whether or not the intersubunit FRET pairs could report the agonist-induced activation, 100 μm baclofen was applied to HEK293T cells expressing the heterodimeric constructs. Among three available combinations where GB1a bearing the donor Cerulean and GB2 tagged with the acceptor EYFP at their intracellular loops with the same position number, the GB1a-i2 and GB2-i2 configuration exhibited notable FRET decreases during the agonist application (Fig. 1A). The average of normalized FRET decreases was −16.4 ± 2.1% (n = 5) from the GB1a-i2 and GB2-i2, whereas those from other combinations were not apparent (GB1a-i1 and GB2-i1, 2.2 ± 1.8%, n = 5; GB1a-i3 and GB2-i3, 3.4 ± 1.5%, n = 4; Fig. 1B). Besides the three pairs shown above, another six combinations are also possible where GB1a and GB2 are tagged with fluorophores at their intracellular loops with the different position numbers, i.e. diagonal relationships. Among these, the GB1a-i2 and GB2-i1 configuration exhibited notable FRET decreases during the agonist application (Fig. 2A), similar to what was observed from the GB1a-i2 and GB2-i2 pair. Averaging of normalized FRET changes of these six pairs revealed that only the GB1a-i2 and GB2-i1 pair had a large response of −14.4 ± 1.7% (n = 5), and changes from others were none or not apparent (GB1a-i1 and GB2-i2, −5.3 ± 1.3%, n = 5; GB1a-i1 and GB2-i3, −2.3 ± 0.3%, n = 5; GB1a-i2 and GB2-i3, −1.7 ± 1.8%, n = 5; GB1a-i3 and GB2-i1, −4.3 ± 1.7%, n = 3; GB1a-i3 and GB2-i2, 2.4 ± 1.0%, n = 5; Fig. 2B).
FIGURE 1.
FRET between the GB1a and GB2 intracellular loops at the same position. A, left, the GB1a-i2Cer and GB2-i2EYFP pair displayed a FRET decrease by applying baclofen. Hereafter, all FRET changes were calculated by nF/Cerulean = (IFRET − (ICerulean × 0.37))/ICerulean (where nF is net FRET). After recording base line for 60 s, 100 μm baclofen was applied for 60 s (black bar) and washed for another 60 s. Each trace represents recording from a single cell. Middle, plots of means ± S.E. (n = 5). Right, schematic drawing of the GB1a-i2Cer and GB2-i2EYFP pair. B, bar graphs summarizing FRET changes in Δ(nF/Cerulean) (%). These were calculated by dividing the averaged amount of evoked changes (eight time points during 80–100 s) by the averaged base lines (eight time points during 20–40 s). Among three available combinations, only the GB1a-i2Cer and GB2-i2EYFP pair exhibited a FRET change that was more than 10%. From left to right: GB1a-i1Cer and GB2-i1EYFP (n = 5), GB1a-i2Cer and GB2-i2EYFP (n = 5), and GB1a-i3Cer and GB2-i3EYFP (n = 4).
FIGURE 2.
FRET between the GB1a and GB2 intracellular loops with diagonal relationships. A, left, the GB1a-i2Cer and GB2-i1EYFP pair displayed a FRET decrease by applying baclofen. Application profile was the same as in Fig. 1. Middle, plots are means ± S.E. (n = 5). Right, schematic drawing of the GB1a-i2Cer and GB2-i1EYFP pair. B, bar graphs summarizing FRET changes in Δ(nF/Cerulean) (%) (where nF is net FRET). Among the six possible combinations, only the GB1a-i2Cer and GB2-i1EYFP pair exhibited a FRET change that was more than 10%. From left to right: GB1a-i1Cer and GB2-i2EYFP (n = 5), GB1a-i1Cer and GB2-i3EYFP (n = 5), GB1a-i2Cer and GB2-i1EYFP (n = 5), GB1a-i2Cer and GB2-i3EYFP (n = 5), GB1a-i3Cer and GB2-i1EYFP (n = 3), and GB1a-i3Cer and GB2-i2EYFP (n = 5).
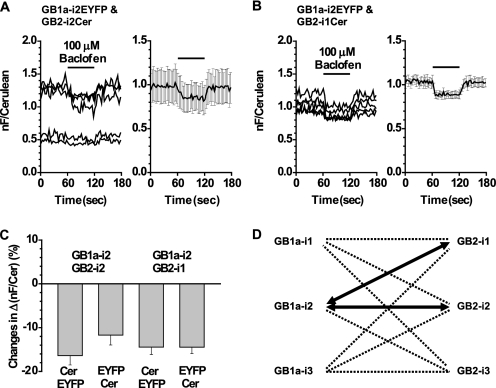
Next, fluorophores in the FRET pairs were swapped. Among these new pairs, GB1a-i2EYFP and GB2-i2Cer and GB1a-i2EYFP and GB2-i1Cer resulted in large FRET decreases upon the baclofen application (Fig. 3, A and B). When normalized, averages of these decreases were similar or almost identical to their Cerulean and EYFP counterparts (GB1a-i2EYFP and GB2-i2Cer, −11.7 ± 2.3%, n = 5; GB1a-i2EYFP and GB2-i1Cer, −14.5 ± 1.5%, n = 5; Fig. 3C). As for combinations other than GB1a-i2 and GB2-i1/GB2-i2, when fluorophores were swapped, they could not reproduce the FRET changes or resulted in FRET changes in opposite directions, suggesting that the FRET changes were not correlated with ligand-induced conformational changes. Thus, hereafter only GB1a-i2 and GB2-i1/GB2-i2 will be focused on as the reliable pairs. The FRET decreases from two positive pairs, when examined at the level of raw traces, exhibited synchronized positive-going Cerulean and negative-going FRET fluorescence intensities (supplemental data 3). These counteractions further guarantee that the FRET decreases observed were not due to the fluctuation of fluorescence intensities during the baclofen application. A summary of all the results from the combinations tested above reveals an asymmetrical relationship between GB1a and GB2 intracellular loops with respect to FRET pairs, which displayed apparent baclofen-induced changes (Fig. 3D, thick arrows).
FIGURE 3.
Swapping fluorescent proteins in the two positive pairs displayed FRET decreases with similar amounts. A, left, FRET changes (nF/Cerulean, where nF is net FRET) from the GB1a-i2EYFP and GB2-i2Cer pair. Application profile was the same as in Fig. 1. Right, plots of mean ± S.E. (n = 5). B, left, FRET changes from the GB1a-i2EYFP and GB2-i1Cer pair. Right, plots of mean ± S.E. (n = 5). C, bar graphs representing the normalized FRET decreases (%) from the four pairs. D, intersubunit FRET revealed an asymmetric movement between the intracellular loops of GB1a and GB2. Loops connected by thick arrows represent the two positive pairs.
The binding properties of wild-type GABABR and three different intersubunit FRET pairs were then determined using radiolabeled GABABR antagonist [3H]CGP54626 (Table 1). As a result, the three intersubunit FRET pairs exhibited Kd values similar to that of the wild-type receptor. Although smaller FRET change was observed from GB1a-i3 and GB2-i3 (Fig. 1), this cannot be ascribed to a reduced binding because it displayed a comparable Kd value to that of the wild-type receptor. Moreover, as the Kd value of GB1a-i1 and GB2-i2 is smaller than that of GB1a-i2 and GB2-i1, the smaller FRET change observed from the former pair compared with that of the latter (Fig. 2) was not due to poor binding property. This finding further supports the idea that asymmetric FRET changes between the GB1a and GB2 loop constructs reflect asymmetric rearrangement between them.
TABLE 1.
Ligand binding properties of wild type GABABR and three combinations of intersubunit FRET pairs
Kd and Bmax values for each combination were derived from the saturation binding assay for radiolabeled antagonist [3H]CGP54626 as described under “Experimental Procedures.” The values are means ± S.E. of three separate assays.
| Kd | Bmax | |
|---|---|---|
| nm | pmol/mg | |
| Wild type | 20.4 ± 3.7 | 1.80 ± 0.23 |
| GB1a-i2 and GB2-i1 | 69.8 ± 11.1 | 1.66 ± 0.05 |
| GB1a-i1 and GB2-i2 | 28.7 ± 10.3 | 0.281 ± 0.108 |
| GB1a-i3 and GB2-i3 | 16.2 ± 2.2 | 1.08 ± 0.10 |
Characterization of the i2 and i2 and the i2 and i1 FRET Pairs
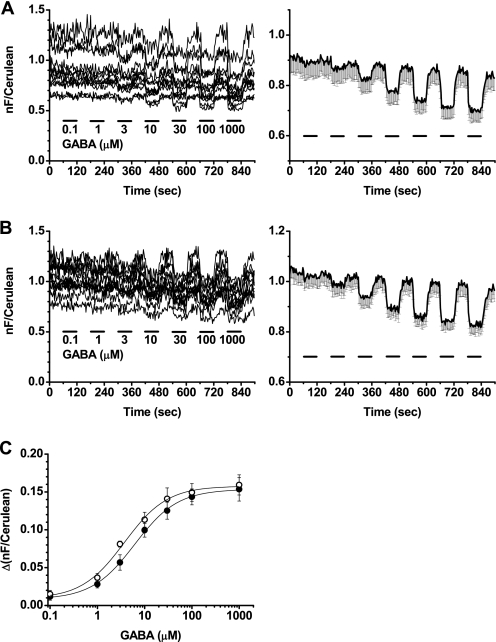
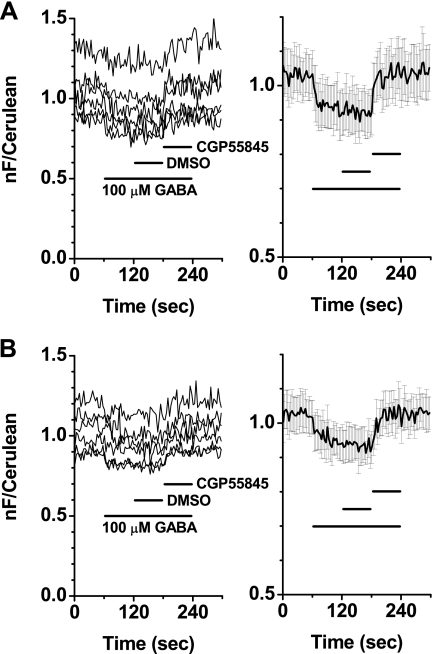
To further characterize the responses from the GB1a-i2 and GB2-i2 and the GB1a-i2 and GB2-i1 FRET pairs, various concentrations of GABA were applied to the cells expressing the above combinations, and their concentration-FRET response curves were obtained. The amounts of responses gradually increased in a stepwise manner in both FRET pairs in accordance with the elevated concentrations of GABA applied (Fig. 4, A and B). The EC50 values were 6.2 ± 0.4 μm (n = 12) for the GB1a-i2 and GB2-i2 pair and 3.7 ± 0.6 μm (n = 12) for the GB1a-i2 and GB2-i1 pair (Fig. 4C), similar to those reported in the in vitro functional analysis of the GABAB receptor (26, 27). To validate that agonist-induced FRET decreases seen in the two intersubunit FRET pairs are specifically triggered by agonist binding, the inhibitory effects of a GABABR antagonist CGP55845 were examined. FRET decreases evoked by 100 μm GABA were blocked by the additional application of 5 μm antagonist in the GB1a-i2 and GB2-i2 pair (Fig. 5A, n = 6) and the GB1a-i2 and GB2-i1 pair (Fig. 5B, n = 6), indicating a competitive antagonism of CGP55845 over GABA.
FIGURE 4.
Concentration-response curves obtained from FRET changes of the GB1a-i2 and GB2-i2 and the GB1a-i2 and GB2-i1 pairs. A, GB1a-i2Cer and GB2-i2EYFP pair. Left, individual FRET traces upon incrementally elevated GABA applications (from 0.1 to 1000 μm). GABA was applied for 60 s and washed for 60 s each time. Right, plots of mean with only minus component of S.E. for easy recognition (n = 12). B, GB1a-i2Cer and GB2-i1EYFP pair. Left, individual FRET traces upon incrementally elevated GABA applications as in A. Right, plots of mean with only minus component of S.E. (n = 12). C, concentration-response curves derived from the individual traces. Filled circles, GB1a-i2Cer and GB2-i2EYFP pair, EC50 = 6.2 ± 0.4 μm; open circles, GB1a-i2Cer and GB2-i1EYFP pair, EC50 = 3.7 ± 0.6 μm. nF, net FRET.
FIGURE 5.
FRET changes of the GB1a-i2 and GB2-i2 and the GB1a-i2 and GB2-i1 pairs were blocked by the GABAB receptor antagonist CGP55845. A, blockade of FRET decreases in the GB1a-i2EYFP and GB2-i2Cer. Left, individual traces; right, plots of mean ± S.E. (n = 6). B, blockade of FRET decreases in the GB1a-i2EYFP and GB2-i1Cer. Left, individual traces; right, plots of mean ± S.E. (n = 6). 100 μm GABA was applied for 180 s (long black bar). DMSO as a vehicle was added for 60 s (short black bar), followed by 5 μm CGP55845 with the same duration (short black bar). nF, net FRET.
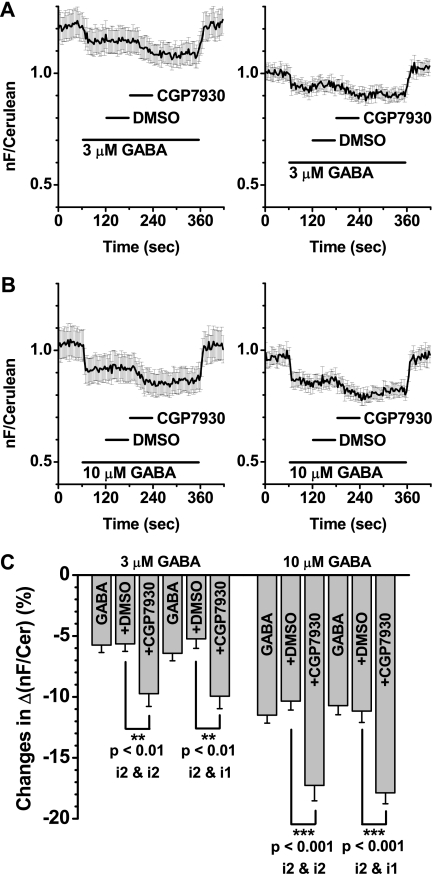
For the GABAB receptor, CGP7930, a positive allosteric modulator (PAM), is known and has been widely used in GABABR research (28–30). Generally, PAM acts on a receptor by binding to a site other than a primary agonist-binding site (orthosteric site). After binding to this secondary site, referred to as an allosteric site, PAM modulates the effect initially induced by an original agonist. Here, CGP7930 was tested for the FRET studies to confirm whether or not the agonist-induced FRET decreases can be further modulated. For both pairs, after the FRET decreases were achieved by 3 μm GABA, coapplication of 100 μm CGP7930 resulted in a further potentiation of the initial decreases (Fig. 6A, left, GB1a-i2 and GB2-i2, n = 12; right, GB1a-i2 and GB2-i1, n = 10). The similar tendency was observed when 10 μm GABA was used (Fig. 6B, left, GB1a-i2 and GB2-i2, n = 10; right, GB1a-i2 and GB2-i1, n = 10). Summarization indicates significant effects of the PAM (Fig. 6C, at 3 μm GABA, from −5.7 ± 0.6% to −9.7 ± 1.1% and from −5.2 ± 0.8% to −10.0 ± 1.0%; at 10 μm GABA, from −10.3 ± 0.7% to −17.3 ± 1.3% and from −11.2 ± 0.9% to −17.9 ± 0.9%).
FIGURE 6.
Positive allosteric modulator CGP7930 potentiated the FRET decreases from the GB1a-i2 and GB2-i2 and the GB1a-i2 and GB2-i1 pairs. A, FRET responses of the GB1a-i2EYFP and GB2-i2Cer pair (left, plots of mean ± S.E., n = 12) and GB1a-i2EYFP and GB2-i1Cer pair (right, plots of mean ± S.E., n = 10) evoked by 3 μm GABA. GABA was applied for 300 s (long black bar). Within this period, DMSO was added as a vehicle for 60 s (short black bar), followed by 100 μm CGP7930 for 60 s (short black bar). Note the FRET decreases first evoked by GABA were further enhanced by CGP7930. B, FRET responses of the GB1a-i2EYFP and GB2-i2Cer pair (left, plots of mean ± S.E., n = 10) and GB1a-i2EYFP and GB2-i1Cer pair (right, plots of mean ± S.E., n = 10) evoked by 10 μm GABA. Application profiles are the same as those in A. C, summary of FRET changes shown in A and B. The y axis represents changes in Δ(nF/Cerulean). Bars represent the normalized FRET decreases by 3 or 10 μm GABA only, + DMSO, and + 100 μm CGP7930 applications. nF, net FRET.
However, when a saturated concentration of GABA was used, CGP7930 showed differential effects. After the FRET response was evoked by 100 μm GABA, CGP7930 coapplication resulted in a clear potentiation of the initial decrease in the GB1a-i2 and GB2-i2 pair (supplemental data 4A) but not clearly in the GB1a-i2 and GB2-i1 pair (supplemental data 4B). A comparison of normalized FRET decreases from the GB1a-i2 and GB2-i2 and the GB1a-i2 and GB2-i1 pairs revealed that CGP7930 potentiated the former pair only (former, from −19.3 ± 1.4% to −26.0 ± 1.6%, n = 10; latter, from −15.5 ± 0.9% to −17.2 ± 1.5%, n = 9; supplemental data 4C). Although there is a report showing that CGP7930 alone could induce the GABABR activation (30), in our experimental system, the PAM itself did not evoke FRET changes from either the GB1a-i2 and GB2-i2 or the GB1a-i2 and GB2-i1 pair (supplemental data 5A). The action of CGP7930 was specific to GABABR, as there was no response from mGluR1α-i2Cer and mGluR1α-i2EYFP pair (supplemental data 5B).
Of outstanding interest, two groups independently have reported a GABABR composed of two chimeras GB1a/GB2 and GB2/GB1a (24, 25). These chimeras, possessing joints at the boundary region between VFTM and 7TMD, form a “chimeric heterodimer” and surprisingly function normally as does the wild-type receptor. Here, whether intersubunit FRET constructs with chimeric configurations are functional or not was tested using constructs having joints reported by Galvez et al. (24). The GB1a/GB2-i2Cer and GB2/GB1a-i2EYFP pair had normal membrane expression property and demonstrated a FRET decrease by 100 μm GABA (supplemental data 6; −11.6 ± 0.8%, n = 10), the same as what has been shown for the GB1a-i2Cer and GB2-i2EYFP pair. However, FRET measurement was not possible from the other pair GB1a/GB2-i2Cer and GB2/GB1a-i1EYFP because of its poor membrane trafficking.
Intrasubunit FRET
As the next step, structural changes within each GABABR subunit upon ligand application were investigated. In particular, as the subunit GB2 is thought to be directly coupled with the Gi/o protein at its intracellular domain, structural changes during its activation could be expected. Indeed, when the intrasubunit FRET pair was introduced in family A (α2A adrenergic receptor) and family B (parathyroid hormone receptor) GPCRs, by inserting cyan fluorescent protein at the third intracellular loop and attaching EYFP at the C terminus of the same molecule, both intrasubunit constructs successfully reported FRET decreases upon application of their ligands (14). The fluorophore configuration adopted in this study was based on the current hypothesis for the family A GPCR that the cytoplasmic part of helix VI moves away from the bundle of other helices in the receptor (31). Inspired with the above activation model, GB2 intrasubunit FRET constructs bearing EYFP at one of the intracellular loops and Ceruleans attached at the C terminus were designed.
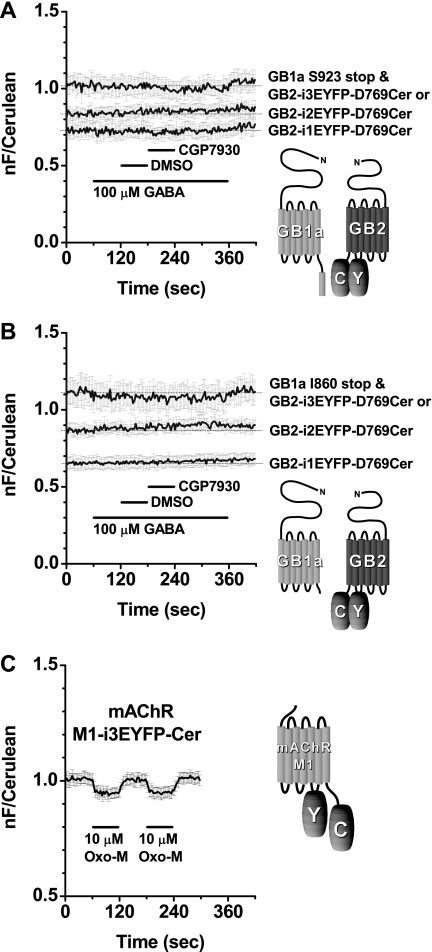
First, a series of GB2 constructs commonly possessing Cerulean at the C terminus were made. The donor was fused by complete deletion of the coiled-coil domains because preliminary constructs with the intact domains exhibited very low basal FRET levels, making the detection of conformational changes difficult. These constructs, GB2-i1EYFP-D769Cer, GB2-i2EYFP-D769Cer, and GB2-i3EYFP-D769Cer, were coexpressed with GB1a Ser923 stop mutant (C terminus, including the retention signal, is deleted, but the coiled-coil domain is intact) to ensure correct membrane targeting of the GB1a subunit (Fig. 7A). All combinations showed substantially high basal FRET levels, indicating that the distances between the fluorophores were short enough, and the pairs were ready to detect FRET changes. Nevertheless, there were no responses upon ligand applications, except GB1a Ser923 stop mutant and GB2-i3EYFP-D769Cer showed a subtle decrease of −2.1 ± 0.8% (n = 7) by GABA coapplied with CGP7930 (Fig. 7A). Next, as the second series, GB2 constructs were coexpressed with GB1a Ile860 stop mutant whose C terminus, including the coiled-coil domain, is deleted (Fig. 7B). These combinations also showed considerably high basal FRET levels. Nonetheless, they did not respond to ligands, except that GB1a Ile860 stop and GB2-i3EYFP-D769Cer showed a subtle decrease of −1.6 ± 1.0% (n = 4) during the GABA application (Fig. 7B).
FIGURE 7.
GB2 intrasubunit FRET. A, three types of GB2, having Cerulean fixed at Asp769 and EYFP at one of different intracellular loops, paired with GB1a Ser923 stop mutant. No sign of response to GABA or when the agonist was coapplied with CGP7930. Plots of mean ± S.E. of individual recordings from GB1a Ser923 stop and GB2-i1EYFP-D769Cer (n = 8), GB2-i2EYFP-D769Cer (n = 7), or GB2-i3EYFP-D769Cer (n = 7) are shown. Application profile was the same as in Fig. 6. Hereafter, thin horizontal lines indicate the initial base-line levels. Schematic drawing of GB1a Ser923 stop and GB2-i3EYFP-D769Cer is shown on the right as a representative. B, three types of GB2, the same as shown in A, were paired with GB1a Ile860 stop mutant. No sign of response to GABA or when the agonist coapplied with CGP7930 except GB2-i3EYFP-D769Cer showing a subtle decrease while GABA was applied. Plots of mean ± S.E. of individual recordings from GB1a Ile860 stop and GB2-i1EYFP-D769Cer (n = 6) or GB2-i2EYFP-D769Cer (n = 4) or GB2-i3EYFP-D769Cer (n = 4) are shown. Application profile was the same as in Fig. 6. Schematic drawing of GB1a Ile860 stop and GB2-i3EYFP-D769Cer is shown on the right as a representative. C, mAChR M1 construct for detection of intrasubunit structural change exhibited agonist-induced FRET decrease. Left, plots of mean ± S.E., of individual FRET traces from M1-i3EYFP-Cer (n = 5). 10 μm oxotremorine M was applied for 60 s, washed for 60 s, and repeated again for checking the reproducibility. Right, schematic drawing of the M1 construct. nF, net FRET.
Given that none of the GB2 intrasubunit FRET constructs displayed notable responses during ligand applications, as a next step, GB1a intrasubunit FRET constructs were made. These pairs, GB1a-i1EYFP-T872Cer, GB1a-i2EYFP-T872Cer, and GB1a-i3EYFP-T872Cer, have Cerulean at the proximal C terminus by a complete deletion of the coiled-coil domain (supplemental data 7, A and B). However, when paired with GB2 wild-type, none of these combinations demonstrated a clear FRET change upon ligand application (supplemental data 7A). The situation was almost identical when the same intrasubunit pairs were coexpressed with GB2 Thr749 stop mutant lacking the coiled-coil domain (supplemental data 7B).
After encountering the subtle or no FRET changes from the GABABR intrasubunit pairs, positive control constructs were made to confirm the validity of intrasubunit FRET methodology. M1 subunit of mAChR, a member of family A GPCR, was chosen as a backbone molecule. When an intrasubunit FRET pair was introduced into mAChR M1 by an insertion of EYFP at the third intracellular loop and attachment of Cerulean at the C terminus, the construct clearly showed an agonist-induced FRET decrease upon an application of 10 μm oxotremorine M (−6.1 ± 0.6%, n = 5, Fig. 7C and supplemental data 8B). This was reproducible when the positions of fluorophores were swapped (−7.2 ± 0.7%, n = 8, supplemental data 8). These results demonstrate that the experimental system for intrasubunit FRET does work in our hands.
DISCUSSION
Intersubunit FRET Reveals an Asymmetrical Movement between GB1a and GB2 upon Agonist-induced Application
Intersubunit FRET observed in this study reports the changes in the distance and/or in the angle between the two fluorophores attached at the intracellular loops of GB1a and GB2. The simplest interpretation is that the intracellular loops of GB1a and GB2 move apart during the GABABR activation (Fig. 3D). This is in contrast to the previous study on the mGluR1α from our group revealing two directions of movements as follows: the i2 and i2 pair come closer (FRET increase) and the i1 and i1 pair move apart (FRET decrease) (19). Furthermore, the dissociating movement of the intracellular domains of the GABABR appears asymmetric, as the i2 and i1 pair displayed a large FRET decrease, and the i1 and i2 pair resulted in only a subtle decrease (Fig. 2B), highlighting that the activation of GABABR is qualitatively different from that of mGluR1α.
The reliability of FRET decreases observed from two intersubunit pairs is supported by the following points. (a) The FRET decreases were reproducible after swapping the fluorophores, i.e. from the Cerulean and EYFP pairs to the EYFP and Cerulean pairs (Fig. 3, A and B). (b) Both FRET pairs exhibited counteraction, a synchronized positively going Cerulean fluorescence trace and negatively going FRET trace (supplemental data 3). (c) The EC50 values derived from concentration-response curves were 6.2 and 3.7 μm (Fig. 4), in the same range as those reported in previous functional studies of the GABABR expressed in vitro (26, 27). (d) FRET decreases were blocked by the antagonist CGP55845 (Fig. 5). (e) When CGP7930, PAM of the GABABR, was coapplied with GABA at low concentrations, the FRET decrease was potentiated in the both pairs (Fig. 6). Therefore, it was concluded that FRET changes observed in this study faithfully captured the ligand-induced activation of the receptor, and these are not derived from other nonspecific events.
Although the PAM CGP7930 further potentiated the FRET decrease evoked by GABA (Fig. 6), it did not induce any FRET change by itself (supplemental data 5A). As CGP7930 is acting on the GABABR even after it is almost fully activated by 100 μm GABA (supplemental data 4A), this cannot be attributed to just a simple shift in the equilibrium. Rather, a distinctive additive mechanism should be considered. This mechanism can be speculated as follows. (a) The binding of agonist onto the GB1a causes a closure of the GB1a VFTM. (b) Closure of the GB1a VFTM then (probably together with the GB2 VFTM) forces the intracellular domains of both subunits to move apart. (c) as a consequence, this movement makes a cleft between the 7TMDs of both subunits and/or a cleft between the VFTM and 7TMD of GB2. (d) Finally, CGP7930 binds into cleft(s) and further makes the distance between the subunits longer, which in turn reflected in the enhanced FRET decrease. The reason why CGP7930 alone did not cause any FRET changes is probably because the PAM cannot make the cleft(s) in the step c by itself.
Intrasubunit FRET Suggests That GABABR Activation Does Not Involve Notable Structural Changes within Each Subunit
As can be seen in Fig. 7, there were no responses from any of the GB2 intrasubunit FRET pairs upon applications of GABA, GABA with the positive allosteric modulator CGP7930, except GB2-i3EYFP-D769Cer coexpressed with GB1a Ser923 stop (Fig. 7A) or GB1a Ile860 stop (Fig. 7B) showing subtle FRET decreases by the agonist coapplied with PAM or only the agonist, respectively. Similarly, as shown in supplemental data 7, there were no notable responses from any of the GB1a intrasubunit FRET pairs when GABA and GABA with CGP7930 were applied. However, the positive control constructs, whose backbone molecule is family A mAChR M1, did exhibit clear FRET decreases upon agonist application (Fig. 7C and supplemental data 8). Therefore, the reason why changes were not clearly observed from GB1a and GB2 intrasubunit FRET pairs cannot be ascribed to experimental configuration. Rather, the absence of major changes suggests that both GB1a and GB2 subunits have more rigid structures compared with that of mAChR M1. This conclusion for the GABABR is consistent with our previous study in which the absence of intrasubunit FRET changes within mGluR1α were demonstrated (19).
However, we do not intend to exclude a possibility that the subunit rearrangements upon the activation of family C GPCRs may accompany minor conformational changes at the subunit helical domains. It should be noted that the FRET approach cannot efficiently capture the distance changes between chromophores at extremely proximal positions. Subtle FRET changes observed at the intrasubunit level might reflect small but meaningful helical conformational changes. Indeed, characterization of the mGluR8 constitutively active mutants concluded that the receptor activation involves dissociative movements of the helices II and IV (32) and the helices III and V (33). Moreover, a functional study of GABABR using point mutants demonstrates the importance of ionic network formed between three charged residues in the helices III and VI of GB2, which is reminiscent of a similar motif in family A GPCRs (34). Switching events of such ionic lock at the GB2 helical domain may underlie the subtle changes observed from GB2 intrasubunit pairs (Fig. 7, A and B).
Throughout the characterization of GB2 intrasubunit FRET constructs, CGP7930 did not show any notable actions (Fig. 7, A and B). These are unexpected findings because by knowing that CGP7930 is roughly characterized to bind the GB2 7TMD, it is natural to assume that the subunit undergoes conformational changes. Similar to what CGP7930 does, it is known that mAChR M1 agonist binds into the 7TMD of this receptor (35). Despite the common property shared by the two ligands, only oxotremorine M efficiently induced FRET changes (Fig. 7C and supplemental data 8). This may suggest a distinctive mechanism difference between family A and C GPCRs; family A receptor is potentially ready for helical conformational changes in the subunit after the ligand binding; as for family C receptor, the bound ligand does not evoke helical conformational changes, rather the action favors and directs toward events at the intersubunit level.
Possible Activation Model for the GABABR
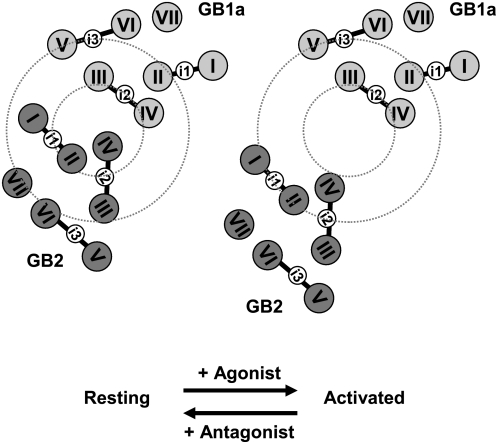
The intersubunit FRET in this study revealed an asymmetrical dissociation between GB1a and GB2 intracellular loops by agonist-induced activation (Fig. 3D). This finding can be interpreted in two ways: (a) GB1a and GB2 subunits initially being associated (GB1a-i2 and GB2-i1/GB2-i2 as an interface) move apart upon activation or (b) the overall configuration of GB1a and GB2 complex is stationary, and only a local domain consisting of the i2 and i2 and the i2 and i1 loops undergo conformational change upon activation, whereas other domains, including GB1a-i1, -i3 and GB2-i3, are kept rigidly fixed. Given that the validity of intrasubunit FRET methodology has been confirmed by the positive control pairs (Fig. 7C and supplemental data 8), the results of both GB2 and GB1a intrasubunit studies collectively suggest that dramatic structural changes would not occur within the each subunit (Fig. 7, A and B, and supplemental data 7). Hence, the second interpretation mentioned above is unlikely, and the first one, which is based on the rearrangement of the two subunits GB1a and GB2 on the membrane, should be adopted in our model. Here, we propose the activation scheme of the GABABR as in Fig. 8. In Fig. 8, the 7TMD configuration is based on the cytoplasmic view of the published rhodopsin crystal structure (7). The subtle or no changes in intrasubunit FRET data are represented by fixed helical configuration of GB1a and GB2, whereas the asymmetrical intersubunit FRET decreases are shown by rearrangement of the two subunits, in which GB1a-i2 and GB2-i1/GB2-i2 form an interface.
FIGURE 8.
Scheme for the agonist-induced activation of the GABABR. A scheme representing the asymmetrical rearrangement of the subunits GB1a and GB2 upon agonist-induced activation. The 7TMD configuration is based on the cytoplasmic view of the rhodopsin crystal structure. Note that the activation involves dissociation of the two subunits, but the helical configuration of each subunit is kept unchanged. A small dotted circle denotes a region where the loops involved in large FRET decreases are positioned at the resting state. A large dotted circle demarcates a region where the nonresponding loops are placed at the resting state.
The result from the GABABR chimera is in line with the above activation model. The chimeric heterodimer GB1a/GB2-i2Cer and GB2/GB1a-i2EYFP exhibited a FRET decrease by agonist (supplemental data 6), mimicking the behavior of original GB1a-i2Cer and GB2-i2EYFP pair. This means that strict continuities between GB1a VFTM and GB1a 7TMD and GB2 VFTM and GB2 7TMD are not prerequisites for the normal receptor activation because in the chimera the continuities are obviously disrupted. The result implies that, rather than signal transmission involving conformational changes at the helical domain of each subunit, the receptor activation favors intersubunit events depending on the close association of GB1a and GB2 VFTMs. Indeed, preceding studies have shown the tight physical coupling between the two VFTMs, even proving it does exist in the absence of their helical domains (36, 37).
In summary, the intersubunit FRET in this study revealed an asymmetrical dissociation between GB1a and GB2 intracellular loops upon agonist-induced activation. However, the intrasubunit FRET data suggest that the receptor activation does not involve apparent structural changes within each subunit. By combining the results obtained from two different levels, it was concluded that the GABABR activation by agonist is associated with an asymmetrical rearrangement of the two subunits GB1a and GB2 on the membrane. Moreover, this type of activation mode, an intersubunit rearrangement without apparent intrahelical structural changes, appears commonly shared by the mGluR1α and the GABABR, although the observed asymmetry highlights the qualitative difference between them.
Supplementary Material
Acknowledgments
We are grateful to Dr. Lily Yeh Jan (University of California, San Francisco) for cDNAs encoding rat GB1a and GB2 and Dr. Tai Kubo (Neuroscience Research Institute, AIST, Tsukuba, Japan) for porcine mAChR M1 cDNA. We thank Tomomi Yamamoto and Yuriko Asai for technical assistance.
This work was supported in part by research grants from the Ministry of Education, Culture, Sports, Science and Technology of Japan (to M. T. and Y. K.) and from the Japan Society for the Promotion of Science (to Y. K.).

The on-line version of this article (available at http://www.jbc.org) contains supplemental “Experimental Procedures” and data 1–8.
- GPCR
- G-protein-coupled receptor
- GABABR
- γ-aminobutyric acid type B receptor
- EYFP
- enhanced yellow fluorescent protein
- FRET
- fluorescence resonance energy transfer
- 7TMD
- seven-transmembrane domain
- mAChR
- muscarinic acetylcholine receptor
- mGluR
- metabotropic glutamate receptor
- VFTM
- venus flytrap module
- PAM
- a positive allosteric modulator.
REFERENCES
- 1.Bockaert J., Pin J. P. (1999) EMBO J. 18, 1723–1729 [DOI] [PMC free article] [PubMed] [Google Scholar]
- 2.Pin J. P., Galvez T., Prézeau L. (2003) Pharmacol. Ther. 98, 325–354 [DOI] [PubMed] [Google Scholar]
- 3.Gether U., Asmar F., Meinild A. K., Rasmussen S. G. (2002) Pharmacol. Toxicol. 91, 304–312 [DOI] [PubMed] [Google Scholar]
- 4.Schwartz T. W., Frimurer T. M., Holst B., Rosenkilde M. M., Elling C. E. (2006) Annu. Rev. Pharmacol. Toxicol. 46, 481–519 [DOI] [PubMed] [Google Scholar]
- 5.Wess J., Han S. J., Kim S. K., Jacobson K. A., Li J. H. (2008) Trends Pharmacol. Sci. 29, 616–625 [DOI] [PMC free article] [PubMed] [Google Scholar]
- 6.Nygaard R., Frimurer T. M., Holst B., Rosenkilde M. M., Schwartz T. W. (2009) Trends Pharmacol. Sci. 30, 249–259 [DOI] [PubMed] [Google Scholar]
- 7.Palczewski K., Kumasaka T., Hori T., Behnke C. A., Motoshima H., Fox B. A., Le Trong I., Teller D. C., Okada T., Stenkamp R. E., Yamamoto M., Miyano M. (2000) Science 289, 739–745 [DOI] [PubMed] [Google Scholar]
- 8.Rasmussen S. G., Choi H. J., Rosenbaum D. M., Kobilka T. S., Thian F. S., Edwards P. C., Burghammer M., Ratnala V. R., Sanishvili R., Fischetti R. F., Schertler G. F., Weis W. I., Kobilka B. K. (2007) Nature 450, 383–387 [DOI] [PubMed] [Google Scholar]
- 9.Warne T., Serrano-Vega M. J., Baker J. G., Moukhametzianov R., Edwards P. C., Henderson R., Leslie A. G., Tate C. G., Schertler G. F. (2008) Nature 454, 486–491 [DOI] [PMC free article] [PubMed] [Google Scholar]
- 10.Jaakola V. P., Griffith M. T., Hanson M. A., Cherezov V., Chien E. Y., Lane J. R., Ijzerman A. P., Stevens R. C. (2008) Science 322, 1211–1217 [DOI] [PMC free article] [PubMed] [Google Scholar]
- 11.Kunishima N., Shimada Y., Tsuji Y., Sato T., Yamamoto M., Kumasaka T., Nakanishi S., Jingami H., Morikawa K. (2000) Nature 407, 971–977 [DOI] [PubMed] [Google Scholar]
- 12.Tsuchiya D., Kunishima N., Kamiya N., Jingami H., Morikawa K. (2002) Proc. Natl. Acad. Sci. U.S.A. 99, 2660–2665 [DOI] [PMC free article] [PubMed] [Google Scholar]
- 13.Muto T., Tsuchiya D., Morikawa K., Jingami H. (2007) Proc. Natl. Acad. Sci. U.S.A. 104, 3759–3764 [DOI] [PMC free article] [PubMed] [Google Scholar]
- 14.Vilardaga J. P., Bünemann M., Krasel C., Castro M., Lohse M. J. (2003) Nat. Biotechnol. 21, 807–812 [DOI] [PubMed] [Google Scholar]
- 15.Hoffmann C., Gaietta G., Bünemann M., Adams S. R., Oberdorff-Maass S., Behr B., Vilardaga J. P., Tsien R. Y., Ellisman M. H., Lohse M. J. (2005) Nat. Methods 2, 171–176 [DOI] [PubMed] [Google Scholar]
- 16.Jensen J. B., Lyssand J. S., Hague C., Hille B. (2009) J. Gen. Physiol. 133, 347–359 [DOI] [PMC free article] [PubMed] [Google Scholar]
- 17.Hoffmann C., Zürn A., Bünemann M., Lohse M. J. (2008) Br. J. Pharmacol. 153, S358–S366 [DOI] [PMC free article] [PubMed] [Google Scholar]
- 18.Lohse M. J., Nikolaev V. O., Hein P., Hoffmann C., Vilardaga J. P., Bünemann M. (2008) Trends Pharmacol. Sci. 29, 159–165 [DOI] [PubMed] [Google Scholar]
- 19.Tateyama M., Abe H., Nakata H., Saito O., Kubo Y. (2004) Nat. Struct. Mol. Biol. 11, 637–642 [DOI] [PubMed] [Google Scholar]
- 20.Parmentier M. L., Prézeau L., Bockaert J., Pin J. P. (2002) Trends Pharmacol. Sci. 23, 268–274 [DOI] [PubMed] [Google Scholar]
- 21.Pin J. P., Kniazeff J., Binet V., Liu J., Maurel D., Galvez T., Duthey B., Havlickova M., Blahos J., Prézeau L., Rondard P. (2004) Biochem. Pharmacol. 68, 1565–1572 [DOI] [PubMed] [Google Scholar]
- 22.Pin J. P., Kniazeff J., Liu J., Binet V., Goudet C., Rondard P., Prézeau L. (2005) FEBS J. 272, 2947–2955 [DOI] [PubMed] [Google Scholar]
- 23.Rizzo M. A., Springer G. H., Granada B., Piston D. W. (2004) Nat. Biotechnol. 22, 445–449 [DOI] [PubMed] [Google Scholar]
- 24.Galvez T., Duthey B., Kniazeff J., Blahos J., Rovelli G., Bettler B., Prézeau L., Pin J. P. (2001) EMBO J. 20, 2152–2159 [DOI] [PMC free article] [PubMed] [Google Scholar]
- 25.Margeta-Mitrovic M., Jan Y. N., Jan L. Y. (2001) Proc. Natl. Acad. Sci. U.S.A. 98, 14643–14648 [DOI] [PMC free article] [PubMed] [Google Scholar]
- 26.Galvez T., Urwyler S., Prézeau L., Mosbacher J., Joly C., Malitschek B., Heid J., Brabet I., Froestl W., Bettler B., Kaupmann K., Pin J. P. (2000) Mol. Pharmacol. 57, 419–426 [DOI] [PubMed] [Google Scholar]
- 27.Bräuner-Osborne H., Krogsgaard-Larsen P. (1999) Br. J. Pharmacol. 128, 1370–1374 [DOI] [PMC free article] [PubMed] [Google Scholar]
- 28.Urwyler S., Mosbacher J., Lingenhoehl K., Heid J., Hofstetter K., Froestl W., Bettler B., Kaupmann K. (2001) Mol. Pharmacol. 60, 963–971 [PubMed] [Google Scholar]
- 29.Urwyler S., Gjoni T., Koljatiæ J., Dupuis D. S. (2005) Neuropharmacology 48, 343–353 [DOI] [PubMed] [Google Scholar]
- 30.Binet V., Brajon C., Le Corre L., Acher F., Pin J. P., Prézeau L. (2004) J. Biol. Chem. 279, 29085–29091 [DOI] [PMC free article] [PubMed] [Google Scholar]
- 31.Jensen A. D., Guarnieri F., Rasmussen S. G., Asmar F., Ballesteros J. A., Gether U. (2001) J. Biol. Chem. 276, 9279–9290 [DOI] [PubMed] [Google Scholar]
- 32.Yamashita T., Terakita A., Kai T., Shichida Y. (2008) J. Neurochem. 106, 850–859 [DOI] [PubMed] [Google Scholar]
- 33.Yanagawa M., Yamashita T., Shichida Y. (2009) Mol. Pharmacol. 76, 201–207 [DOI] [PubMed] [Google Scholar]
- 34.Binet V., Duthey B., Lecaillon J., Vol C., Quoyer J., Labesse G., Pin J. P., Prézeau L. (2007) J. Biol. Chem. 282, 12154–12163 [DOI] [PMC free article] [PubMed] [Google Scholar]
- 35.Lu Z. L., Saldanha J. W., Hulme E. C. (2002) Trends Pharmacol. Sci. 23, 140–146 [DOI] [PubMed] [Google Scholar]
- 36.Liu J., Maurel D., Etzol S., Brabet I., Ansanay H., Pin J. P., Rondard P. (2004) J. Biol. Chem. 279, 15824–15830 [DOI] [PubMed] [Google Scholar]
- 37.Nomura R., Suzuki Y., Kakizuka A., Jingami H. (2008) J. Biol. Chem. 283, 4665–4673 [DOI] [PubMed] [Google Scholar]
Associated Data
This section collects any data citations, data availability statements, or supplementary materials included in this article.


