Abstract
The interactions between the mitochondrial cytochrome bc1 complex and matrix-soluble proteins were studied by a precipitation pulldown technique. Purified, detergent-dispersed bc1 complex was incubated with mitochondrial matrix proteins followed by dialysis in the absence of detergent. The interacting protein(s) was co-precipitated with bc1 complex upon centrifugation. One of the matrix proteins pulled down by bc1 complex was identified as mitochondrial malate dehydrogenase (MDH) by matrix-assisted laser desorption ionization time-of-flight mass spectrometry and confirmed by Western blotting with anti-MDH antibody. Using a cross-linking technique, subunits I, II (core I and II), and V of the bc1 complex were identified as the interacting sites for MDH. Incubating purified MDH with the detergent dispersed bc1 complex results in an increase of the activities of both the bc1 complex and MDH. The effect of the bc1 complex on the activities of MDH is unidirectional (oxaloacetate → malate). These results suggest that the novel cross-talk between citric acid cycle enzymes and electron transfer chain complexes might play a regulatory role in mitochondrial bioenergetics.
Keywords: Dehydrogenase, Mass Spectrometry (MS), Mitochondria, Surface Plasmon Resonance (SPR), Tricarboxylic Acid (TCA) Cycle, Complex III, Cross-talk, Sulfo-SBED, bc1 Complex, Malate Dehydrogenase
Introduction
The mitochondrial cytochrome bc1 complex catalyzes electron transfer from ubiquinol to cytochrome c with the concomitant translocation of protons across the membrane to generate a proton gradient and membrane potential for ATP synthesis (1). Three-dimensional structures of mitochondrial bc1 complexes from various sources have become available in recent years (2–11). All mitochondrial cytochrome bc1 complexes contain three essential subunits that house four redox prosthetic groups and seven to eight non-redox prosthetic groups containing supernumerary subunits. The three essential subunits are: the cytochrome b subunit, housing two b-type hemes (bH and bL); the cytochrome c1 subunit, housing one c-type heme (c1); the Rieske iron-sulfur protein (ISP),2 housing a high potential [2Fe-2S] cluster.
Although the structural and functional studies of the mitochondrial bc1 complex have been intensive, few studies of the interactions between the bc1 complex and the soluble matrix enzymes have been available. Complex II (succinate-ubiquinone oxidoreductase) is the only enzyme that participates in both the citric acid cycle and the electron transport chain (12). Complex II is composed of a succinate dehydrogenase, which is a citric acid cycle enzyme, and a membrane-anchoring protein fraction, which houses ubiquinone. Complex II catalyzes the oxidation of succinate to fumarate and the reduction of ubiquinone to ubiquinol. Other enzymes of citric acid cycle are known to couple to the electron transfer chain through their product NADH at complex I (13). Structurally the mitochondrial bc1 complex can be divided into three regions: matrix, transmembrane, and the intermembrane space regions. The matrix region contains subunits I (core I), II (core II), VI, IX, and the N-terminal part of subunits V (ISP) and VII (2, 4). Although this region contains the major part of the complex mass, it possesses no redox centers; it is not directly involved in electron/proton transfer activity. The functions of subunits in this region, although mostly unknown, may contribute to a structural or regulatory role of the bc1 complex. Indeed, the recent structural studies of a supercomplex formed from complexes I and III indicate that the matrix part of complex III is required for its association with complex I (14). The matrix region of Complex III may also be important for stabilization of the complex itself as bc1 complexes without core proteins are generally less stable and have lower activity (15). If the interaction between the matrix enzymes and the bc1 complex exists, this region would be a good choice for the contact.
It also should be noted that core I and core II subunits of the bovine complex have mitochondrial processing peptidase-like activity (16, 17). The presequence peptide of ISP is cleaved by core I and core II. The cleaved presequence peptide is then bound to core I and core II as subunit IX during maturation of the complex and, thus, inhibits the mitochondrial processing peptidase activity. Because the binding of subunit IX inhibits the mitochondrial processing peptidase activity of core I and core II, these two core subunits act like a suicide peptidase.
In the present work we have observed an increase in bc1 activity when the bc1 complex was incubated with the mitochondrial-soluble matrix protein fraction, suggesting that an interaction between the electron transfer complex and the matrix enzymes exists. To confirm this suggestion, we developed a technique to pull down the interacting matrix proteins. This technique involves incubation of the purified, detergent-dispersed bc1 complex with the soluble matrix enzyme fraction followed by extensive dialysis and centrifugation to collect the precipitates that contain the matrix enzymes and the bc1 complex. One of the matrix enzymes pulled down with the bc1 complex has been identified as MDH. Herein we report the detailed procedures for pulling down the matrix enzymes that interact with the cytochrome bc1 complex and the identification of MDH as one of the matrix enzymes that interacts with bc1 complex. The effect of the interaction on the activities of the bc1 complex and MDH as well as the likely interacting domain was also investigated.
EXPERIMENTAL PROCEDURES
Chemicals
Cytochrome c (horse, type III), sodium cholate, deoxycholate, NADH, oxaloacetate (OAA), malate, NAD, and bovine MDH were purchased from Sigma. Cross-linker, Sulfo-SBED (sulfosuccinimidyl-2-[6-(biotinamido)-2-(p- azidobenzamido) hexanoamido]ethyl-1,3′-dithiopropionate) was purchased from Pierce. 2,3-Dimethoxy-5-methyl-6-(10-bromodecyl)-1,4-benzoquinol (Q0C10BrH2) was prepared as previously reported (18). Inhibitor chlorothricin was purchased from A.G. Scientific. Stigmatellin and antimycin A were purchased from Sigma. The concentrations of stigmatellin and antimycin A were determined spectrophotometrically using millimolar extinction coefficients of 65.5 and 4.8 cm−1 mm−1, respectively (19).
Cytochrome bc1 Complex Preparation and Activity Assay
Bovine heart mitochondrial cytochrome bc1 complex was prepared as previously reported (20, 21). The purified complex contained 9.3 nmol of cytochrome b and 4.9 nmol of cytochrome c1/mg of protein. It was dissolved in a TS buffer (50 mm Tris-HCl buffer, 0.66 m sucrose, pH 8.0) to a protein concentration of 22 mg/ml and frozen at −80 °C until use. The concentrations of cytochromes b and c1 were determined spectrophotometrically using millimolar extinction coefficients of 28.5 (22) and 17.5 cm−1 mm−1 (23), respectively.
For activity determination, the cytochrome bc1 complex was diluted with 50 mm phosphate buffer, pH 7.4, containing 1 mm EDTA and 0.01% potassium deoxycholate to a protein concentration of 0.022 mg/ml. Diluted protein solution (10 μl) was added to 990 μl of an assay mixture (100 mm phosphate buffer, pH 7.4, 1 mm EDTA, 1 mm KCN, 100 μm cytochrome c, and 25 μm Q0C10BrH2). Activity was determined by measuring the reduction of cytochrome c in a Shimadzu UV-2401PC spectrophotometer at 25 °C using a millimolar extinction coefficient of 18.5 cm−1 mm−1 (23) for calculation. The nonenzymatic oxidation of Q0C10BrH2 determined under the same conditions in the absence of the enzyme was subtracted from the assay. The bc1 complex used in these experiments had a specific activity of about 12 μmol of cytochrome c reduced/min/nmol of cytochrome b.
Preparation of Mitochondrial Matrix Proteins
Three pounds of fresh, fat, and connective tissue-free beef heart muscles were cut into small pieces and then homogenized with matrix protein buffer (20 mm HEPES, 10 mm KCl, 1.5 mm MgCl2, 1 mm EDTA, 1 mm EGTA, 1 mm dithiothreitol, 0.1 mm phenylmethylsulfonyl fluoride, 250 mm sucrose, pH 7.4) on ice. The homogenate was centrifuged at 600 × g for 10 min at 4 °C. The supernatant was collected and centrifuged at 8000 × g for 15 min at 4 °C. The supernatant and light-colored fluffy upper layer of precipitate were discarded. The dark red precipitate was collected, suspended in the 100 ml of matrix protein buffer, and centrifuged at 8000 × g for 15 min at 4 °C. The light-colored supernatant solutions were discarded, and the dark red precipitates were suspended in the 50-ml matrix protein buffer. The mitochondria were then broken with sonication for 5 min at 0 °C. The mixture was centrifuged at 100,000 × g for 2 h at 4 °C. The upper floating lipids and precipitates were discarded, and the supernatant solution was collected and subjected to centrifugation at 200,000 × g for 2 h at 4 °C. The supernatant (the matrix protein fraction) has a protein concentration of 7.5 mg/ml and was stored at −80 °C until use. Protein concentration was determined by the Bradford protein assay with crystalline bovine serum albumin as the standard.
The Pulldown Experiment
One mg of bc1 complex was incubated separately with 1 ml of 0.28, 0.83, and 2.50 mg/ml mitochondrial matrix extract on ice for 2 h. After incubation, the mixtures were dialyzed against 1 liter of the matrix protein buffer for 4 h with one change of buffer at 4 °C to remove the detergent used for dispersing the cytochrome bc1 complex. The dialyzed preparations were subjected to centrifugation at 100,000 × g for 1 h at 4 °C. The resulting precipitates were dissolved in the PES buffer (50 mm phosphate buffer, 1 mm EDTA, 0.5% sodium cholate, pH 7.4) and analyzed by SDS-PAGE. The matrix protein fraction and the cytochrome bc1 complex alone were subjected to identical dialysis and centrifugation conditions as those described and used as controls.
MDH Activity Assay
A conventional spectrophotometric method was used for MDH activity assays (malate + NAD+ ↔ oxaloacetate + NADH + H+) (24–26). The reversed reaction of MDH was assayed using 0.2 mm NADH and 0.2 mm OAA in a 50 mm phosphate buffer, pH 7.4. The forward reaction of MDH was assayed using 2 mm NAD and 2 mm malate in a 50 mm phosphate buffer, pH 7.4. The activity was determined by measuring the decrease or increase of NADH absorbance at 340 nm in a Shimadzu UV-2401PC spectrophotometer at 25 °C using a millimolar extinction coefficient of 6.22 cm−1 mm−1.
Mass Spectroscopy
Samples were run with SDS-PAGE first. The selected protein bands were sliced from the gel and washed with 50% acetonitrile, 25 mm ammonium bicarbonate, pH 8.0, 3 times for 40 min each. The washed gel slices were dehydrated by acetonitrile. In-gel digestion was carried out with 8 μg/ml freshly prepared trypsin in 50 mm of ammonium bicarbonate, pH 8.0, on ice for 0.5 h. The final sample was mixed with the light-absorbing compound (10 mg/ml α-cyano-4-hydroxycinnamic acid dissolved in 0.3 ml of 50% acetonitrile, 0.1% trifluoroacetic acid) and loaded on the MALDI plate to co-crystallize (dry). Data were collected from MALDI-TOF mass spectrometry (Voyager-DETM PRO Biospectrometry Work station), and the intensities within 10% of the main peak were set as noises and not shown with a peak marker. The monoisotopic masses of the first peaks of the main clusters were collected. The unknown protein was searched within mammalian proteins of MSDB data base with software Mascot Daemon using the tolerance of +100 ppm.
Surface Plasmon Resonance
SensíQ from ICX Nomadics is a dual-channel, semi-automated surface plasmon resonance system. 250 μl of MDH (100 μg/ml) were used to bind with channel 1 (channel 2 as control) in the COOH chip until it reached balance at 2000 response units. Various concentrations of bc1 complex in a dilution buffer (50 mm phosphate buffer, pH 7.5, containing 0.01% potassium deoxycholate) were injected through both channels 1 and 2. The sample dilution buffer was used as the flowing buffer over the chip all the time except for during the bc1 complex sample injection time. Data were analyzed by the software Qdat from the same surface plasmon resonance manufacture company.
Cross-linking
Sulfo-SBED is a trifunctional cross- linking reagent containing a biotin, a sulfonated N-hydroxysuccinimide (Sulfo-NHS) active ester, and a photoactivatable aryl azide. First, the amine-reactive Sulfo-NHS ester of Sulfo-SBED was created on the carboxyl-containing amino acids on the surface of MDH. After dialysis to remove the nonreacted Sulfo-NHS, labeled MDH was mixed with bc1. The mixture was illuminated with a long wave UV lamp (365 nm) at a distance of 5 cm for 15 min. The disulfide bond in the spacer arm originally attached to the Sulfo-NHS ester was cleaved by incubating it with 100 mm β-mercaptoethanol. The final biotin-labeled proteins were subjected to Western-blotting analysis.
Western Blotting
Western blotting was performed with biotin-labeled polyclonal rabbit antibodies against bovine mitochondrial MDH. The polypeptides separated by SDS-PAGE gel were transferred to a 45-μm nitrocellulose membrane for immunoblotting. Streptavidin conjugated to horseradish peroxidase was used as the second antibody. Color development was carried out using a horseradish peroxidase color development solution.
RESULTS AND DISCUSSION
Mitochondrial Soluble Matrix Proteins Increase the Activity of Cytochrome bc1 Complex
In searching for possible interactions between the electron transfer complexes and the mitochondrial matrix proteins, we found that the electron transfer activity of mitochondrial cytochrome bc1 complex increases in the presence of bovine mitochondrial matrix extract (Table 1). The involvement of phospholipids in the matrix extract to activate the bc1 complex was ruled out, as the addition of phospholipase A-treated matrix extract gave the same level of bc1 activity increase as that of untreated matrix extract. However, when the mitochondrial matrix extract was heated to 95 °C and then incubated with the bc1 complex, no activity increase was observed, suggesting that some proteins in the matrix extract play the activation role. This suggestion was further confirmed by the observation that the proteinase-digested matrix extract showed no activation on the activity of bc1 complex. Because the purified cytochrome bc1 complex contains no other proteins besides the subunits of the complex, it is likely that some matrix proteins that are capable of activating the bc1 complex might be physically associated with the complex in vivo and then dissociated from the bc1 complex during the purification steps. The use of multiple steps of salt fractionation/precipitation in the presence of detergents for purification of the bc1 complex certainly will remove the interacting matrix proteins.
TABLE 1.
Effect of mitochondrial matrix extract on the activity of bovine mitochondrial bc1 complex
Purified bc1 complex was incubated with mitochondrial matrix extract (MP) or treated MP for 20 min at 4 °C before ubiquinol-cytochrome c (Cyt c) reductase activity was determined. Buffer, MP preparation buffer as control; (MP + PLA2), MP was treated with phospholipase A2 (PLA2) for 30 min first; denatured MP, MP was heated at 95 °C for 30 min and then centrifuged to discard the precipitate.
| Treatments | Activity | Activitya |
|---|---|---|
| μmol Cyt c reduced/min/nmol Cyt b | % | |
| bc1 + buffer | 12.00 ± 0.24 | 100 ± 2 |
| bc1 + MP | 15.84 ± 0.24 | 132 ± 2 |
| bc1 + (MP + PLA2) | 15.60 ± 0.36 | 130 ± 3 |
| bc1 + denatured MP | 11.88 ± 0.86 | 99 ± 7 |
a 100% activity represents 12 μmol of cytochrome c reduced/min/nmol of cytochrome b at 23 °C. n = 3, means ± S.E.
Identification of MDH as an Interacting Protein with the bc1 Complex
Purified cytochrome bc1 complex is only soluble/dispersed in an aqueous solution in the presence of detergent. It becomes precipitate when the detergent in the system is removed upon dialysis. It is expected that a soluble protein interacting with bc1 complex will co-precipitate with the complex when the bc1 complex becomes the precipitate upon dialysis. In this study we employed the soluble/insoluble properties of the bc1 complex to pull down protein(s) in the matrix extract that interacts with the complex. The use of the dialysis/precipitation method has advantages over the commonly used antibody/antigen method in pulling down interacting proteins. The antibody/antigen method depends on the location of the epitopes that the antibodies are against. If the epitopes are located at the surface of the complex where the interacting protein is associated, the antibody will cover the association site and, thus, cause a false negative result. This problem will not be encountered when the dialysis/precipitation method is used, because the surface area in the bc1 complex will not be covered. Therefore, all the interacting proteins will be pulled down by using the dialysis/precipitation method.
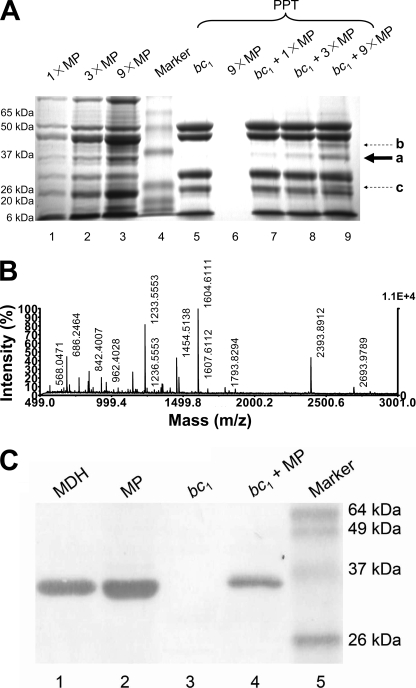
Aliquots of a given amount of the detergent-dispersed bc1 complex were incubated with various amounts of the matrix extract at 4 °C for 2 h. The mixtures were then dialyzed against the matrix protein buffer for 4 h with one change of buffer to remove detergent and then centrifuged for 1 h at 100,000 × g to recover the precipitates of the bc1 complex. Fig. 1-A shows the SDS-PAGE of the recovered precipitates after centrifugation. In addition to the subunits of the cytochrome bc1 complex, several protein bands are observed, and their intensities increased as the amount of matrix protein extract used in the incubation increased. A major protein band whose band intensity increased as the matrix concentration increased was cut out from the gel, subjected to in-gel digestion with trypsin, and analyzed by MALDI-TOF mass spectrometry.
FIGURE 1.
Identification of MDH as an interacting protein with the bc1 complex. A, SDS-PAGE analysis of bc1 pulled-down proteins from matrix extract. Lanes 1-3, various amounts of MP as controls show the proteins in the matrix extract; lane 4, standard proteins; lanes 5 and 6, bc1 complex and MP only as controls show the precipitates after centrifugation; lanes 7-9, shown is the bc1 complex together with the pulled-down proteins from matrix extract. The solid arrow shows the main matrix protein being pulled down by the bc1 complex. The dashed arrow shows some other bands being pulled down by the bc1 complex. MP stands for mitochondrial matrix proteins; 1×, 3×, and 9× stand for 0.28, 0.83, and 2.50 mg/ml of MP in the experiment. PPT stands for precipitates. a, malate dehydrogenase; b, aspartate transaminase; c, unknown protein. B, shown are mass spectrometry spectra of protein sliced from SDS-PAGE gel. Spectrum data were collected from a MALDI-TOF mass spectrometer. It consisted of a series of multiple charged ions from each fragment on a mass-to-charge (m/z) ratio scale. 100% intensity represents the highest peak. C, shown is a Western blot analysis of bc1 pulldown matrix proteins with anti-MDH antibody. Lane 1, purified bovine mitochondrial MDH; lane 2, mitochondrial matrix extract (MP); lane 3, bc1; lane 4, the precipitate from dialyzed mixture of the bc1 complex and mitochondrial matrix extract (bc1+MP); lane 5, standard proteins.
This protein was identified as bovine mitochondria MDH based on peptide mass fingerprinting analysis (Fig. 1B). The identity of the mitochondrial MDH was further confirmed by Western blotting using a polyclonal antibody against the mitochondrial MDH (Fig. 1C). As expected, a protein band with an apparent molecular mass of 35 kDa corresponding to mitochondrial malate dehydrogenase was detected in the matrix extract and in the bc1 precipitate fraction as the positive control. The other two minor bands that were indicated by the dotted arrows in Fig. 1A were also identified by mass spectrometry. The larger one was aspartate transaminase, but the smaller one was not identified by mass spectrometry due to the contaminant of the adjacent band.
Effect of MDH on the Activity of the Cytochrome bc1 Complex
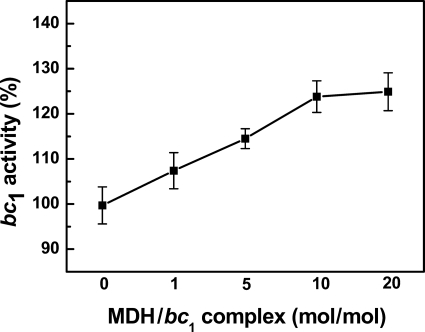
As shown in the previous section, the mitochondrial matrix extract has the ability to enhance bc1 activity. If MDH in the matrix extract is indeed responsible for interaction with the bc1 complex, one would expect to see an increase of bc1 activity upon the addition of purified MDH. Purified mitochondrial MDH, purchased from Sigma, was incubated with the cytochrome bc1 complex, and the activity of ubiquinol-cytochrome c reductase was assayed. As shown in Fig. 2, the activity of the bc1 complex increases as the MDH concentration in the incubation mixture increases. This result indicates that MDH is indeed one of the major proteins in the matrix extract interacting with the bc1 complex to enhance the complex activity.
FIGURE 2.
Effect of MDH concentration on the bc1 complex activity. A given amount of bc1 complex was added to different amounts of MDH to give the indicated molar ratios. After the mixtures were incubated on ice for 20 min, the bc1 activity was determined. The activity of bc1 complex only was used as 100%. n = 3, data are the means ± S.E.
Binding between MDH and Cytochrome bc1 Complex
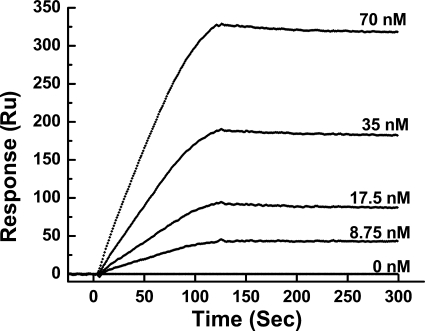
The binding kinetics of MDH to bc1 was studied by surface plasmon resonance using a SensiQ machine. MDH was bonded to the COOH chip, and different concentrations of bc1 complex were run through the MDH channel and control channel. Data analysis showed that the KD for the interaction between bc1 complex and MDH is about 0.047 μm (Fig. 3), indicating a strong interaction. The interaction is buffer concentration-dependent. At a 100 mm Na+/K+ phosphate buffer, the KD is 0.047 μm; at a 50 mm Na+/K+ phosphate buffer, the KD is 0.027 μm. The fact that MDH interacts better with the bc1 complex in a lower buffer concentration than a higher one indicates that the interaction between MDH and the bc1 complex is hydrophilic.
FIGURE 3.
Surface plasmon resonance analysis of the interaction between bc1 complex and MDH. The bc1 complex was diluted with the flowing buffer to give concentrations of 8.75, 17.5, 35, and 70 nm. The flowing buffer used was 100 mm Na+/K+ phosphate buffer, pH 7.4, containing 0.01% potassium deoxycholate. Aliquots of 100 μl of diluted bc1 at the indicated concentrations were injected into both the control channel and MDH-bound channel. The flow rate was held constant at 50 μl/min response units (Ru). Data were analyzed with Qdat software.
Identification of the Subunits in bc1 Complex That Interact with MDH
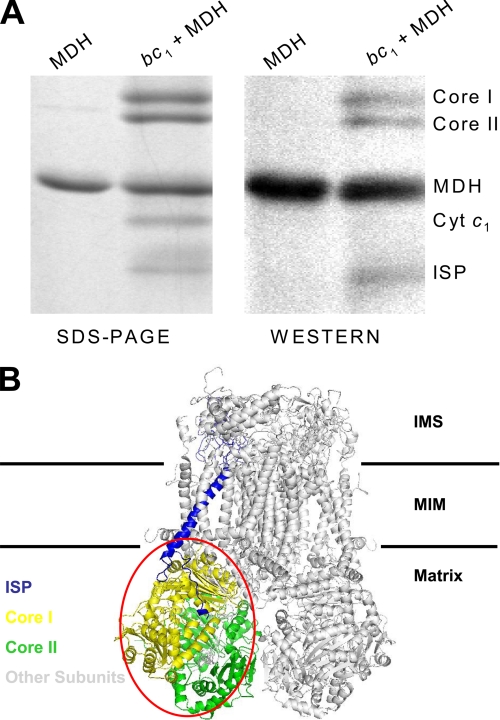
To identify the subunit(s) in the bc1 complex that interacts with MDH, a biotin-labeled transfer cross-linker, Sulfo-SBED, was used as described under “Experimental Procedures.” Fig. 4A shows the SDS-PAGE and the Western blotting analysis of Sulfo-SBED-labeled MDH photolyzed alone and in the presence of the bc1 complex followed by β- mercaptoethanol treatment. The streptavidin horseradish peroxide conjugate was used to probe proteins having a transferred biotin tag. Four protein bands with apparent molecular masses of 53, 51, 35, and 21 kDa were shown in the SDS-PAGE part around the 15∼60-kDa region. The detection of the transferred biotin tag in MDH itself was expected in the Western blotting as the 35-kDa band, because MDH works as a dimer. The other three bands in the Western blotting had the same molecular masses as core I and II and ISP. The band of cytochrome c1, which showed in this SDS-PAGE, and the band of cytochrome b, which did not show clearly in the SDS-PAGE, were not found in the Western blot. Other small subunits that were smaller than 15 kDa were not detected by the Western blot (not shown in this range of the SDS-PAGE). The identification of core I and II and ISP in the bc1 complex as the interaction partner for MDH is in line with the three-dimensional structure of the bc1 complex (shown as Fig. 4B). Core I and II account for a major portion of the matrix part of the bc1 complex. Subunits VI, IX, the N-terminal parts of subunit VII and V (ISP), and the C-terminal part of subunit IV (cytochrome c1) are also part of it. Because the mitochondrial MDH is an enzyme of the citric acid cycle and is located in the matrix, interaction of MDH with the bc1 complex through core I and II in the matrix region was expected. Furthermore, the involvement of core I and II in the interaction with MDH is in line with the finding of the interaction is hydrophilic, as MDH and core I and II of the complex are covered with charged amino acid residues. Although ISP was mainly in the intermembrane space, the N terminus was still exposed in the matrix; therefore, MDH could bind with this N terminus as shown in Fig. 4B. Because ISP plays an important role in the electron transfer within the bc1 complex, this interaction indicates that MDH would have a chance to affect the electron transfer through ISP, or ISP could transfer some signal to MDH through this crowbar-like N terminus.
FIGURE 4.
SDS-PAGE and Western blotting of sulfo-SBED cross-linked MDH and bc1. A, 10 μg of MDH in 100 μl of 50 mm Na+/K+ phosphate buffer, pH 7.4, was incubated with sulfo-SBED for 2 h on ice in the dark then dialyzed against 500 ml of a 50 mm Na+/K+ phosphate buffer, pH 7.4, in the dark to remove any unreacted sulfo-SBED. The chemically labeled MDH was then incubated without and with 30 μg of bc1 in 200 μl of a 50 mm Na+/K+ phosphate buffer, pH 7.4, on ice for 1 h. After incubation, the mixtures were photolyzed with a long wavelength UV light (365 nm) at a distance of 5 cm for 15 min. The photolyzed samples were treated with β-mercaptoethanol and subjected to SDS-PAGE and Western blotting. The biotin tags were probed with an avidin-horseradish peroxidase conjugate. B, the interaction partners for MDH were shown in the three-dimensional structure of the bc1 complex. Protein Data Bank code 1NTM. IMS, intermembrane space; MIM, mitochondrial inner membrane.
Cytochrome bc1 Complex Increases the Activity of MDH Unidirectionally (OAA to Malate)
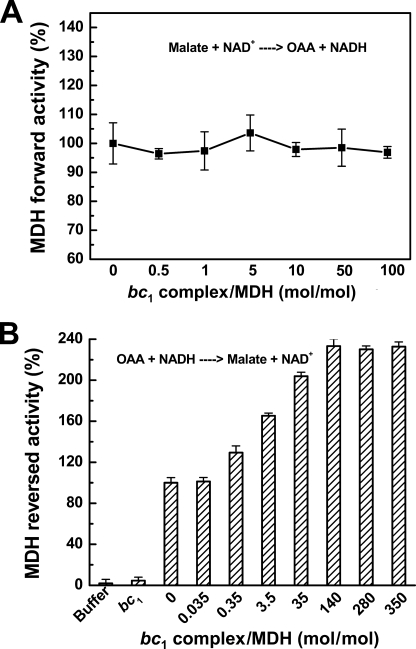
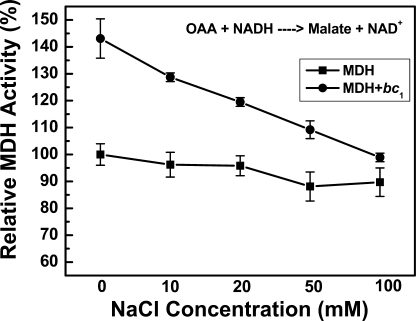
Because the binding of the bc1 complex with MDH enhances the bc1 activity, it was of interest to see whether or not this binding could affect the MDH activity. MDH catalyzes not only the oxidation of malate to oxaloacetate (forward reaction) but also the reduction of oxaloacetate to malate (reverse reaction); both activities were investigated. When MDH was incubated with varying concentrations of bc1 complex, no increase in activity of MDH of the forward reaction was observed (see Fig. 5A). On the other hand, the reverse reaction activity of MDH increased as the bc1 concentration increased (see Fig. 5B). A maximum activation of 140% was observed in the reversed reaction. The activation was found to be ionic strength-dependent. When the ionic strength increased, the extent of activity enhancement decreased (see Fig. 6). This confirmed that the interaction was hydrophilic.
FIGURE 5.
Effect of bc1 complex on the activity of forward reaction (from malate to oxaloacetate) and reversed reaction (from oxaloacetate to malate) of MDH. Varying amounts of bc1 complexes were incubated on ice for 20 min with a given amount of MDH to give the indicated molar ratios. The mixtures were then subjected to assay for MDH forward (A) and reversed (B) activities. The activity of MDH in the absence of bc1 was used as 100%. n = 3, data are the means ± S.E.
FIGURE 6.
Effect of ionic strength on reverse MDH activity enhancement by bc1. MDH only or together with bc1 complex in 100 mm Na+/K+ phosphate buffer, pH 7.5, was incubated with the indicated concentrations of NaCl on ice for 30 min before MDH activity (the reverse reaction) was determined. The activity of MDH only was used as 100%. n = 4, data are the means ± S.D.
The activity of bc1 complex can be affected by its inhibitors such as stigmatellin, antimycin A, or zinc ion (10, 27–28). When MDH was incubated with bc1 complex treated with its inhibitors, only a partial enhancement of MDH-reversed activity was observed (Table 2). Similarly, when the bc1 complex was incubated with chlorothricin-treated MDH (29), no enhancement of bc1 activity was observed. These results indicated that only active cytochrome bc1 complex and MDH can have an effect on each other's activity upon their interaction.
TABLE 2.
Effect of MDH activity upon interaction with intact and the inhibitor-treated bc1 complex
Stigmatelin-, antimycin A-, or zinc ion (ZnCl2)-treated bc1 complex was incubated with MDH and assayed for MDH activity, The bc1 dilute buffer or inhibitors themselves was added as negative controls. Cyt, cytochrome c.
| Treatments | Activity | Enhancementa |
|---|---|---|
| mmol /min/mg | % | |
| MDH + buffer | 1.77 ± 0.06 | 0 ± 3 |
| MDH + inhibitor | 1.75 ± 0.07 | −1 ± 4 |
| MDH + bc1 | 2.46 ± 0.11 | 39 ± 6 |
| MDH + bc1 + QH2 + Cyt c | 2.49 ± 0.13 | 41 ± 7 |
| MDH + (bc1 + stigmatelin) | 2.05 ± 0.08 | 16 ± 5 |
| MDH + (bc1 + antimycin A) | 2.12 ± 0.06 | 20 ± 3 |
| MDH + (bc1 + zinc ion) | 1.84 ± 0.14 | 4 ± 8 |
a Enhancement of MDH activity at the reversed reaction. n = 3, means ± S.E.
Cytochrome bc1 Complex Changes the Enzyme Kinetics of MDH
It was interesting to see whether the kinetics of MDH under this unidirectional enhancement changed or not. The Km for NADH and the Vmax for the reverse direction of MDH were determined by Lineweaver-Burk plots. The Km for NADH decreased from 22.2 ± 0.5 to 15.4 ± 0.5 μm, and the Vmax increased from 1.6 ± 0.2 to 2.5 ± 0.2 mmol/min/mg when bc1 complex was added to MDH (Table 3 and supplemental Fig. S1). Also the Km of OAA decreased from 10.7 ± 0.7 to 8.9 ± 0.9 μm, and the Vmax increased from 2.2 ± 0.1 to 3.5 ± 0.1 mmol/min/mg (Table 3 and supplemental Fig. S2). A similar kinetics analysis was also carried out in the forward direction, but no significant difference was detected. Therefore, the binding of bc1 complex might induce some conformational change of MDH and, thus, lower its Km for NADH and OAA and meanwhile increase the Vmax, which enhances the activity of the enzyme.
TABLE 3.
Kinetics analysis of the MDH in the present of bc1 complex
0.1, 0.05, 0.025, 0.016, and 0.0125 mm NADH and 0.2 mm OAA were used in the assay for analyzing the Km of NADH. 0.1, 0.025, 0.0125, and 0.00625 mm OAA and 0.2 mm NADH were used in the assay for analyzing the Km of OAA. MDH-only or together with bc1 complex was used in both of the assays, and Vmax was also calculated via this Lineweaver-Burk plot.
| Enzyme | NADH |
OAA |
||
|---|---|---|---|---|
| Km | Vmax | Km | Vmax | |
| μm | mmol/min/mg | μm | mmol/min/mg | |
| MDH | 22.2 ± 0.5 | 1.6 ± 0.2 | 10.7 ± 0.7 | 2.2 ± 0.1 |
| MDH + bc1 | 15.4 ± 0.5 | 2.5 ± 0.2 | 8.9 ± 0.9 | 3.5 ± 0.1 |
The Cross-talk May Regulate the Mitochondrial Bioenergetics
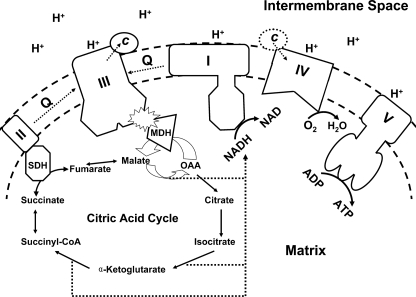
The cell regulates the ATP generation in mitochondria depending on the energy requirements of different situations. When the cell needs less ATP, mitochondria will slow down the citric acid cycle and, thus, slow down the ATP generation via the decrease of electron transport and ATP synthase activity. Based on the present work, we hypothesize that when the cell needs to slow down the ATP generation, it triggers the cross-talk between MDH and the bc1 complex (See Fig. 7). Once the bc1 complex binds to MDH, it will enhance the reversed activity of MDH and, thus, decrease the OAA concentration in the matrix. Because OAA is the crucial member of the citric acid cycle, a decrease in its concentration will result in lowering the concentrations of NADH and FADH2, which are substrates of complex I and II in the electron transport chain, respectively. The decrease in the electron transfer activity resulting from the limited input of substrates will yield a negative regulation of ATP generation. At this moment we offer no good explanation on why the interaction between the bc1 complex and MDH enhances the bc1 activity but to speculate that the regulation of cellular energy metabolism may depend on the interplay between the electron transport chain and citric acid cycle activities.
FIGURE 7.
The schematic illustration for the cross-talk between MDH and bc1 complex. Solid arrows show the reactions in the matrix. The dashed arrow in the membrane stands for the electron transport. The dashed arrow in the matrix stands for the NADH generation form the citric acid cycle. The dashed circled c (Cyt c) shows its translocation from complex III to complex IV. SDH, succinate dehydrogenase; Q, ubiquinol/ubiquinone.
The cross-talk could also be involved in the gluconeogenesis or in helping the correction of mitochondrial dysfunction during hypoxia/reoxygenation (30). In the gluconeogenesis, the substrate OAA cannot get out of mitochondria directly by itself. It has to be converted into malate first via the reversal of the citric acid cycle catalyzed by MDH. Once the malate is transported into the cytosol, it is converted to OAA and yields NADH by cytosolic MDH.
What is still yet to be resolved is the molecular mechanism associated with this cross-talk between the bc1 complex and MDH. Because it apparently plays an important role in controlling ATP generation, it is likely that some factors or signals are responsible for the regulation of the promotion or breaking up the interaction. Work of determining the molecular mechanism of this cross-talk is ongoing in our laboratory.
Supplementary Material
Acknowledgment
We thank Janet Rogers for mass spectroscopy analysis.
This work was supported, in whole or in part, by National Institutes of Health Grant GM30721 (to C.-A. Y.). This work was also supported by Oklahoma Agricultural Experiment Station Projects 1819 and 2372 from the Oklahoma State University.

The on-line version of this article (available at http://www.jbc.org) contains supplemental Figs. 1 and 2.
- ISP
- iron-sulfur protein
- MDH
- malate dehydrogenase
- OAA
- oxaloacetate
- Sulfo-SBED
- sulfosuccinimidyl-2-[6-(biotinamido)-2-(p-azidobenzamido) hexanoamido]ethyl-1,3′-dithiopropionate
- Sulfo-NHS
- sulfonated N-hydroxysuccinimide
- Q0C10BrH2
- 2,3-dimethoxy-5-methyl-6-(10-bromodecyl)-1,4-benzoquinol
- MALDI-TOF
- matrix-assisted laser desorption ionization time-of-flight
- MP
- matrix protein.
REFERENCES
- 1.Trumpower B. L., Gennis R. B. (1994) Annu. Rev. Biochem. 63, 675–716 [DOI] [PubMed] [Google Scholar]
- 2.Xia D., Yu C. A., Kim H., Xia J. Z., Kachurin A. M., Zhang L., Yu L., Deisenhofer J. (1997) Science 277, 60–66 [DOI] [PubMed] [Google Scholar]
- 3.Kim H., Xia D., Yu C. A., Xia J. Z., Kachurin A. M., Zhang L., Yu L., Deisenhofer J. (1998) Proc. Natl. Acad. Sci. U.S.A. 95, 8026–8033 [DOI] [PMC free article] [PubMed] [Google Scholar]
- 4.Iwata S., Lee J. W., Okada K., Lee J. K., Iwata M., Rasmussen B., Link T. A., Ramaswamy S., Jap B. K. (1998) Science 281, 64–71 [DOI] [PubMed] [Google Scholar]
- 5.Berry E. A., Guergova-Kuras M., Huang L. S., Crofts A. R. (2000) Annu. Rev. Biochem. 69, 1005–1075 [DOI] [PubMed] [Google Scholar]
- 6.Zhang Z., Huang L., Shulmeister V. M., Chi Y. I., Kim K. K., Hung L. W., Crofts A. R., Berry E. A., Kim S. H. (1998) Nature 392, 677–684 [DOI] [PubMed] [Google Scholar]
- 7.Hunte C., Koepke J., Lange C., Rossmanith T., Michel H. (2000) Structure 8, 669–684 [DOI] [PubMed] [Google Scholar]
- 8.Hunte C., Solmaz S., Lange C. (2002) Biochim. Biophys. Acta 1555, 21–28 [DOI] [PubMed] [Google Scholar]
- 9.Gao X., Wen X., Yu C., Esser L., Tsao S., Quinn B., Zhang L., Yu L., Xia D. (2002) Biochemistry 41, 11692–11702 [DOI] [PubMed] [Google Scholar]
- 10.Gao X., Wen X., Esser L., Quinn B., Yu L., Yu C. A., Xia D. (2003) Biochemistry 42, 9067–9080 [DOI] [PubMed] [Google Scholar]
- 11.Xia D., Esser L., Yu L., Yu C. A. (2007) Photosynth. Res. 92, 17–34 [DOI] [PubMed] [Google Scholar]
- 12.Oyedotun K. S., Lemire B. D. (2004) J. Biol. Chem. 279, 9424–9431 [DOI] [PubMed] [Google Scholar]
- 13.Ovádi J., Huang Y., Spivey H. O. (1994) J. Mol. Recognit. 7, 265–272 [DOI] [PubMed] [Google Scholar]
- 14.Dudkina N. V., Eubel H., Keegstra W., Boekema E. J., Braun H. P. (2005) Proc. Natl. Acad. Sci. U.S.A. 102, 3225–3229 [DOI] [PMC free article] [PubMed] [Google Scholar]
- 15.Tso S. C., Yin Y., Yu C. A., Yu L. (2006) Biochim. Biophys. Acta 1757, 1561–1567 [DOI] [PubMed] [Google Scholar]
- 16.Deng K., Zhang L., Kachurin A. M., Yu L., Xia D., Kim H., Deisenhofer J., Yu C. A. (1998) J. Biol. Chem. 273, 20752–20757 [DOI] [PubMed] [Google Scholar]
- 17.Deng K., Shenoy S. K., Tso S. C., Yu L., Yu C. A. (2001) J. Biol. Chem. 276, 6499–6505 [DOI] [PubMed] [Google Scholar]
- 18.Yu C. A., Yu L. (1982) Biochemistry 21, 4096–4101 [DOI] [PubMed] [Google Scholar]
- 19.von Jagow G., Link T. A. (1986) Methods Enzymol. 126, 253–271 [DOI] [PubMed] [Google Scholar]
- 20.Yu C. A., Yu L. (1980) Biochim. Biophys. Acta 591, 409–420 [DOI] [PubMed] [Google Scholar]
- 21.Yu L., Yang S., Yin Y., Cen X., Zhou F., Xia D., Yu C. A. (2009) Methods Enzymol. 456, 459–473 [DOI] [PMC free article] [PubMed] [Google Scholar]
- 22.Berden J. A., Slater E. C. (1970) Biochim. Biophys. Acta 216, 237–249 [DOI] [PubMed] [Google Scholar]
- 23.Yu C. A., Yu L., King T. E. (1972) J. Biol. Chem. 247, 1012–1019 [PubMed] [Google Scholar]
- 24.Morgunov I., Srere P. A. (1998) J. Biol. Chem. 273, 29540–29544 [DOI] [PubMed] [Google Scholar]
- 25.Mullinax T. R., Mock J. N., McEvily A. J., Harrison J. H. (1982) J. Biol. Chem. 257, 13233–13239 [PubMed] [Google Scholar]
- 26.Stumpf D. A., Parks J. K., Eguren L. A., Haas R. (1982) Neurology 32, 221–227 [DOI] [PubMed] [Google Scholar]
- 27.Link T. A., von Jagow G. (1995) J. Biol. Chem. 270, 25001–25006 [DOI] [PubMed] [Google Scholar]
- 28.Ohnishi T., Trumpower B. L. (1980) J. Biol. Chem. 255, 3278–3284 [PubMed] [Google Scholar]
- 29.Schindler P. W. (1975) Eur. J. Biochem. 51, 579–585 [DOI] [PubMed] [Google Scholar]
- 30.Weinberg J. M., Venkatachalam M. A., Roeser N. F., Nissim I. (2000) Proc. Natl. Acad. Sci. U.S.A. 97, 2826–2831 [DOI] [PMC free article] [PubMed] [Google Scholar]
Associated Data
This section collects any data citations, data availability statements, or supplementary materials included in this article.


