Abstract
Huntington disease (HD) is caused by an expansion of the polyglutamine (polyQ) repeat (>37Q) in huntingtin (htt), and age of onset is inversely correlated with the length of the polyQ repeat. Mutant htt with expanded polyQ is ubiquitously expressed in various types of cells, including glia, but causes selective neurodegeneration. Our recent study demonstrated that expression of the N-terminal mutant htt with a large polyQ repeat (160Q) in astrocytes is sufficient to induce neurological symptoms in mice (Bradford, J., Shin, J. Y., Roberts, M., Wang, C. E., Li, X.-J., and Li, S. H. (2009) Proc. Natl. Acad. Sci. U.S.A. 106, 22480–22485). Because glia-neuron interactions are critical for maintaining the normal function and survival of neurons in the brain and because mutant htt is more abundant in neurons than in glial cells, it is important to investigate whether glial htt can still contribute to HD pathology when mutant htt is abundantly expressed in neuronal cells. We generated transgenic mice that express mutant htt with 98Q in astrocytes. Unlike our recently generated htt-160Q transgenic mice, htt-98Q mice do not show obvious neurological phenotypes, suggesting that the length of the polyQ repeat determines the severity of glial dysfunction. However, htt-98Q mice show increased susceptibility to glutamate-induced seizure. Mice expressing mutant htt in astrocytes were mated with N171-82Q mice that express mutant htt primarily in neuronal cells. Double transgenic mice expressing mutant htt in both neuronal and glial cells display more severe neurological symptoms and earlier death than N171-82Q mice. These findings indicate a role of glial mutant htt in exacerbating HD neuropathology and underscore the importance of improving glial function in treating HD.
Keywords: Aging, Diseases/Aging, Diseases/Genetic, Diseases/Neurodegeneration, Diseases/Neurological, Gene/Transcription
Introduction
Huntington disease (HD)3 is an inherited neurological disorder caused by a polyglutamine (polyQ) expansion in huntingtin (htt). The polyQ expansion is also the common genetic mutation for eight other neurodegenerative diseases including spinal cerebellar ataxia 1–3, 6, 7, 17. A noticeable pathology feature of these diseases is that the mutant proteins, which are ubiquitously expressed in the body and brain, cause selective neurodegeneration in distinct brain regions in each disease (1). In HD, selective neuronal loss preferentially occurs in the striatum, the deep layers of the cerebral cortex and extends to many other brain regions during the late stage of the disease (2). This phenomenon has led to extensive studies of the effects of mutant htt in neuronal cells. Several HD transgenic mouse models have been generated including those expressing mutant htt under the endogenous htt promoter (knock-in), transgenic human htt promoters (YAC, BAC, and R6/2), or the mouse neuronal prion promoter (N171-82Q) (3). Mice expressing truncated htt (R6/2 and N171-82Q) show more severe phenotypes than YAC or BAC transgenic mice that express full-length mutant htt (3, 4), suggesting that N-terminal mutant htt is more pathogenic than full-length mutant htt. In addition to the polyQ domain, the expression levels and the size of mutant htt are also important in determining neurological symptoms (5).
Another important factor that influences HD neuropathology are cell-cell interactions (6). In the brain, over 90% of cells are glial cells that support the survival of neuronal cells. Glial pathology has been found in many HD mouse models (7–9) and in postmortem brains of HD patients (10, 11). Our early studies revealed that mutant htt is expressed in glial cells in the brain of HD mice and patients (12). In support of the role of glia in polyQ diseases, overexpression of mutant SCA7 protein in Bergmann glia impairs glutamate uptake and induces neurodegeneration in the cerebellum of transgenic mice (13). Our recent study demonstrates that even when mutant N-terminal htt is expressed under the endogenous htt level in glial cells, it can still induce age-dependent neurological phenotypes (14). However, it is also known that overexpression of mutant htt in neuronal cells can cause severe neurological phenotypes in N171-82Q mice (15). Comparing the distribution of htt in neuronal and glial cells revealed that neurons accumulate much more mutant htt than glial cells in HD mouse brains (12, 16). Thus, an important issue is whether mutant htt in glial cells can still exacerbate neurological phenotypes when mutant htt is also expressed in neurons. The significance of investigating this issue is 2-fold. First, it will provide strong evidence for the important role of glial htt in HD pathogenesis in the context of neuronal expression of mutant htt. Second, it will validate the importance of improving glial function in reducing HD neuropathology.
To this end, we generated transgenic mice that express mutant htt with 98Q in astrocytes. Although these transgenic mice do not show obvious neurological phenotypes, they allowed us to examine the exacerbating effect of glial htt by crossing them with HD mice that express mutant htt primarily in neuronal cells. Our findings demonstrate that glial htt can exacerbate neurological phenotypes and suggest that improving glial function is an important strategy for treating HD.
EXPERIMENTAL PROCEDURES
Antibodies and Plasmids
Rabbit polyclonal antibody (EM48) and mouse monoclonal antibodies (mEM48) against the N-terminal region (amino acids 1–256) of human htt were described in our previous study (17). Rabbit antibodies against GLT-1 (cGLT T88) were purchased from Millipore Inc. Other antibodies used included mouse monoclonal antibodies against polyQ (1C2) or GFAP (astrocyte-specific marker; Millipore Inc), rabbit anti-GFAP (Gene Tex, Inc), mouse anti-γ tubulin (Sigma), rat monoclonal anti-MBP (oligodendrocyte-specific marker, Chemicon, mAb 386), mouse anti-NeuN (neuron-specific marker; Chemicon), mouse anti-F4/80 (microglia-specific marker; Serotec), and goat anti-mouse or -rabbit antibodies conjugated with Alexa Fluor 488 (Molecular Probes).
Generation of htt Transgenic Mice
N171–82Q mice, which express N-terminal mutant htt (1–171 amino acids) with 82Q (15), were bred and maintained in the animal facility at Emory University under specific pathogen-free conditions in accordance with institutional guidelines of The Animal Care and Use Committee at Emory University. Htt-23Q and Htt-160Q mice that express normal and mutant N-terminal htt (1–208 amino acids) with 23Q and 160Q, respectively, were generated in our recent study (14). The cDNAs encoding N-terminal human htt (208 amino acids) containing the polyQ repeats were subcloned into the eukaryotic expression vector pGfa2 at the BamHI restriction site. This vector uses the 2.2-kb fragment of astrocyte-specific human glial fibrillary acidic protein (GFAP) promoter (18). Using this vector encoding mutant N-terminal (1–208 amino acids) htt with 98Q, we generated htt-98Q transgenic mice. Microinjection of linearized construct was conducted by the Emory University transgenic mouse core facility. Forty-two founder mice (FVB/N strain) were obtained and housed in the Emory mouse facility. Genomic DNA was isolated from mouse tails, and PCR genotyping method was employed for screening transgenic mice. Primers with sequences flanking the polyQ repeat were used for PCR. The sequences of the forward and reverse primers are as follows: (forward: 5′-ATGAAGGCCTTCGAGTCCCTCAAGTCCTTC-3′; reverse: 5′-AAACTCACGGTCGGTGCAGCGGCTCCTCAG-3′). We identified 12 positive founders, and two different transgenic mouse lines (line-217 and line-218) with detectable transgenic htt expression via Western blotting were further characterized.
Western Blot Analysis and Immunohistochemistry
For Western blots, cultured cells or brain tissues were homogenized in radioimmune precipitation assay buffer (50 mm Tris, pH 8.0, 150 mm NaCl, 1 mm EDTA pH 8.0, 1 mm EGTA, pH 8.0, 0.1% SDS, 0.5% DOC, and 1% Triton X-100) with 1× protease inhibitor from Sigma (P8340). The cell or tissue lysates were diluted in 1× SDS sample buffer (62.6 mm Tris-HCl, pH 6.8, 2% SDS, 10% glycerol, and 0.01% bromphenol blue) and sonicated for 10 s after incubation at 100 °C for 5 min. The total lysates were resolved in a Tris-glycine gel (Invitrogen) and blotted to a nitrocellulose membrane. The Western blots were developed using the ECLPlus kit (GE Health Care/ Amersham Biosciences).
For immunohistochemistry, brains of transgenic and littermate wild-type control mice were rapidly isolated and cut to sections (8–10, or 40 μm) with a cryostat (Leica) at −18 °C. Mouse brain sections were examined with EM48 or 1C2. Immunohistochemistry was performed as previously described (5, 12, 14). When the 1C2 antibody was used for immunocytochemistry, fixed brain sections were treated with 88% formic acid for 10 min prior to the incubation with 1C2 at 1:20,000 dilution (5). Light micrographs were taken using a Zeiss microscope (Axiovert 200 MOT) and a 63× lens (LD-Achroplan 63×/0.75) with a digital camera (Hamamatsu Orca-100) and Openlab software.
Glial Cultures
Enriched astrocyte cultures were prepared from 1–2 day postnatal mouse pups (12). The cultures were enriched for astrocytes by shaking the 15-day culture plates for 15 min to dissociate any oligodendrocytes. Immunostaining with antibodies to specific cellular markers (GFAP for astrocytes, F4/80 for microglia, and myelin basic protein for oligodendrocytes) was used to identify different types of glial cells.
RT-PCR
Total RNA from mouse cortex was isolated using the RNeasy Lipid Tissue Mini kit (Qiagen 74804). First-strand cDNA was obtained using the Invitrogen SuperScriptTM First Strand Synthesis System for RT-PCR (11904-018), using a combination of random hexamer and Oligo(dT)12–18 primers. RT-PCR of mouse brain htt and production of glyceraldehyde-3-phosphate dehydrogenase (GAPDH) primers have been previously described by our laboratory (5).
Real-time PCR
Three-week-old cultured astrocytes were examined. Total astrocytic RNA was collected using the Qiagen RNeasy Mini kit (74104), and cDNA was produced using the same method as for the brain lysate. Primers for GAPDH have been previously described in our early studies (5). Mouse htt primer sequences are as follows: (forward: 5′-TAGCCGTGAGCATCTGCCAACATT-3′; reverse: 5′-CTTCATCCATGGGAACCAGCAGAC-3′) and the human htt primer sequence is: (forward: 5′-CATAGCCGCTGCTGCCTC-3′; reverse: 5′-CAGCAGCTCCTCAGCCACA-3′). Eppendorf RealMasterMix (954160203) was used, and mouse and human htt levels were normalized to internal GAPDH levels. Three mice were used per genotype, and each reaction was performed in triplicate.
Behavioral Analysis
Mouse body weight, survival, and growth were measured. The motor function of mice was assessed using the accelerating rotarod test (AccuScan Instruments, Inc.), as described previously (19). In the accelerating rotarod test, each mouse was placed on a rotating cylinder that gradually accelerated to 40 rpm over a 5-min period. Latency to fall from the rotarod was recorded in 4 trials per day over a 3-day period. At least 5 min of recovery time was allowed between trials (19).
For the glutamate treatment experiment, monosodium l-glutamate was intraperitoneally injected into mice at a dose of 5 mg/kg (20–22). Mice were then examined for 4 h for their response to the injections. The onset latency and duration of hyper-excitability (wild running, jumping, or circling) and the duration of chronic seizure (tonic-clonic) were recorded. Mice injected with the same volume of phosphate-buffered saline showed no convulsive activity. Each group consisted of 8–11 mice.
Statistical Analysis
All values were expressed as means ± S.E. Statistical significance was assessed by the use of Student's t test or ANOVA with Newman-Keuls Multiple Comparison Test. A probability level of p < 0.05 was considered to be statistically significant for all statistical tests.
RESULTS
Age-dependent Accumulation of Mutant htt in Glial Cells in HD KI Mice
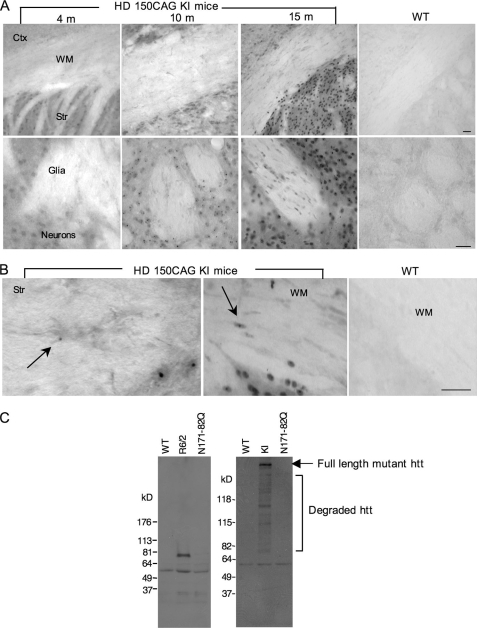
We previously found that mutant htt is expressed in glial cells in HD mouse brains and that fewer glial cells than neurons display nuclear htt aggregates (12, 16). Because HD is a late-onset neurological disorder showing age-dependent neuropathology, we wanted to investigate whether the accumulation of mutant htt in glial cells is age-dependent and correlates with disease progression. To this end, we examined HD CAG150 knock-in (KI) mice that express full-length mutant htt at the endogenous level (8). Immunostaining of mouse brain sections with EM48, an antibody that specifically labels polyQ-expanded htt (5), revealed an age-dependent increase of htt accumulation in glial cells in the white matter (WM) of the corpus callosum and striatum (Fig. 1A). Mutant htt forms smaller htt aggregates in glial cells than in neurons (Fig. 1B). In addition, neurons show much earlier and more abundant formation of htt aggregates than do glial cells. The lower accumulation of mutant htt in glia compared with neurons supports our recent finding that the activity of the ubiquitin-proteasome system is lower in neurons than in glial cells, such that misfolded polyQ proteins preferentially accumulate in neurons (16).
FIGURE 1.
Expression of mutant htt in glial cells in HD mouse brains. A, EM48 immunostaining of HD 150CAG knock-in (KI) mouse brains that express full-length mutant htt at the endogenous level. HD KI mice at the age of 4, 10, and 15 months, and WT mice at 12 months of age were examined. The upper panels (×10 magnification) show brain sections containing the cortex (Ctx), white matter (WM) of the corpus callosum, and striatum (Str). Scale bar: 50 μm. The lower panels (×40) show the striatum in which the regions containing glia and neurons are indicated. Scale bar: 20 μm. B, high magnification images (×63) showing that mutant htt forms smaller aggregates in glial cells (arrows) than neuronal htt aggregates in HD KI mouse brains. C, Western blots of cultured astrocytes from WT, R6/2, N171–82Q, and HD KI mouse brains showing the expression of mutant htt in astrocytes from R6/2, and HD KI, but not N171–82Q mice. 1C2 was used to detect expanded polyQ-containing proteins. Note that full-length (arrow) and multiple N-terminal htt fragments containing an expanded polyQ domain are evident in HD KI astrocytes.
To verify the expression of mutant htt in the astrocytes of HD mice, we isolated astrocytes from HD mice and cultured them for 4–5 weeks under in vitro conditions that allowed us to obtain a pure population of astrocytes without neuronal cells. We then examined the expression of mutant htt in astrocytes via Western blotting with the 1C2 antibody that reacts with the polyQ epitope. We were able to detect the expression of transgenic htt in astrocytes from R6/2 mice, which express exon1 htt under the control of the human htt promoter (23), but not in astrocytes from N171–82Q mice, which express N-terminal htt (1–171 amino acids with 82Q) under the control of the neuronal prion promoter (15). Importantly, we also detected full-length mutant htt and a number of its degraded products containing the expanded polyQ domain in astrocytes from HD KI mice, suggesting that the full-length mutant htt is cleaved into multiple N-terminal htt fragments in glial cells (Fig. 1C).
Generation of Transgenic Mice That Express Mutant htt in Astrocytes
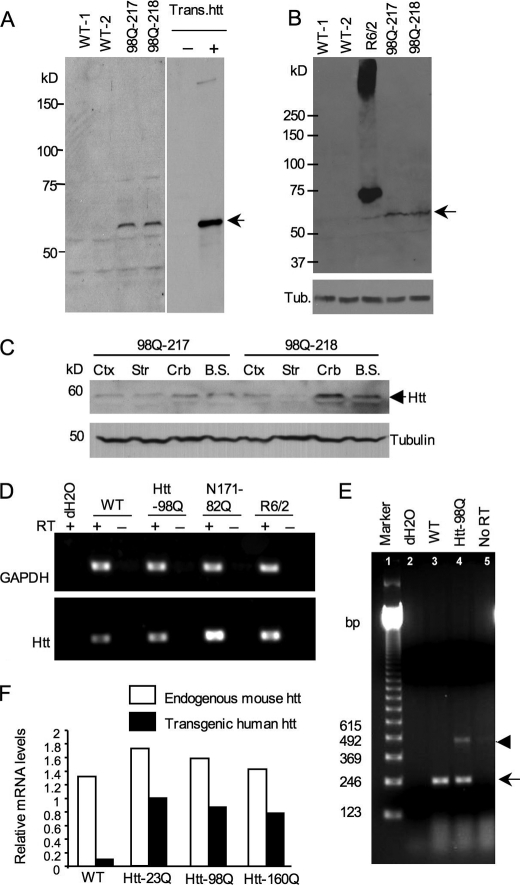
Our recent studies have generated transgenic mice that selectively express N-terminal mutant htt (1–208 amino acids) containing 160Q in glial cells under the control the human GFAP promoter (14). Using the same N-terminal htt construct but encoding a 98Q repeat, we also generated htt-98Q transgenic mice. Characterization of the expression of transgenic htt in the founders and their offspring revealed that two mouse lines (217 and 218) showed detectable expression of mutant htt in the brain tissues (Fig. 2A). Similar to htt-160Q mice, in which transgenic htt is expressed below the endogenous level (14), htt-98Q mice also show a low level of transgenic htt compared with R6/2 mice (Fig. 2B). Western blotting revealed that transgenic htt is expressed in various brain regions (Fig. 2C).
FIGURE 2.
Expression levels of transgenic htt in htt-98Q transgenic mice. A, Western blot analysis of the expression of transgenic htt (N-terminal htt (208 amino acids) containing 98Q) in whole brain lysates using anti-htt antibody (EM48). Mouse brain extracts of htt-98Q mice were obtained from two independent transgenic mouse lines (98Q-217 and 98Q-218 lines). Transfected htt in HEK293 cells served as a control (arrow). B, Western blots with EM48 reveals the low level of transgenic htt-98Q compared with transgenic htt in R6/2 mouse brain. The arrow indicates htt-98Q. C, EM48 Western blotting of different brain regional tissues of htt-98Q transgenic mice. D, RT-PCR analysis of the transcript levels of transgenic htt in WT and HD (htt-98Q, N171–82Q, and R6/2) mouse brain cortex tissues. Primers that can amplify both mouse and transgenic htt were used for PCR. GAPDH was also amplified and served as an internal control. RT, reverse transcriptase. E, RT-PCR analysis of cultured astrocytes showing lower levels of transgenic htt-98Q (arrowhead) than endogenous mouse htt (arrow). Primers that amplify the CAG repeat were used in RT-PCR. F, real-time PCR of cultured astrocytes from wild type and transgenic mice (htt-23Q, htt-98Q, htt-160Q) that express mutant htt in astrocytes. The relative expression levels of transgenic htt were normalized to endogenous GAPDH levels and were obtained from three independent real-time PCR assays.
We also examined the expression of htt transcripts in mouse brains via RT-PCR. Using primers that can amplify the common region of both mouse and human htt cDNA but lacks the CAG repeat, we found that the level of total htt (endogenous and transgenic htt) in htt-98Q mouse brain is lower than in N171–82Q and R6/2 transgenic mouse brains, or is slightly higher than that in wild-type mouse brain (Fig. 2D). To verify that the expression of mutant htt is indeed expressed in astrocytes in the brain, we cultured astrocytes from htt-98Q mouse brains for more than 4 weeks to obtain a pure population of astrocytes. Using these cultured astrocytes, we performed RT-PCR with primers crossing the CAG repeat region to distinguish between the endogenous and transgenic htt. Compared with endogenous mouse htt (arrow in Fig. 2E), transgenic htt-98Q (arrowhead in Fig. 2E) is expressed at a lower level. Furthermore, we performed real-time PCR to analyze the expression of transgenic htt transcripts in cultured astrocytes from wild-type and htt-98Q mice. In this experiment, we also included astrocytes from htt-23Q and htt-160Q transgenic mice that were generated previously (14). This real time PCR employed primers that amplify either endogenous mouse htt or transgenic human htt. The relative levels of htt were then quantified and normalized to the level of endogenous GAPDH. The results show that all transgenic htt transcripts are lower than the endogenous mouse htt transcripts (Fig. 2F).
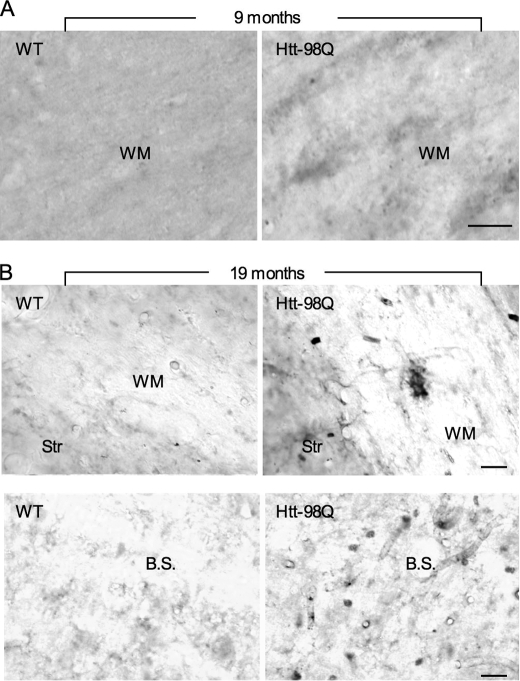
1C2 immunocytochemical studies of htt-98Q mouse brains revealed the specific expression of transgenic htt in glial cells in the white matter of corpus callosum as compared with the wild type mouse brain at 9 months of age (Fig. 3A). Whereas the staining signal is weaker in htt-98Q mouse brains than in other HD transgenic mice (data not shown), we found that aged htt-98Q mice (19-month old) show more positive staining of glia-like cells in the white matter and brain stem than younger mice (Fig. 3B). This evidence suggests that there is age-dependent accumulation of transgenic htt in htt-98Q mouse brains.
FIGURE 3.
Age-dependent accumulation of mutant htt in glial cells of htt-98Q transgenic mice. A, immunohistochemical staining with 1C2 shows the presence of mutant htt in the white matter (WM) of the corpus callosum in htt-98Q, but not in WT mice at the age of 9 months. B, wild-type and htt-98Q mice at 19 months of age were examined using 1C2 immunocytochemical staining. Note that mutant htt is expressed in glial cells in the WM of the corpus callosum and brain stem (B.S.) in htt-98Q mice. Scale bars: 10 μm.
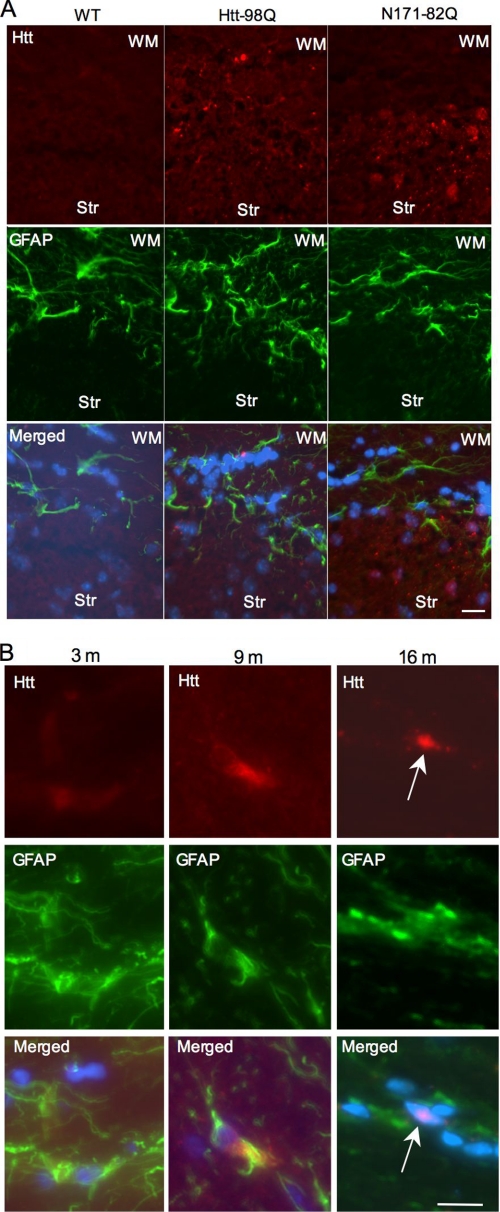
To confirm that transgenic htt is expressed in astrocytes in the mouse brain, we performed immunofluorescent staining of htt-98Q mouse brain sections and compared the staining to wild-type and N171–82Q mice. It is clear that transgenic htt in htt-98Q mice is restricted to glial cells, as evidenced by small aggregates in GFAP-positive cells in the white matter, whereas mutant htt in N171–82Q mice was predominantly seen in the striatum (Fig. 4A). Consistent with Fig. 3 that shows an age-dependent accumulation of mutant htt in the brain, immunofluorescent double staining also revealed that mutant htt is diffuse in the cytoplasm of astrocytes in young mice (3 and 9 months) and can form nuclear inclusions in astrocytes of old mice (16 months, Fig. 4B), suggesting that the nuclear accumulation of mutant htt is enhanced by aging. Under the same staining condition, no htt aggregates were observed in the brain sections of wild-type littermate control mice. We could not detect transgenic htt expression in neurons, oligodendrocytes, and microglial cells by immunocytochemistry (supplemental Fig. S1).
FIGURE 4.
Age of htt-98Q mice influences accumulation of soluble or aggregated transgenic htt in astrocytes. A, double immunofluorescent staining of mouse brain sections containing the Str and WM from wild-type, htt-98Q, and N171–82Q mice. The staining was performed with mouse 1C2 antibody to htt (red) and rabbit antibody to GFAP (green). Note that mutant htt staining is enriched in GFAP-positive cells in the WM of htt-98Q mice or in neuronal cells of N171–82Q mice. Merged images also show nuclear staining (blue). B, age-dependent accumulation of mutant htt in astrocytes of htt-98Q transgenic mice. Note that mutant htt is diffuse or forms small aggregates in the cytoplasm of astrocytes in young (3 and 9 month) mouse brain and can form nuclear inclusions (arrow) in old (16 month) mouse brain. Scale bars: 10 μm.
Increased Seizure Response of htt-98Q Mice to Glutamate Stimulation
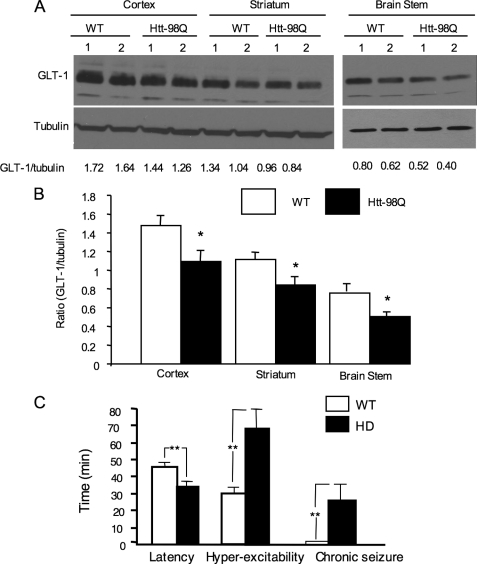
As glial glutamate transporter GLT-1 is reduced in various HD animal models (14, 24–26), we also examined the expression of GLT-1 in htt-98Q mouse brains via Western blotting. The ratio of GLT-1 to tubulin on the same blots was measured to reflect the relative level of GLT-1. The result demonstrates that the level of GLT-1 is decreased in the brain cortex, striatum, and brain stem of htt-98Q mice (Fig. 5A). This difference was verified by quantifying the ratios of GLT-1 to tubulin from the Western blots (Fig. 5B). However, htt-98Q mice live normally and do not show any obvious growth abnormalities under normal housing conditions, a phenomenon that is different from htt-160Q mice that show late-onset neurological phenotypes and early death (14). Thus, the severity of glial dysfunction caused by mutant htt is largely determined by the length of the polyQ repeat.
FIGURE 5.
Increased glutamate-induced seizure in htt-98Q mice. A, Western blot analysis showing decreased levels of GLT-1 in various brain regions of htt-98Q mice as compared with WT mice. The ratios of GLT-1 to tubulin on the same blots are presented beneath the blots. B, quantitative analysis of the ratios of GLT-1 to tubulin from Western blots. Data were obtained from two independent Western blot experiments with 5–6 mouse brain samples for each group. *, p < 0.05 as compared with WT. C, glutamate intraperitoneal injection induced excitotoxicity in wild type and htt-98Q mice. Time (min) for the onset latency and duration of hyperexcitability (wild running, jumping, or circling) and the duration of chronic seizure (tonic-clonic) are presented. *, p < 0.05; **, p < 0.01 (n = 10–11 each group).
Because reduced glutamate uptake can affect neuronal function, administration of glutamate into mice, which elicits excessive activation of excitatory amino acid receptors, may allow us to see more significant phenotypic changes in htt-98Q mice. We therefore administrated monosodium l-glutamate via intraperitoneal (i.p.) injection into mice, a method that has been used to examine animal response to glutamate toxicity (20–23). As expected, htt-98Q mice showed a significant increase in the frequency of circling, jumping, and chronic seizure intensity and duration with a shorter latency (Fig. 5C). Thus, expression of mutant htt in astrocytes can increase the susceptibility of mice to glutamate-induced excitotoxicity.
Expression of Mutant htt in Astrocytes Exacerbates Neurological Symptoms of HD Mice
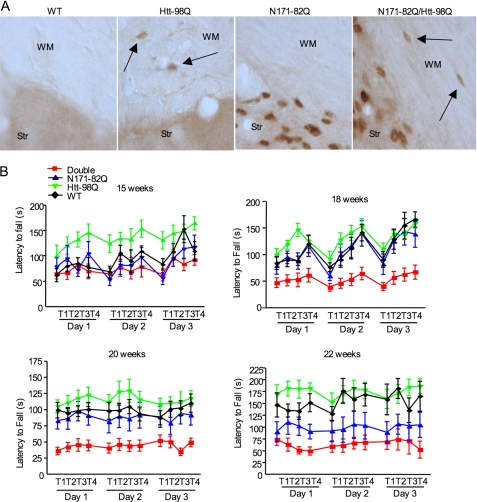
Although htt-98Q mice do not die early or show any obvious neurological phenotypes, these mice allowed us to examine whether the expression of mutant htt in astrocytes can augment HD neurological phenotypes. Thus, we crossed htt-98Q mice with N171–82Q mice, which express the first 171 amino acids of mutant htt with 82Q under the control of the neuronal prion promoter (15). We chose N171–82Q mice because they do not express mutant htt in astrocytes (Fig. 1C), but do show well-characterized neurological phenotypes during early ages (2–5 months), such that any exacerbating effects that stem from glial htt can be readily distinguished. We first verified that mutant htt is expressed in both neuronal and glial cells in double transgenic mice, but not in wild-type littermate controls (Fig. 6A). There is no altered subcellular localization of transgenic htt in astrocytes in double transgenic mouse brains as compared with htt-98Q mouse brains. We then examined the motor function of mice of different genotypes using the rotarod assay to measure the latency to fall from the rotarod. Before 15 weeks, we saw no obvious difference in this performance between double transgenic mice and N171–82Q mice. However, at 18 weeks, there is a significant decrease in the falling latency for double transgenic mice (Fig. 6B), meaning these HD mice performed poorly on this motor function assay. This poor performance worsens progressively as mice become older (22 weeks). Although N171–82Q mice also show obvious motor deficits, the extent of their motor deficit is less severe than that of double transgenic mice (Fig. 6B). A three-way ANOVA (genotype × sex × trial) with repeated measures was also used to analyze the rotarod performance data from mice at the age of 20 weeks. This assay confirmed that genotype (F(3,99) = 119, p < 0.001), but not sex (F(1,99) = 0.001, p = 0.976) or trials (F(3,99) = 1.8, p = 0.16), affected the rotarod performance. Multiple comparison indicates a significant difference (p < 0.001) between htt-98Q and double transgenic, htt-98Q and N171–82Q, WT and double transgenic, or N171–82Q and double transgenic mice. A three-way ANOVA with repeated-measures test on trail 2 of day 2 at 18 weeks also revealed a significant interaction between htt-98Q × N171–82Q × week (F(3,64) = 3.515, p < 0.02), confirming that double transgenic mice do show a significant decrease in rotarod performance with age, which is due to mutant htt expression in both glia and neurons.
FIGURE 6.
Exacerbating effects of glial htt on neurological symptoms of HD mice. A, EM48 immunostaining of brain sections from WT, htt-98Q, N171–82Q, and double transgenic (htt-98Q/N171–82Q) mice. The brain sections contain the WM and Str. Arrows indicate EM48-positive glial cells. B, rotarod performance of WT, htt-98Q, N171–82Q, and double transgenic mice at the ages of 15–22 weeks. Three-day examination (four trials each day) was performed. One-way ANOVA Newman-Keuls Multiple Comparison Test indicates that double transgenic mice show a significant decrease (p < 0.01) in latency to fall than mice of other genotypes.
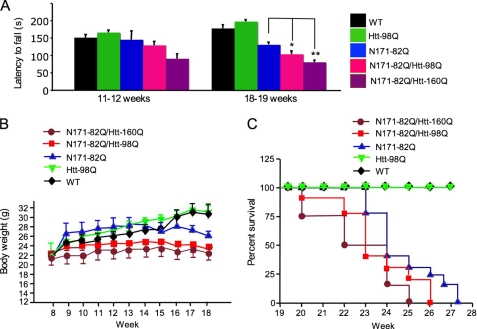
We also crossed htt-160Q with N171–82Q mice. The double transgenic mice carrying htt-160Q showed more severe deficits in rotarod performance than those carrying htt-98Q (Fig. 7A). Furthermore, because body weight loss and early death are typical features of HD mice (15, 23), we compared double transgenic mice and found that they had lower body weight than their littermates with N171–82Q or other genotypes, which is significant (p < 0.05) after the age of 14 weeks (Fig. 7B). Htt-160Q mice do not show a phenotype at the ages tested (14). A three-way ANOVA with repeated measures of mice at 8, 11, 14, and 18 weeks revealed a significant htt-98Q × N171–82Q interaction (F(1,80) = 8.56, p = 0.004), indicating an interaction between the effects of transgenic htt in neurons and glial cells. There is also a significant htt-98Q x N171–82Q x week interaction in mice older than 14 weeks (F(3,80) = 3.41, p = 0.021), confirming that older (>14 weeks) double transgenic mice have less body weight than N171–82Q or htt-98Q mice. Moreover, double transgenic mice carrying both N171–82Q and htt-98Q or htt-160Q die earlier than those carrying only N171–82Q or only htt-98Q transgenes (Fig. 7C). All of these findings provide strong evidence that the expression of mutant htt in astrocytes can worsen the neurological symptoms of HD mice, and this exacerbating effect is dependent on the length of the polyQ repeat in mutant htt.
FIGURE 7.
Neurological phenotypes of double transgenic mice expressing mutant htt in neuronal and glial cells. A, comparison of latency to fall of mice of different genotypes, including double transgenic mice expressing htt-98Q or htt-160Q. Mice at the age of 11–12 or 18–19 weeks (n = 8–12 each group) were compared. *, p < 0.05; **, p < 0.01. B and C, body weight (B, n = 8–10) and survival plot (C, n = 7–11) of mice of different genotypes showing that double transgenic mice lose more body weight (p < 0.05 after 14 weeks) and die earlier than N171–82Q mice.
DISCUSSION
Htt is known to be expressed in various types of cells including neurons and non-neuronal cells. Whereas our recent studies and others (12, 27–29) have demonstrated the presence of mutant htt in glial cells, the in vivo role of glial htt in HD pathology, especially when mutant htt is also expressed in neurons, remains unknown. In this study, we show that mutant htt in astrocytes can indeed exacerbate neurological symptoms in HD mice.
In the brain, glia-neuron interactions are important for maintaining normal function of neurons. In other neurological disorders that are also characterized by selective neurodegeneration such as Alzheimer disease and amyotrophic lateral sclerosis (ALS), the involvement of glial dysfunction has been well documented (30, 31). Our findings also indicate the important role of glial htt in HD pathology, supporting the critical role of glial cells in a variety of neurological disorders. The expression of glial htt may contribute to different extents of neuropathology in various HD mouse models. For example, R6/2 mice, in which exon1 htt is expressed in both glial and neuronal cells, show more severe phenotypes than N171–82Q mice that express mutant htt primarily in neurons. On the other hand, mice expressing the same exon1 in only cortical or striatal neurons show much milder phenotypes than R6/2 mice (6, 32). However, various types of cell-cell interactions and different expression levels of transgenes in these HD mice make it difficult to distinguish the role of mutant htt in glial cells. By expressing mutant htt in mouse astrocytes, we are able to validate the influence of glial htt on HD pathology.
Whereas the N-terminal mutant htt can induce overt neurological symptoms in some transgenic mice, our htt-98Q transgenic mice expressing htt in astrocytes do not show severe neurological phenotypes. This is largely because of the low expression level of transgenic htt in astrocytes. The lower transcription levels of transgenic htt than endogenous mouse htt in our transgenic mouse models support this possibility. Also, glial cells may be able to clear truncated or misfolded htt more efficiently than neurons, which could account for the low level of mutant htt in glia and explains the fact that the number of glial cells showing htt aggregates is lower than neuronal cells in HD mouse brains (5, 12). Another possibility is that the size of mutant htt in our transgenic mice is larger than exon1 and N171 htt. The increased size of transgenic or transfected htt is known to reduce htt misfolding, which may also reduce htt cytotoxicity.
Despite the lack of overt neurological phenotypes in htt-98Q mice, this model allowed us to investigate HD pathology that is not caused by overexpressed mutant htt in astrocytes. The hyperactivity phenotype seen in htt-98Q mice suggests an increased excitotoxicity in these mice. Neuronal excitotoxicity has been proposed to account for the chorea and hyperkinesia seen in HD patients.
The most important issue is whether glial htt can contribute to HD pathology in the context of neuronal mutant htt. Although our recent studies have shown that expression of mutant htt in astrocytes is sufficient to induce late-onset neurological symptoms (14), two important issues remained to be addressed. One is whether glial mutant htt can also exacerbate neurological symptoms when neuronal function has been affected by mutant htt. The other issue is whether mutant htt that carries a smaller polyQ repeat (98Q as compared with 160Q) can still cause glial dysfunction in the brain or contribute to HD neuropathology. Addressing these issues would be important to establish the deleterious role of mutant htt in glial cells and validate the importance of improving glial function in the treatment of HD.
By crossing transgenic mice expressing mutant htt in astrocytes with N171–82Q mice that express mutant htt primarily in neurons, we demonstrated the exacerbating effect of glial htt in HD transgenic mice. This exacerbating effect can be attributed to the decreased expression of GLT-1, a phenomenon that has been observed in a number of HD mouse models (14, 24–26) and HD patient brains (33, 34). Because astrocytes also produce neurotrophic factors and cytokines to regulate the synaptic function and morphology of neurons, it remains to be investigated if mutant htt affects these functions in glial cells. Establishing HD models that express mutant htt in different types of glial cells will allow one to test these possibilities. Moreover, establishment of the role of htt in glial cells will allow us to find therapeutic targets for treating HD by improving glial function.
Supplementary Material
This work was supported, in whole or in part, by National Institutes of Health Grants NS36232 (to X.-J. L.), AG19206 (to X.-J. L.), AG031153 (to S. H. L.), and NS045016 (to S. H. L.).

The on-line version of this article (available at http://www.jbc.org) contains supplemental Fig. S1.
- HD
- Huntington disease
- polyQ
- polyglutamine
- htt
- huntingtin
- GLT-1
- glutamate transporter-1
- GFAP
- glial fibrillary acidic protein
- WM
- white matter
- WT
- wild type
- Str
- striatum.
REFERENCES
- 1.Orr H. T., Zoghbi H. Y. (2007) Annu. Rev. Neurosci. 30, 575–621 [DOI] [PubMed] [Google Scholar]
- 2.Vonsattel J. P., DiFiglia M. (1998) J. Neuropathol. Exp. Neurol. 57, 369–384 [DOI] [PubMed] [Google Scholar]
- 3.Heng M. Y., Detloff P. J., Albin R. L. (2008) Neurobiol. Dis. 32, 1–9 [DOI] [PubMed] [Google Scholar]
- 4.Li S., Li X. J. (2006) Mol. Neurodegener. 1, 19. [DOI] [PMC free article] [PubMed] [Google Scholar]
- 5.Wang C. E., Tydlacka S., Orr A. L., Yang S. H., Graham R. K., Hayden M. R., Li S., Chan A. W., Li X. J. (2008) Hum. Mol. Genet. 17, 2738–2751 [DOI] [PMC free article] [PubMed] [Google Scholar]
- 6.Gu X., Li C., Wei W., Lo V., Gong S., Li S. H., Iwasato T., Itohara S., Li X. J., Mody I., Heintz N., Yang X. W. (2005) Neuron 46, 433–444 [DOI] [PubMed] [Google Scholar]
- 7.Reddy P. H., Williams M., Charles V., Garrett L., Pike-Buchanan L., Whetsell W. O., Jr., Miller G., Tagle D. A. (1998) Nat. Genet. 20, 198–202 [DOI] [PubMed] [Google Scholar]
- 8.Lin C. H., Tallaksen-Greene S., Chien W. M., Cearley J. A., Jackson W. S., Crouse A. B., Ren S., Li X. J., Albin R. L., Detloff P. J. (2001) Hum. Mol. Genet. 10, 137–144 [DOI] [PubMed] [Google Scholar]
- 9.Yu Z. X., Li S. H., Evans J., Pillarisetti A., Li H., Li X. J. (2003) J. Neurosci. 23, 2193–2202 [DOI] [PMC free article] [PubMed] [Google Scholar]
- 10.Myers R. H., Vonsattel J. P., Paskevich P. A., Kiely D. K., Stevens T. J., Cupples L. A., Richardson E. P., Jr., Bird E. D. (1991) J. Neuropathol. Exp. Neurol. 50, 729–742 [DOI] [PubMed] [Google Scholar]
- 11.Sapp E., Kegel K. B., Aronin N., Hashikawa T., Uchiyama Y., Tohyama K., Bhide P. G., Vonsattel J. P., DiFiglia M. (2001) J. Neuropathol. Exp. Neurol. 60, 161–172 [DOI] [PubMed] [Google Scholar]
- 12.Shin J. Y., Fang Z. H., Yu Z. X., Wang C. E., Li S. H., Li X. J. (2005) J. Cell Biol. 171, 1001–1012 [DOI] [PMC free article] [PubMed] [Google Scholar]
- 13.Custer S. K., Garden G. A., Gill N., Rueb U., Libby R. T., Schultz C., Guyenet S. J., Deller T., Westrum L. E., Sopher B. L., La Spada A. R. (2006) Nat. Neurosci. 9, 1302–1311 [DOI] [PubMed] [Google Scholar]
- 14.Bradford J., Shin J. Y., Roberts M., Wang C. E., Li X. J., Li S. (2009) Proc. Natl. Acad. Sci. U.S.A. 106, 22480–22485 [DOI] [PMC free article] [PubMed] [Google Scholar]
- 15.Schilling G., Becher M. W., Sharp A. H., Jinnah H. A., Duan K., Kotzuk J. A., Slunt H. H., Ratovitski T., Cooper J. K., Jenkins N. A., Copeland N. G., Price D. L., Ross C. A., Borchelt D. R. (1999) Hum. Mol. Genet. 8, 397–407 [DOI] [PubMed] [Google Scholar]
- 16.Tydlacka S., Wang C. E., Wang X., Li S., Li X. J. (2008) J. Neurosci. 28, 13285–13295 [DOI] [PMC free article] [PubMed] [Google Scholar]
- 17.Li S. H., Cheng A. L., Zhou H., Lam S., Rao M., Li H., Li X. J. (2002) Mol. Cell. Biol. 22, 1277–1287 [DOI] [PMC free article] [PubMed] [Google Scholar]
- 18.Brenner M., Messing A. (1996) Methods 10, 351–364 [DOI] [PubMed] [Google Scholar]
- 19.Friedman M. J., Shah A. G., Fang Z. H., Ward E. G., Warren S. T., Li S., Li X. J. (2007) Nat. Neurosci. 10, 1519–1528 [DOI] [PubMed] [Google Scholar]
- 20.Arauz-Contreras J., Feria-Velasco A. (1984) Gen. Pharmacol. 15, 391–395 [DOI] [PubMed] [Google Scholar]
- 21.Feria-Velasco A., Feria-Cuevas Y., Gutiérrez-Padilla R. (1995) Arch. Med. Res. 26, S127–132 [PubMed] [Google Scholar]
- 22.Hayase T., Yamamoto Y., Yamamoto K. (2001) J. Pharm. Pharmacol. 53, 1525–1532 [DOI] [PubMed] [Google Scholar]
- 23.Davies S. W., Turmaine M., Cozens B. A., DiFiglia M., Sharp A. H., Ross C. A., Scherzinger E., Wanker E. E., Mangiarini L., Bates G. P. (1997) Cell 90, 537–548 [DOI] [PubMed] [Google Scholar]
- 24.Behrens P. F., Franz P., Woodman B., Lindenberg K. S., Landwehrmeyer G. B. (2002) Brain 125, 1908–1922 [DOI] [PubMed] [Google Scholar]
- 25.Liévens J. C., Woodman B., Mahal A., Spasic-Boscovic O., Samuel D., Kerkerian-Le Goff L., Bates G. P. (2001) Neurobiol. Dis. 8, 807–821 [DOI] [PubMed] [Google Scholar]
- 26.Liévens J. C., Rival T., Iché M., Chneiweiss H., Birman S. (2005) Hum. Mol. Genet. 14, 713–724 [DOI] [PubMed] [Google Scholar]
- 27.Singhrao S. K., Thomas P., Wood J. D., MacMillan J. C., Neal J. W., Harper P. S., Jones A. L. (1998) Exp. Neurol. 150, 213–222 [DOI] [PubMed] [Google Scholar]
- 28.Hebb M. O., Denovan-Wright E. M., Robertson H. A. (1999) FASEB J. 13, 1099–1106 [DOI] [PubMed] [Google Scholar]
- 29.Chou S. Y., Weng J. Y., Lai H. L., Liao F., Sun S. H., Tu P. H., Dickson D. W., Chern Y. (2008) J. Neurosci. 28, 3277–3290 [DOI] [PMC free article] [PubMed] [Google Scholar]
- 30.Clement A. M., Nguyen M. D., Roberts E. A., Garcia M. L., Boillée S., Rule M., McMahon A. P., Doucette W., Siwek D., Ferrante R. J., Brown R. H., Jr., Julien J. P., Goldstein L. S., Cleveland D. W. (2003) Science 302, 113–117 [DOI] [PubMed] [Google Scholar]
- 31.Maragakis N. J., Rothstein J. D. (2006) Nat. Clin. Pract Neurol. 2, 679–689 [DOI] [PubMed] [Google Scholar]
- 32.Gu X., André V. M., Cepeda C., Li S. H., Li X. J., Levine M. S., Yang X. W. (2007) Mol. Neurodegener. 2, 8. [DOI] [PMC free article] [PubMed] [Google Scholar]
- 33.Arzberger T., Krampfl K., Leimgruber S., Weindl A. (1997) J. Neuropathol. Exp. Neurol. 56, 440–454 [DOI] [PubMed] [Google Scholar]
- 34.Hassel B., Tessler S., Faull R. L., Emson P. C. (2008) Neurochem. Res. 33, 232–237 [DOI] [PubMed] [Google Scholar]
Associated Data
This section collects any data citations, data availability statements, or supplementary materials included in this article.


