

Abstract
Gain or loss of whole chromosomes is often observed in cancer cells and is thought to be due to aberrant chromosome segregation during mitosis. Proper chromosome segregation depends on a faithful interaction between spindle microtubules and kinetochores. Several components of the nuclear pore complex/nucleoporins play critical roles in orchestrating the rapid remodeling events that occur during mitosis. Our recent studies revealed that the nucleoporin, Rae1, plays critical roles in maintaining spindle bipolarity. Here, we show association of another nucleoporin, termed Tpr (translocated promoter region), with the molecular motors dynein and dynactin, which both orchestrate with the spindle checkpoints Mad1 and Mad2 during cell division. Overexpression of Tpr enhanced multinucleated cell formation. RNA interference-mediated knockdown of Tpr caused a severe lagging chromosome phenotype and disrupted spindle checkpoint proteins expression and localization. Next, we performed a series of rescue and dominant negative experiments to confirm that Tpr orchestrates proper chromosome segregation through interaction with dynein light chain. Our data indicate that Tpr functions as a spatial and temporal regulator of spindle checkpoints, ensuring the efficient recruitment of checkpoint proteins to the molecular motor dynein to promote proper anaphase formation.
Keywords: Cell Cycle, Dynein, Mitosis, Mitotic Spindle, Nuclear Pore, Oncogene, Chromosome Lagging, Nucleoporin
Introduction
The nuclear pore complex (NPC)3 bridges the inner and outer nuclear membrane to form a channel for both active transport of large molecules and diffusion of smaller molecules between the nucleus and the cytoplasm (1). The vertebrate NPC is composed of about 30 proteins, termed nucleoporins (Nups), each of which is present in multiple copies (1–3). Nucleoporins are modular in that a limited number of structural motifs (coiled-coils, α-solenoids, β-propellers) are used repeatedly to build the symmetrical NPC structure (2, 4, 5).
Nucleoporin Tpr (translocated promoter region) (6) is ∼265 kDa and exists as a coiled-coil-dominated homodimer of extended rod-like shape (7–9). Tpr contains two domains: an N-terminal domain of around 1600 residues that forms a parallel two-stranded coiled-coil, which is interrupted periodically along its length (9–12). The 800 residues of the C-terminal domain are nonhelical and highly enriched in acidic residues (12). Tpr does not possess nucleoporin FG repeats, but it does contain numerous heptad repeat or leucine zipper motifs. Tpr binds to Nup153; when Nup153 is depleted using siRNA, Tpr is released from the NPC into the nucleoplasm (13). Different metazoan species have been shown to contain only one Tpr ortholog; however, two probable homologs exist in both Saccharomyces cerevisiae and Schizosaccharomyces pombe (14). In the budding yeast, these paralogs are called Mlp1 and Mlp2 (15). A homolog has also been identified as a nuclear pore anchor in plants (16). Disruption of either Mlp gene is not lethal and does not notably affect any type of nucleocytoplasmic transport (15).
Mammalian Tpr was named according to its initial isolation from a carcinogen-treated osteogenic sarcoma cell line, as part of a chromosomal translocation (1q25:7q31) that fused N-terminal sequences of Tpr to the kinase domain of the protooncogene, Met (6, 12). Tpr has also been found translocated with NTrk1 (TrkA), the transmembrane tyrosine kinase receptor for nerve growth factor (17). Tpr-NTrk1 is one of several translocations of the NTrk1 receptor that are associated with papillary thyroid carcinoma, the most common type of thyroid cancer (17). Cancer cells also frequently exhibit abnormal numbers of chromosomes (aneuploidy) (18). Mis-segregation of chromosomes may result from various causes, including spindle assembly defects, abnormal centrosome formation, impairments in attachment of spindle microtubules to kinetochores, and failure of cytokinesis (18, 19).
In higher eukaryotes, during cell division, chromosomes undergo condensation, and the nuclear membrane and NPCs are disassembled (20). Recent evidence suggests that several NPC components play critical roles in orchestrating the rapid remodeling events during mitosis (21–26). In particular, we demonstrated that a nucleoporin, RNA export factor 1 (Rae1), interacted with NuMA (19) and the cohesin subunit, SMC1, (27) during mitosis and played crucial roles in proper spindle formation. Recently, Tpr and its homologs have been shown to localize on the spindle pole (28, 29) and also to interact with mitotic arrest-deficient proteins, Mad1 and Mad2 (30, 31). These findings reveal an important role for Tpr during cell division and mitotic spindle checkpoint signaling (31); however, little is known about the basis of Tpr-Mad1 interactions. Mad1 and Mad2 are spindle assembly checkpoint proteins and localize to kinetochores in prophase and generate a signal that inhibits the anaphase-promoting complex until all kinetochores are properly attached to microtubules (32, 33). When correct kinetochore microtubule attachments have been made, Mad1 and Mad2, together with other spindle assembly checkpoint proteins, are removed from kinetochores, the spindle assembly checkpoint is turned off, and sister chromatids segregate (33). In addition, kinetochore-associated dynein drives poleward chromosome movement and contributes to tension generation across sister kinetochores (34–39). Recently, we showed that dynein associated with Rae1 and NuMA (19) to spindle poles for proper spindle organization. In addition to Rae1·NuMA, the dynein motor is involved in many aspects of mitosis and specifically in checkpoint protein transport, such as Mad2 removal from kinetochores at the metaphase–anaphase transition (34, 40). Because spindle checkpoint proteins, such as Mad2 and BubR1, are also removed from kinetochores, the transport contributes to inactivation of the checkpoint (34). Here, we provide several lines of evidence that Tpr through association with the dynein complex spatiotemporally regulated the spindle checkpoint proteins (such as Mad1 and Mad2), thereby preventing aneuploidy formation during metaphase–anaphase transition.
EXPERIMENTAL PROCEDURES
Plasmids
The plasmid encoding full-length human Tpr, tagged with GFP, was a kind gift from Dr. Larry Gerace (The Scripps Research Institute). Three Tpr fragments (N, M, and C) were subcloned by PCR from pEGFPC1-Tpr into pET28a-FLAG, (pET28a modified to contain a C-terminal FLAG epitope together with an N-terminal His6 tag). HeLa cell cDNA was synthesized using a SuperScriptTM III CellsDirect cDNA Synthesis System kit (Invitrogen). The full-length dynein intermediate (DIC) chain, dynein light chain (DLC/DYNLL1/DLC8), and the Mad1 coding regions were PCR-amplified from cDNAs and subcloned into pEGFP-C1 (Clontech Laboratories) or into pET28a-GST. GFP-H2B plasmid was from Addgene. The details of expression constructs and cloning primers are listed in supplemental Table 1. All constructs were confirmed by DNA sequencing. Sequence analyses were performed at the DNA sequencing facility of the Kanazawa University Cancer Research Institute using a PRISM3100-AvantGenetic Analyzer (Applied Biosystems). DNA and protein data bases were searched using the BLAST or BLAT search algorithms at the NCBI.
Mammalian Cell Culture, Transfections, and Synchronization
HeLa, HEK293T, MCF7 and NIH3T3 cells were obtained from the American Type Culture Collection (ATCC) and were synchronized in S phase by double thymidine block using 2 mm thymidine (19, 27, 41, 42). HeLa cells were transfected with GFP-Tpr (full-length) plasmid using Turbofect, following the manufacturer's protocol (Fermentas). The HeLa EGFP-H2B cell line was generated by transfection of EGFP-H2B cDNA to HeLa cells and maintained in G418 (600 μg/ml). The HeLa EGFP-H2B cell line was used for analysis of mitotic progression.
RNA Interference
siRNA duplexes targeting Tpr (sc-45343), dynein HC siRNA (sc-43738), and control siRNA (sc-37007) were purchased from Santa Cruz Biotechnology. siRNA transfections were performed using Lipofectamine 2000, following the manufacturer's protocol (Invitrogen) (19, 27, 41, 42). HeLa cells were transfected 24 h before the initiation of the first thymidine block and collected or imaged 72 h after transfection. If necessary, transfection efficiency was monitored with Block-iT (Invitrogen).
Antibodies, Immunocytochemistry, and Confocal Microscopy
α-Tpr polyclonal antibody was a kind gift from Dr. Larry Gerace (12). α-Dynein monoclonal antibody (D5167) (clone 74.1) was from Sigma-Aldrich. α-DLC monoclonal (sc-80295), α-Mad1 (sc47746), α-CENP-E (sc56286) and α-Mad2 (sc-47747) antibodies were from Santa Cruz Biotechnology. α-Dynactin (612709) monoclonal antibody was from BD. α-Tubulin (DM1A) monoclonal antibody and γ-tubulin antibody were from Sigma-Aldrich. α-Nup153 (ab24700) and α-GFP (ab6556) antibodies were from Abcam, α-m414(MMS-120R) antibody was from COVANCE. Anti-GST(30001) antibody was from Thermo-Scientific. Secondary antibodies were from Molecular Probes. For immunofluorescence, synchronized HeLa cells were washed in phosphate-buffered saline and fixed for 10 min in 4% paraformaldehyde in phosphate-buffered saline. Cells were then permeabilized with 0.2% Triton X-100 in phosphate-buffered saline for 10 min at room temperature. Samples were mounted onto coverslips with ProLong Gold Antifade reagent (Invitrogen) and were examined on a Zeiss LSM5 EXCITER confocal microscope, and all images were acquired using an aplan-Apochromat 63X with a 1.4-N.A. objective or at 100 × with a 1.4-N.A. objective.
Immunoprecipitations
For immunoprecipitations, ∼107 cells were seeded and synchronized as described above. Mitotic HeLa cells were collected, washed with phosphate-buffered saline, spun at 400 × g for 10 min, and lysed in 1 ml of cold lysis buffer (50 mm Tris-HCl (pH 7.2), 250 mm NaCl, 0.1% Nonidet P-40, 2 mm EDTA, 10% glycerol) containing 1× protease inhibitor mixture (Roche Applied Science) and 1 mm phenylmethylsulfonyl fluoride. Lysates were centrifuged for 30 min at 4 °C at 14,000 × g. The resulting lysate supernatants were precleared with 50 μl of protein A/G bead slurry (Santa Cruz Biotechnology), mixed with 10 μl of various antibodies as specified, and incubated for 1 h at 4 °C with rocking. The beads were then washed five times with 500 μl of lysis buffer. After the last wash, 50 μl of 1× SDS-PAGE blue loading buffer (New England Biolabs) was added to the bead pellet before loading.
Expression of Recombinant Proteins
For expression of Tpr fragments, Escherichia coli BL21(DE3)-Condon plus cells and pLys cells (Stratagene) were grown at 37 °C to an A600 of 0.6 and induced with 0.5 mm isopropyl-β-d-thiogalactopyranoside at 18 °C for 7 h. The cells were harvested by centrifugation and lysed in buffer containing 100 mm Tris-HCl (pH 8.0), 200 mm NaCl, 1 mm phenylmethylsulfonyl fluoride, and Complete EDTA-free protease inhibitor mixture tablets (Roche Applied Science). The cells were lysed with a cell sonicator (SMT), and the lysate was clarified by centrifugation at 15,000 × g for 60 min. The proteins containing the His6 tag were purified by nickel-affinity (Qiagen) chromatography, and proteins containing the GST tag were purified by glutathione affinity (GE Healthcare).
Biochemical “Cell-free” Binding Assays
Proteins were expressed using the Promega TNT coupled transcription/translation system according to the manufacturer's protocol or described previously (19, 27). Each GST-tagged protein was loaded onto glutathione-agarose beads (GE Healthcare) in lysis buffer (50 mm Tris-HCl (pH 7.7), 150 mm KCl, 0.1% Triton-X100, 1 × protease inhibitor mixture) for 1 h at 4 °C. The beads were washed with wash buffer (50 mm Tris-HCl (pH 7.7), 300 mm KCl) and incubated with in vitro translated proteins for 2 h at 4 °C. The beads were then washed five times with wash buffer. After the last wash, 1 × SDS-PAGE blue loading buffer was added to the beads before loading.
Time-lapse Microscopy
Time-lapse analysis of histone dynamics during metaphase and anaphase transition in live cells was recorded by GFP-H2B stable cell lines. Cells were placed in a microincubation chamber (7136; Corning) on the stage of a Zeiss LSM5 confocal microscope, which was heated to 37 °C and equipped with CO2 supply (Electric CO2 Microscope Stage Incubator; OKO Lab). Time-lapse series were generated by collecting photographs every 3 min; the photographs were then converted to 8-bit images and processed by Adobe Photoshop CS2 and QuickTime software.
RESULTS
Tpr and Dynein Form a Transient Complex during Mitosis
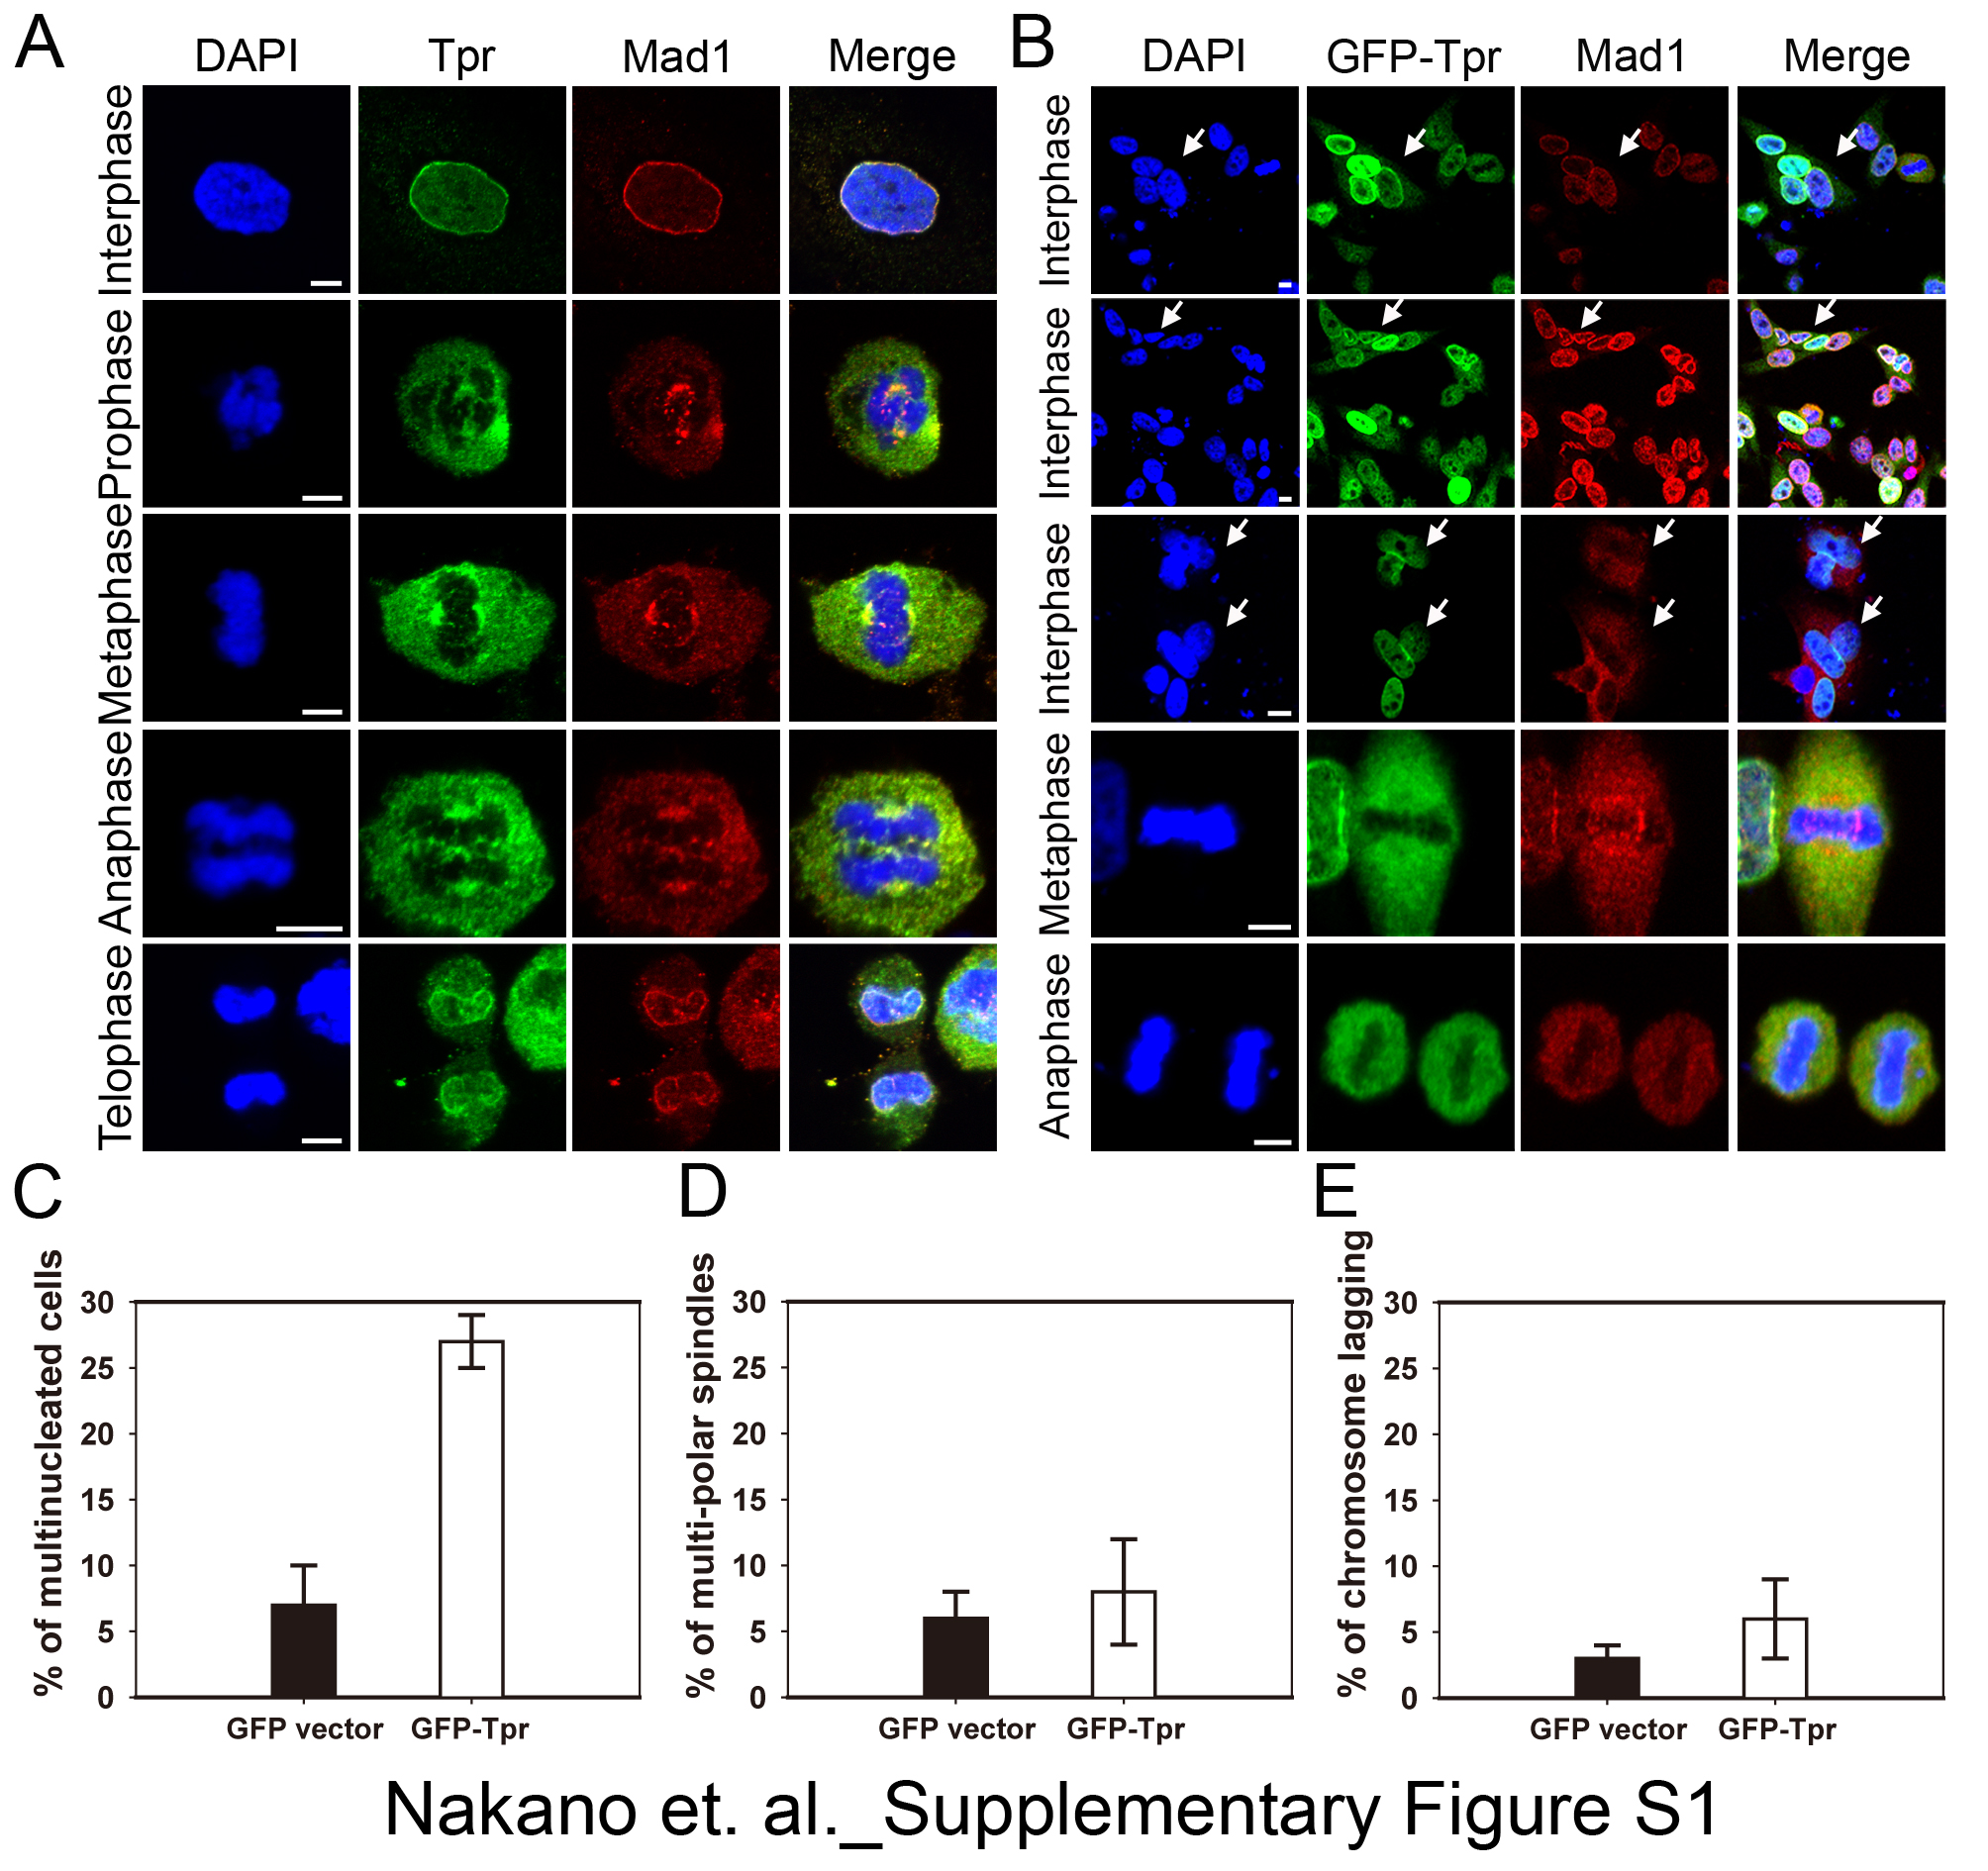
Tpr interacted with spindle checkpoints throughout the cell cycle (31), and we found that Tpr overexpression enhanced multinucleation and aneuploidy formation (supplemental text and supplemental Fig. S1). We hypothesized that Tpr may spatiotemporally regulate the recruitment of the checkpoint proteins, to the dynein complex during the metaphase–anaphase transition.
Before testing this hypothesis, we first examined whether Tpr was associated with the dynein complex in HeLa cells that were synchronized by a double thymidine block. By immunoblotting anti-Tpr immunoprecipitates, we detected coprecipitating dynein, along with dynactin (p150-Glued), DLC, Mad1, Mad2, and Nup153 (Fig. 1A, left). Conversely, using anti-dynein antibodies, we immunoprecipitated Tpr and dynactin (p150), DLC, Mad1, Mad2, but not Nup153 (Fig. 1A, right). These data suggested that Tpr interacts with the dynein complex. Consistent with the immunoprecipitation data, we found that Tpr colocalized transiently with tubulin, dynactin and dynein (Fig. 1, B–D, and supplemental Fig. S2, A–C) from prophase to anaphase. Moreover, we also found that Tpr partially localized on the kinetochores (CENP-E as kinetochore metaphase–anaphase marker) (supplemental Fig. S2D). These data suggest that a population of Tpr transiently colocalized with the dynein complex at the metaphase–anaphase transition.
FIGURE 1.

Tpr colocalizes with the dynein complex on microtubules during mitotic metaphase–anaphase transition. Comparison of the mitotic distribution of Tpr with tubulin, dynactin and dynein (DIC 74.1) is shown. A, biochemical characterization of the Tpr·Mad2·Mad1 subcomplex and the molecular motor dynein complex during mitosis. Immunoprecipitates (IP) from mitotic HeLa cell extracts with anti-Tpr, anti-dynein (74.1), or nonspecific rabbit antibodies (IgG) were analyzed by SDS-PAGE, followed by immunoblotting with Tpr, dynein (74.1), dynactin (p150), DLC, Mad1, Mad2, and Nup153 antibodies. In lanes marked Input, 20 μl of the 500 μl of extract that was used per immunoprecipitation (IP) was analyzed directly. B, confocal microscopic images of HeLa cells at different mitotic stages, stained with anti-Tpr antibody (red), α-tubulin antibody (green), and DAPI (blue). White arrows indicate typical transient colocalization. Scale bars, 5 μm. C, confocal microscopic images of HeLa cells at different mitotic stages, stained with anti-Tpr antibody (red), dynactin (p150) antibody (green), and DAPI (blue). White arrows indicate typical transient colocalization. Scale bars, 5 μm. D, confocal microscopic images of HeLa cells at different mitotic stages, stained with anti-Tpr antibody (red), dynein (74.1) antibody (green), and DAPI (blue). White arrows indicate typical transient colocalization. Scale bar, 5 μm.
Depletion of Dynein Disrupted the Localization of Tpr during Mitosis
We further investigated whether endogenous DLC/DYNLL1 (a region used to transport cargoes/protein complexes) interacted with Tpr during mitosis. In digitonin-permeabilized HeLa cells, Tpr localized to kinetochores, and colocalized with DLC at the mitotic spindles (Fig. 2A). To examine more closely the binding of Tpr to DLC, which was suggested by the confocal microscopy data (Fig. 2A), and to map biochemically the region of Tpr that interacts with DLC, we constructed three cDNA fragments covering the entire length of Tpr (named Tpr-N(1–774aa), Tpr-M(775–1700aa), and Tpr-C(1701–2351aa), respectively) (Fig. 2B) and expressed them in a cell-free reticulocyte translation system. Next, we performed GST pulldown assays. Only the Tpr-M fragment interacted directly with GST-DLC, but not with the GST vector (Fig. 2C and supplemental Fig. S3). In addition, as a control, we confirmed that GST-Mad1 interacted with Tpr-N(1–774) (31).
FIGURE 2.

Tpr interacts with dynein light chain. A, HeLa cells were stained with anti-Tpr (green) and anti-DLC antibodies for immunofluorescence visualization and examined by confocal microscopy. Scale bars, 5 μm. B, schematic of the four Tpr fragments. Numbers on the left refer to amino acids; all fragments are continuous (e.g. Tpr-N ends at amino acid 774, and Tpr-M starts at amino acid 775). C, Tpr fragments expressed in vitro, affinity-purified together with GST, GST-DLC, and GST-Mad1, and separated by SDS-PAGE. Tpr fragments were prepared from TNT Quick-Coupled Transcription/translation system (Promega) together with TranscendTM Biotin-Lysyl-tRNA (Promega). Detection was done by streptavidin horseradish peroxidase (HRP) (1:4,000). Tpr fragments were untagged. Numbers indicate molecular masses markers in kilodaltons. D, representative images of mitotic HeLa cells transfected with plasmids overexpressing GFP-Tpr (full-length). 48 h after transfection, cells were fixed, stained with anti-DLC antibody (red in overlay; GFP is green), and analyzed by confocal laser microscopy. Chromatin was stained with DAPI (blue). Scale bars, 5 μm. White arrows indicate typical multinucleated cell.
Knockdown of Dynein in Vertebrates Abolished Kinetochore Localization of Tpr
To determine whether dynein regulated the function of Tpr, we first analyzed the overexpression of GFP-Tpr (full-length) in HeLa cells. We found that the dynein staining localized to the kinetochore or spindle was more diffuse (Fig. 2D) compared with the endogenous staining (Fig. 2A). Next, we employed a dynein siRNA knockdown approach. Immunoblot analysis of HeLa cells subjected to dynein siRNA treatment for 3 days revealed an ∼85% reduction of dynein compared with controls (Fig. 3A, left). The same immunoblot membrane was reprobed with tubulin to ensure equivalent loading (Fig. 3A, right). Moreover, we did not find any significant changes in Mad1 and Mad2 expression (Fig. 3B). We also found that the number of multinucleated cells increased (Fig. 3D). Loss of dynein had little, if any, effect on Tpr protein levels, as estimated by immunofluorescence and immunoblotting experiments (Fig. 3, B and D).
FIGURE 3.

Dynein siRNA treatment abolished Tpr kinetochore localization and caused abnormal chromosome congression and defective mitosis. A, effects of dynein depletion on protein levels of Tpr-associated proteins. Lysates of control siRNA-transfected HeLa cells (control) and of HeLa cells, 72 h after transfection with dynein siRNAs (Dynein RNAi) were analyzed by immunoblotting (IB) with the indicated antibodies. The same membrane was stripped and reprobed with anti-α-tubulin (as loading control). B, dynactin (p150) was significantly reduced in the dynein-depleted samples, whereas Tpr, Mad1, and Mad2 were not affected. C, quantification (relative %) of chromosome lagging and multipolar spindle phenotypes in the mock and dynein siRNA-transfected cells. Values are based on three independent experiments, counting 100 mitotic cells in each experiment. Mean values ± S.D. (error bars) are shown. All cells were treated with double thymidine block, stained with DAPI, and visualized by confocal microscopy. D, representative images of mitotic HeLa cells, transfected with either siRNA duplex against dynein. 72 h after transfection, cells were stained with anti-Tpr antibody (red) or dynein antibody (green) and analyzed by confocal laser microscopy. Chromatin was stained with DAPI (blue). Scale bar, 5 μm. Tpr displayed nuclear rim staining. Mitotic Tpr was dramatically reduced at the kinetochores, 72 h after transfection with dynein-specific siRNAs. White arrows indicate a typical chromosome-lagging cell.
We next assessed chromosome defects and Tpr localization in dynein-depleted HeLa cells using antibodies against dynein and Tpr. In this way, cells specifically depleted of dynein could be observed and quantified using confocal microscopy. Notably, depletion of dynein abolished Tpr localization at the kinetochore, in contrast with its endogenous expression pattern (Fig. 1); however, Tpr was still localized in the nuclear rim during the interphase (Fig. 3D). We further found the accumulation of abnormal, or the ineffective congression of chromosomes, at the metaphase plates. In particular, “chromosome lagging” and multipolar phenotypes were increased by 25 and 21%, respectively (Fig. 3, C and D). Taken together, these observations demonstrate that knockdown of dynein in vertebrates abolished kinetochore localization of Tpr. We speculate that once Tpr is no longer localized on kinetochores, chromosome lagging phenotypes are enhanced.
Knockdown of Tpr Enhanced Chromosome Lagging
The above results prompted us to test the consequences of Tpr depletion on dynein localization. Immunoblot analysis of HeLa cells subjected to Tpr siRNA treatment for 3 days revealed a ∼75% reduction of Tpr compared with control cells (Fig. 4A, left). The same immunoblot membrane was reprobed with tubulin to ensure equivalent loading (Fig. 4A, right). Double staining with m414, a nuclear pore marker, showed that loss of Tpr had little, if any, effect on the nuclear rim staining, which retained its usual punctuate distribution.4 Furthermore, when Tpr knockdown was not complete (Fig. 4C, white asterisk), some dynein was still localized in kinetochores (Fig. 4C). On the other hand, when Tpr was almost completely knocked down, dynein localization was abolished from kinetochores, and chromosome separation defects were found (Fig. 4, C and E, white arrows). Notably, mitotic Tpr siRNA treatment (Fig. 4D) was consistently associated with abnormal congression of chromosomes at the metaphase or anaphase plate (Fig. 4, E–G and supplemental Fig. S4, white arrow). Most importantly, more than 39% of anaphase cells had lagging chromosomes, whereas these defects were not found in control cells (Fig. 4, E–G) in three independent experiments (n = 300 mitotic cells). To support this lagging chromosomes notion further, we performed live cell imaging siRNA Tpr or control siRNA transfected into GFP-H2B stable cell lines. We recorded the live cell imaging video of the lagging chromosomes phenotypes in siRNA Tpr GFP-H2B cell lines very easily (supplemental Fig. S5 and supplemental video 2), but they were rarely found in control (supplemental Fig. S5 and supplemental video 1). Together, these data strongly indicated that knock-down Tpr causes lagging chromosomes enhanced aneuploidy formation.
FIGURE 4.

Chromosome lagging, abnormal chromosome congression, and defective mitosis after Tpr siRNA treatment. A, effects of Tpr siRNA treatment on protein levels of Tpr-associated proteins. Lysates of control siRNA-transfected HeLa cells (control) and of HeLa cells, 72 h after transfection with Tpr siRNAs (Tpr RNAi) were analyzed by immunoblotting with the indicated antibodies. The same membrane was stripped and reprobed with anti-α-tubulin (as loading control). B, Mad1 was significantly reduced in the Tpr-depleted samples, whereas dynein and dynactin (p150) were not affected. C, representative images of asynchronous HeLa cells, transfected with either siRNA duplex against Tpr. 72 h after transfection, cells were stained with anti-Tpr antibody (green) and anti-dynein (red) and analyzed by confocal laser microscopy. Chromatin was stained with DAPI (blue). Scale bar, 5 μm. Tpr still displayed normal nuclear rim staining in a few HeLa cells. Mitotic dynein was still partially localized at kinetochores 72 h after transfection with Tpr-specific siRNAs (asterisks). White arrows indicate cells with chromosome defects when Tpr was completely depleted. D, schedule of collecting mitotic HeLa cells after siRNA Tpr depletion. E–G, representative images of mitotic HeLa cells, transfected with either siRNA duplex against Tpr. 72 h after transfection, cells were stained with (E) anti-dynein (red), (F) anti-Mad1 (red), (G) anti-Mad2 (red) antibodies, anti-Tpr antibody (green), and analyzed by confocal laser microscopy. Chromatin was stained with DAPI (blue). Scale bars, 5 μm. Abnormal chromosome congression, multipolar phenotypes, and chromosome lagging were often found. White arrows indicate cells with chromosome lagging. Mitotic Mad1 signal was reduced at the kinetochores 72 h after transfection with Tpr-specific siRNAs.
Knockdown of Tpr Also Reduced Mad1 Expression and Abolished Mad1/Mad2 Localization during Metaphase–Anaphase Transition
Moreover, to determine whether the observed Tpr depletion phenotypes are different manifestations of the same defects or whether mitotic roles of Tpr can be uncoupled, we employed a rescue strategy by overexpressing GFP-Tpr (full-length) in Tpr knockdown cells. 24 h after transfection of GFP-Tpr (full-length) into Tpr RNAi knockdown cells, the lagging chromosome phenotypes were partially rescued (Fig. 5C and supplemental Fig. S6A). Indeed, a clear point revealed by this rescue strategy is that Tpr is the “criminal protein” causing lagging chromosomes. In light of these observations, it is worth noting that the Tpr knockdown was likely to be partial, and all RNAi experiments, dynein and Tpr, are interpreted with respect to this consideration. Nevertheless, these data suggest that normal metaphase–anaphase transition requires balanced concentrations of dynein, Mad1, and Tpr. Further, we also confirmed these severe chromosome-lagging phenotypes in other two cancer cell lines (MCF7 and HEK293T cells) and less frequently were found in NIH3T3 (normal cells) (supplemental Fig. S7, white arrow). Thus, we have demonstrated that knockdown of Tpr generated aneuploidy-chromosome lagging.
FIGURE 5.

Overexpression of GFP-Tpr N-terminal region (1–774) would mimic the Tpr siRNA (Mad1 reduction) phenotype. A, representative images of mitotic HeLa cells transfected with plasmids overexpressing GFP-Tpr-N(1–774aa). 48 h after transfection, cells were fixed, stained with anti-dynein antibodies or with anti-Mad1 antibodies (red in overlay; GFP is green), and analyzed by confocal laser microscopy. Chromatin was stained with DAPI (blue). Scale bars, 5 μm. Tpr-N binds to Mad1; therefore, functional Mad1 is sequestered from kinetochores, reducing the Mad1 signal. Again, typical chromosome lagging was found in Tpr-N-transfected cells. White arrows indicate chromosome lagging. B, representative images of mitotic HeLa cells transfected with plasmids overexpressing GFP-Mad1 (full-length). 48 h after transfection, cells were fixed, stained with anti-Tpr antibodies or with anti-Mad2 antibodies (red in overlay; GFP is green), and analyzed by confocal laser microscopy. Chromatin was stained with DAPI (blue). Scale bars, 5 μm. Mad1 binds to Tpr; therefore, functional Tpr is sequestered from kinetochores, mimicking Tpr depletion. As predicted, typical chromosome lagging was found in Tpr-N-transfected cells. White arrows indicate chromosome lagging. C, quantification (relative %) of chromosome lagging in the control siRNA, Tpr siRNA, overexpressed GFP-Tpr (full-length) 24 h following Tpr siRNA, GFP-Tpr-N alone, and GFP-Mad1 alone, transfected cells. Values are based on three independent experiments counting 100 mitotic cells in each experiment. Mean values ± S.D. (error bars) are shown. All cells were treated with double thymidine block, stained with DAPI, and visualized by confocal microscopy.
Finally, we tested our hypothesis that Tpr spatiotemporally regulates the recruitment of Mad1 and Mad2 to the dynein complex during the metaphase–anaphase transition. In siRNA-mediated Tpr knockdown HeLa cells, we found that Mad1 protein levels were surprisingly decreased by 40%, whereas the amounts of Mad2 and dynein complex proteins were largely unaltered (Fig. 4B). However, localization of Mad1 and Mad2 at the kinetochore was abolished (Fig. 4, F and G). In addition, Tpr depletion caused severe chromosome abnormalities; blended chromosomes (Fig. 4E) and supernumerary spindles (in ∼27% of cells) were found (Fig. 5C and supplemental Fig. S4). We found that 72 h after transfection with siRNA duplexes targeting Tpr, a high proportion (39%) of cells displayed a strikingly altered lagging chromosome morphology compared with controls (Fig. 5C). The extra lagging chromosome appeared to fail to pull chromosomes away from the main spindle, contributing to serious chromosome-alignment defects. Importantly, Tpr siRNA-treated cells abolished the localization of dynein, Mad1, and Mad2 at spindle poles (Fig. 4, E–G, and supplemental Fig. S4). Mad1 interacts with the N-terminal region of Tpr (Fig. 2C) (31); therefore, if our hypothesis was correct, overexpression of GFP-Tpr N-terminal region (1–774) would mimic the Tpr siRNA (Mad1 reduction) phenotype through sequestration of endogenous Mad1, and the chromosome abnormalities would reappear. We examined the effect of expressing this domain (Tpr-N) in HeLa cells to challenge our hypothesis further. Consistent with our prediction, chromosome lagging was observed in 30% of these cells (Fig. 5, A and C, and supplemental Fig. S6B). To gather further evidence for this, we carried out transient overexpression of GFP-Mad1 in HeLa cells because enhanced GFP-Mad1 expression should also mimic the Tpr siRNA phenotypes through sequestration of endogenous Tpr, and, again, chromosome abnormalities ought to reappear. Again, we found that chromosome lagging was observed in 30% of GFP-Mad1 mitotic cells (Fig. 5, B and C). In addition, cells showing unequal chromosome segregation were also found (supplemental Fig. S6B, white asterisk). A highly plausible interpretation of these results is that the N-terminal region of Tpr and GFP-Mad1 bind to and sequester endogenous Mad1 and Tpr, respectively. This would disrupt the efficient interaction between Mad1 and Tpr and would be analogous to the RNAi knockdown of Tpr.
DISCUSSION
Our findings suggest that Tpr spatiotemporally regulates the recruitment of spindle checkpoint proteins (e.g. Mad1 and Mad2) to the dynein complex during the metaphase–anaphase transition (Fig. 6) prevent chromosome lagging. Because dynein is a minus end-directed motor, it is responsible for transporting many proteins and/or complexes from kinetochores to centrosomes, where the minus ends of microtubules are anchored (36, 37, 43). We and others showed previously that the dynein motor complex positions mitotic spindle poles and is responsible for targeting the NuMA and Rae1 to spindle poles, where Rae1·NuMA subcomplex focuses and stabilizes microtubule ends and tethers them to the centrosomes (19, 44). Dynein is also recruited to kinetochores where it is reported to play a role in spindle assembly checkpoint inactivation by transporting checkpoint proteins away from properly attached kinetochores (34, 45, 46). Overall, our data show that Tpr interacted directly with dynein motor complex during mitosis (Figs. 1 and 2) and that these interaction are biologically functional and very crucial for proper checkpoint inactivation. Altering either Tpr and dynein concentration produces defects on spindle polarity (Figs. 3C, 4, E–G, and 5C) and chromosome lagging (Figs. 3, C and D, and 4, E–G; supplemental Fig. S5 and supplemental video 2).
FIGURE 6.

Model of Tpr·Mad1 poleward transport of the kinetochore protein complex, driven by the dynein complex, along the spindle microtubules to inactivate spindle checkpoint activity at the kinetochores. Tpr and checkpoint protein complexes (Mad1·Mad2) are transported poleward by dynein/dynactin, where they dissociate into the cytoplasm. Correct Tpr-Mad1 interaction is critical for proper anaphase formation.
When Tpr levels are further depleted, many cells display abnormal spindle polarity, bending chromosomes, and chromosome lagging (Fig. 4, E–G, supplemental Fig. S5, and supplemental video 2). These phenotypes could reflect a direct role for Tpr in forming spindle structure. Alternatively, disruption of proper chromosome dynamics during mitosis is known to result in a similar nuclear morphology and indeed has been the basis of a screen for mitotic regulators (20, 47–49). We found in live imaging analysis significant chromosome lagging in mitosis under these conditions of Tpr knockdown. Based on the Tpr siRNA results, we performed a series of assays to rescue the chromosome-lagging defects in Tpr knockdown cells to confirm further the functional role of the Tpr-dynein interaction with the mitotic spindle (Fig. 5). This supports a model in which Tpr function impacts progression out of metaphase–anaphase transition and/or chromosome segregation itself, and the miscoordination that follows results in aberrant chromatin morphology (Fig. 6).
Most cancers exhibit a complex pattern of chromosomal abnormalities, showing both chromosome gains and/or losses, together with structural aberrations; therefore, we speculate that the spatiotemporal regulation of checkpoint proteins by Tpr·dynein complex is important in the deregulation of growth control found in cancer cells. It is worth noting that the Tpr-Met oncogene, a carcinogen-induced chromosomal rearrangement, resulting in a protein dimerization domain of Tpr fused to the receptor tyrosine kinase domain of Met, has been described (17, 31, 50). Given the data presented here of the chromosome lagging and congressional defects at the metaphase–anaphase transition, it is also reasonable to propose that chromosomal rearrangement of Tpr could lead to chromosomal instability in certain tumors. Future experiments, using genetically altered Tpr rodents, should investigate this model.
Supplementary Material
Acknowledgment
We thank Larry Gerace for the Tpr plasmids and antibodies.
This work was supported by the Program for Improvement of Research Environment for Young Researchers from the Special Coordination Funds for Promoting Science and Technology (SCF), grants-in-aid for young scientists (B), from (Ministry of Education, Culture, Sports, Science and Technology), Japan, and by grants from the Takeda Science Foundation, the Astellas Foundation for research on metabolic disorders, and The Novartis Foundation (Japan) (to R. W. W.).

The on-line version of this article (available at http://www.jbc.org) contains supplemental text, Figs. S1–S7, Table 1, and Videos 1 and 2.
H. Nakano, T. Funasaka, C. Hashizume, and R. W. Wong, unpublished data.
- NPC
- nuclear pore complex
- Nup
- nucleoporin
- Tpr
- translocated promoter region
- siRNA
- small interfering RNA
- Rae1
- RNA export factor 1
- Mad
- mitotic arrest-deficient
- GFP
- green fluorescent protein
- EGFP
- enhanced GFP
- DIC
- dynein intermediate chain
- DLC
- dynein light chain
- RNAi
- RNA interference.
REFERENCES
- 1.Terry L. J., Shows E. B., Wente S. R. (2007) Science 318, 1412–1416 [DOI] [PubMed] [Google Scholar]
- 2.Lim R. Y., Ullman K. S., Fahrenkrog B. (2008) Int. Rev. Cell. Mol. Biol. 267, 299–342 [DOI] [PMC free article] [PubMed] [Google Scholar]
- 3.Tran E. J., Wente S. R. (2006) Cell 125, 1041–1053 [DOI] [PubMed] [Google Scholar]
- 4.Brohawn S. G., Partridge J. R., Whittle J. R., Schwartz T. U. (2009) Structure 17, 1156–1168 [DOI] [PMC free article] [PubMed] [Google Scholar]
- 5.Debler E. W., Blobel G., Hoelz A. (2009) Nat. Struct. Mol. Biol. 16, 457–459 [DOI] [PubMed] [Google Scholar]
- 6.Mitchell P. J., Cooper C. S. (1992) Oncogene 7, 383–388 [PubMed] [Google Scholar]
- 7.Byrd D. A., Sweet D. J., Panté N., Konstantinov K. N., Guan T., Saphire A. C., Mitchell P. J., Cooper C. S., Aebi U., Gerace L. (1994) J. Cell Biol. 127, 1515–1526 [DOI] [PMC free article] [PubMed] [Google Scholar]
- 8.Cordes V. C., Reidenbach S., Rackwitz H. R., Franke W. W. (1997) J. Cell Biol. 136, 515–529 [DOI] [PMC free article] [PubMed] [Google Scholar]
- 9.Bangs P., Burke B., Powers C., Craig R., Purohit A., Doxsey S. (1998) J. Cell Biol. 143, 1801–1812 [DOI] [PMC free article] [PubMed] [Google Scholar]
- 10.Cordes V. C., Hase M. E., Müller L. (1998) Exp. Cell Res. 245, 43–56 [DOI] [PubMed] [Google Scholar]
- 11.Hase M. E., Kuznetsov N. V., Cordes V. C. (2001) Mol. Biol. Cell 12, 2433–2452 [DOI] [PMC free article] [PubMed] [Google Scholar]
- 12.Frosst P., Guan T., Subauste C., Hahn K., Gerace L. (2002) J. Cell Biol. 156, 617–630 [DOI] [PMC free article] [PubMed] [Google Scholar]
- 13.Hase M. E., Cordes V. C. (2003) Mol. Biol. Cell 14, 1923–1940 [DOI] [PMC free article] [PubMed] [Google Scholar]
- 14.Kuznetsov N. V., Sandblad L., Hase M. E., Hunziker A., Hergt M., Cordes V. C. (2002) Chromosoma 111, 236–255 [DOI] [PubMed] [Google Scholar]
- 15.Strambio-de-Castillia C., Blobel G., Rout M. P. (1999) J. Cell Biol. 144, 839–855 [DOI] [PMC free article] [PubMed] [Google Scholar]
- 16.Xu X. M., Rose A., Muthuswamy S., Jeong S. Y., Venkatakrishnan S., Zhao Q., Meier I. (2007) Plant Cell 19, 1537–1548 [DOI] [PMC free article] [PubMed] [Google Scholar]
- 17.Xu S., Powers M. A. (2009) Semin. Cell Dev. Biol. 20, 620–630 [DOI] [PMC free article] [PubMed] [Google Scholar]
- 18.Rao C. V., Yamada H. Y., Yao Y., Dai W. (2009) Carcinogenesis 30, 1469–1474 [DOI] [PMC free article] [PubMed] [Google Scholar]
- 19.Wong R. W., Blobel G., Coutavas E. (2006) Proc. Natl. Acad. Sci. U.S.A. 103, 19783–19787 [DOI] [PMC free article] [PubMed] [Google Scholar]
- 20.Mackay D. R., Elgort S. W., Ullman K. S. (2009) Mol. Biol. Cell 20, 1652–1660 [DOI] [PMC free article] [PubMed] [Google Scholar]
- 21.Güttinger S., Laurell E., Kutay U. (2009) Nat. Rev. Mol. Cell Biol. 10, 178–191 [DOI] [PubMed] [Google Scholar]
- 22.Orjalo A. V., Arnaoutov A., Shen Z., Boyarchuk Y., Zeitlin S. G., Fontoura B., Briggs S., Dasso M., Forbes D. J. (2006) Mol. Biol. Cell 17, 3806–3818 [DOI] [PMC free article] [PubMed] [Google Scholar]
- 23.Galy V., Askjaer P., Franz C., López-Iglesias C., Mattaj I. W. (2006) Curr. Biol. 16, 1748–1756 [DOI] [PubMed] [Google Scholar]
- 24.Belgareh N., Rabut G., Baï S. W., van Overbeek M., Beaudouin J., Daigle N., Zatsepina O. V., Pasteau F., Labas V., Fromont-Racine M., Ellenberg J., Doye V. (2001) J. Cell Biol. 154, 1147–1160 [DOI] [PMC free article] [PubMed] [Google Scholar]
- 25.Joseph J., Tan S. H., Karpova T. S., McNally J. G., Dasso M. (2002) J. Cell Biol. 156, 595–602 [DOI] [PMC free article] [PubMed] [Google Scholar]
- 26.Salina D., Enarson P., Rattner J. B., Burke B. (2003) J. Cell Biol. 162, 991–1001 [DOI] [PMC free article] [PubMed] [Google Scholar]
- 27.Wong R. W., Blobel G. (2008) Proc. Natl. Acad. Sci. U.S.A. 105, 15441–15445 [DOI] [PMC free article] [PubMed] [Google Scholar]
- 28.Qi H., Rath U., Wang D., Xu Y. Z., Ding Y., Zhang W., Blacketer M. J., Paddy M. R., Girton J., Johansen J., Johansen K. M. (2004) Mol. Biol. Cell 15, 4854–4865 [DOI] [PMC free article] [PubMed] [Google Scholar]
- 29.Niepel M., Strambio-de-Castillia C., Fasolo J., Chait B. T., Rout M. P. (2005) J. Cell Biol. 170, 225–235 [DOI] [PMC free article] [PubMed] [Google Scholar]
- 30.Lince-Faria M., Maffini S., Orr B., Ding Y., Cláudia F., Sunkel C. E., Tavares A., Johansen J., Johansen K. M., Maiato H. (2009) J. Cell Biol. 184, 647–657 [DOI] [PMC free article] [PubMed] [Google Scholar]
- 31.Lee S. H., Sterling H., Burlingame A., McCormick F. (2008) Genes Dev. 22, 2926–2931 [DOI] [PMC free article] [PubMed] [Google Scholar]
- 32.De Souza C. P., Hashmi S. B., Nayak T., Oakley B., Osmani S. A. (2009) Mol. Biol. Cell 20, 2146–2159 [DOI] [PMC free article] [PubMed] [Google Scholar]
- 33.Musacchio A., Salmon E. D. (2007) Nat. Rev. Mol. Cell Biol. 8, 379–393 [DOI] [PubMed] [Google Scholar]
- 34.Howell B. J., McEwen B. F., Canman J. C., Hoffman D. B., Farrar E. M., Rieder C. L., Salmon E. D. (2001) J. Cell Biol. 155, 1159–1172 [DOI] [PMC free article] [PubMed] [Google Scholar]
- 35.Karki S., Holzbaur E. L. (1999) Curr. Opin. Cell Biol. 11, 45–53 [DOI] [PubMed] [Google Scholar]
- 36.Hirokawa N. (1998) Science 279, 519–526 [DOI] [PubMed] [Google Scholar]
- 37.Vale R. D. (2003) Cell 112, 467–480 [DOI] [PubMed] [Google Scholar]
- 38.Vallee R. (1993) Proc. Natl. Acad. Sci. U.S.A. 90, 8769–8772 [DOI] [PMC free article] [PubMed] [Google Scholar]
- 39.Wong R. W., Setou M., Teng J., Takei Y., Hirokawa N. (2002) Proc. Natl. Acad. Sci. U.S.A. 99, 14500–14505 [DOI] [PMC free article] [PubMed] [Google Scholar]
- 40.Yang Z., Guo J., Chen Q., Ding C., Du J., Zhu X. (2005) Mol. Cell. Biol. 25, 4062–4074 [DOI] [PMC free article] [PubMed] [Google Scholar]
- 41.Funasaka T., Yanagawa T., Hogan V., Raz A. (2005) FASEB J. 19, 1422–1430 [DOI] [PubMed] [Google Scholar]
- 42.Wong R. W. (2010) Cell Cycle 9, 198–200 [DOI] [PubMed] [Google Scholar]
- 43.Nguyen C. L., McLaughlin-Drubin M. E., Münger K. (2008) Cancer Res. 68, 8715–8722 [DOI] [PMC free article] [PubMed] [Google Scholar]
- 44.Merdes A., Heald R., Samejima K., Earnshaw W. C., Cleveland D. W. (2000) J. Cell Biol. 149, 851–862 [DOI] [PMC free article] [PubMed] [Google Scholar]
- 45.Griffis E. R., Stuurman N., Vale R. D. (2007) J. Cell Biol. 177, 1005–1015 [DOI] [PMC free article] [PubMed] [Google Scholar]
- 46.Wojcik E., Basto R., Serr M., Scaërou F., Karess R., Hays T. (2001) Nat. Cell Biol. 3, 1001–1007 [DOI] [PubMed] [Google Scholar]
- 47.Draviam V. M., Stegmeier F., Nalepa G., Sowa M. E., Chen J., Liang A., Hannon G. J., Sorger P. K., Harper J. W., Elledge S. J. (2007) Nat. Cell Biol. 9, 556–564 [DOI] [PubMed] [Google Scholar]
- 48.Stegmeier F., Rape M., Draviam V. M., Nalepa G., Sowa M. E., Ang X. L., McDonald E. R., III, Li M. Z., Hannon G. J., Sorger P. K., Kirschner M. W., Harper J. W., Elledge S. J. (2007) Nature 446, 876–881 [DOI] [PubMed] [Google Scholar]
- 49.Ohsugi M., Adachi K., Horai R., Kakuta S., Sudo K., Kotaki H., Tokai-Nishizumi N., Sagara H., Iwakura Y., Yamamoto T. (2008) Cell 132, 771–782 [DOI] [PubMed] [Google Scholar]
- 50.Peschard P., Park M. (2007) Oncogene 26, 1276–1285 [DOI] [PubMed] [Google Scholar]
Associated Data
This section collects any data citations, data availability statements, or supplementary materials included in this article.