Abstract
The cleavage of sphingoid base phosphates by sphingosine-1-phosphate (S1P) lyase to produce phosphoethanolamine and a fatty aldehyde is the final degradative step in the sphingolipid metabolic pathway. We have studied mice with an inactive S1P lyase gene and have found that, in addition to the expected increase of sphingoid base phosphates, other sphingolipids (including sphingosine, ceramide, and sphingomyelin) were substantially elevated in the serum and/or liver of these mice. This latter increase is consistent with a reutilization of the sphingosine backbone for sphingolipid synthesis due to its inability to exit the sphingolipid metabolic pathway. Furthermore, the S1P lyase deficiency resulted in changes in the levels of serum and liver lipids not directly within the sphingolipid pathway, including phospholipids, triacyglycerol, diacylglycerol, and cholesterol. Even though lipids in serum and lipid storage were elevated in liver, adiposity was reduced in the S1P lyase-deficient mice. Microarray analysis of lipid metabolism genes in liver showed that the S1P lyase deficiency caused widespread changes in their expression pattern, with a significant increase in the expression of PPARγ, a master transcriptional regulator of lipid metabolism. However, the mRNA expression of the genes encoding the sphingosine kinases and S1P phosphatases, which directly control the levels of S1P, were not significantly changed in liver of the S1P lyase-deficient mice. These results demonstrate that S1P lyase is a key regulator of the levels of multiple sphingolipid substrates and reveal functional links between the sphingolipid metabolic pathway and other lipid metabolic pathways that may be mediated by shared lipid substrates and changes in gene expression programs. The disturbance of lipid homeostasis by altered sphingolipid levels may be relevant to metabolic diseases.
Keywords: Diseases/Metabolic, Lipid/Sphingolipid, Lipid/Sphingolipids, Metabolism/Lipid, Metabolism/Metabolic Syndrome, Organisms/Mammal, Organisms/Mouse
Introduction
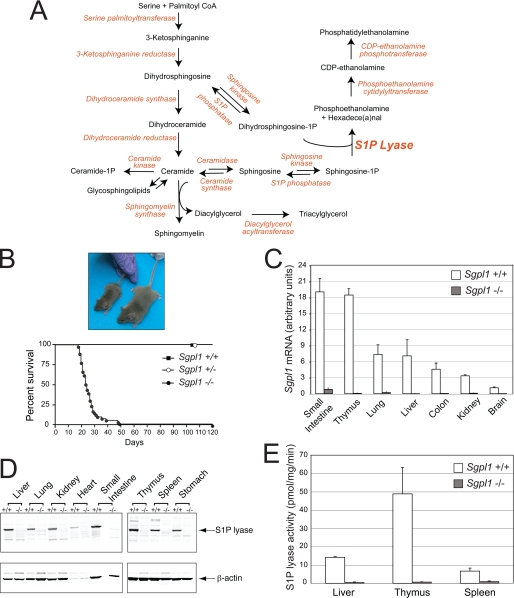
Sphingolipid metabolism generates diverse lipid molecules that are utilized by cells in multiple ways (Fig. 1A) (1, 2). Complex sphingolipids, such as sphingomyelin and glycosphingolipids, are structural components of cell membranes and drive the formation of plasma membrane lipid domains by virtue of their interactions with sterols. Metabolic intermediates, notably sphingosine, ceramide, and sphingosine-1-phosphate (S1P),3 serve as bioactive molecules by regulating cellular signaling pathways. An additional function of sphingolipid metabolism is the synthesis of substrates that are utilized by other lipid metabolic hubs. However, the functional, regulatory, and physiological significance of the intersection of sphingolipid metabolism with other lipid pathways is not well understood.
FIGURE 1.
Gene trap disruption of the Sgpl1 gene causes S1P lyase deficiency. A, sphingolipid metabolic pathway and linkage to triacylglycerol and phosphatidylethanolamine synthesis. B, appearance and life span of Sgpl1−/−, Sgpl1+/−, and Sgpl1+/+ mice. C, RT-qPCR of Sgpl1 mRNA using RNA of various tissues from Sgpl1−/− (gray bars) and Sgpl1+/+ (open bars) mice. Gapdh was used as a reference gene for normalization. SI, small intestine. Data represent mean values ± S.E. D, top panel: Western blot of S1P lyase protein in various tissues from Sgpl1−/− and Sgpl1+/+ mice. Bottom panel, same blot probed with antibody to β-actin as a loading control. E, S1P lyase enzyme activity in extracts of various tissues from Sgpl1−/− (gray bars) and Sgpl1+/+ (open bars) mice. Data represent mean values ± S.E. of representative results from three independent experiments.
A decisive step in the sphingolipid metabolic pathway is carried out by S1P lyase, encoded by the Sgpl1 gene (3, 4). S1P lyase, which resides in the endoplasmic reticulum and is widely distributed in tissues, catalyzes the final degradative step in the sphingolipid metabolic pathway with the cleavage of phosphorylated sphingoid bases to generate phosphoethanolamine and a fatty aldehyde-hexadecenal or hexadecanal, in the case of S1P or dihydrosphingosine 1-phosphate (DH-S1P), respectively (Fig. 1A). It is only through the S1P lyase reaction that sphingolipid substrates are able to irreversibly exit the metabolic pathway. S1P, which is synthesized by sphingosine kinase, if not degraded by the S1P lyase, may be dephosphorylated by S1P phosphatase to generate sphingosine that is reutilized in sphingolipid metabolism through a recycling or salvage pathway (5). Alternatively, S1P can be exported out of the cell, where it is then available for interactions with cell surface receptors (6).
Here we study the lipid metabolism changes that occur in mice as a consequence of the disruption of the Sgpl1 gene, and the resulting block of sphingolipid catabolism. We find that S1P and other sphingolipid species are elevated in the serum and liver of Sgpl1−/− mice consistent with a diversion of the sphingoid bases into the recycling pathway. Marked changes were also found in levels of nonsphingolipid metabolites, including serum and liver triglycerides, cholesterol, and phospholipids, in S1P lyase-deficient mice. Interestingly, the Sgpl1−/− mice displayed increased lipid levels in serum and storage of lipid in liver, while having abnormally reduced amounts of adipose tissue. Microarray analysis of liver mRNA revealed global changes in the expression pattern of lipid metabolism genes in Sgpl1−/− mice compared with Sgpl1+/+ mice. These results demonstrate that S1P lyase expression is a key regulator of sphingolipid levels, and reveals an important influence of the sphingolipid metabolic pathway on lipid homeostasis in general. This influence may be important in pathologic conditions with altered sphingolipid metabolite levels, such as diabetes and atherosclerosis.
EXPERIMENTAL PROCEDURES
Mice
The Sgpl1−/− mice were derived by gene trap mutagenesis (7) and were generously provided by Philip Soriano, Mount Sinai School of Medicine, New York. The mice, on a mixed C57BL6/129sv background, were maintained by heterozygous matings, with pups genotyped at about 15 days after birth and used for experiments at about 18 days after birth, prior to normal weaning age because of their shortened life span. Littermate Sgpl1+/+ (wild-type) and Sgpl1+/− mice were used as controls. The mice were genotyped by multiplex PCR of tail snip DNA using three primers: 5′-CGCTCAGAAGGCTCTGAGTCATGG-3′, 5′CATCAAGGAAACCCTGGACTACTG3′, and 5′-CCAAGTGTACCTGCTAAGTTCCAG-3′. The following conditions were used: denaturation, 94 °C for 5 min; amplification, 94 °C for 1 min, 58 °C for 1 min, 72 °C for 1 min (40 cycles); extension, 72 °C for 1 min. The wild-type Sgpl1 gene fragment is ∼300 bp in length, and the mutant Sgpl1 gene fragment is ∼600 bp in length. Body composition of newly weaned mice was measured using the EchoMRI 3-in-1TM (Echo Medical Systems).
RT-qPCR
Total RNA was isolated from mouse tissues with TRIzol (Invitrogen). Total RNA (1 μg) was first digested with DNase I and subsequently reverse-transcribed with the SuperScript First-Strand Synthesis System for RT-qPCR (Invitrogen) by following the manufacturer's instructions. Taqman primer-probe sets for Sgpl1 (mm00486079_m1), Pparg (mm00440945_ m1), Ppara (mm00440939_m1), Sptlc1 (mm00447343_m1), Sptlc2 (mm00448871_m1), Sphk1 (mm00448841_g1), Sphk2 (mm00445020_m1), Sgpp1 (mm00473016_m1), Sgpp2 (mm01158866_m1, and Gapdh (mm99999915_g1; reference gene) were purchased from Applied Biosystems. Each PCR cycle consisted of 30 s of denaturation at 94 °C, 30 s of annealing at 55 °C, and 2 min of extension at 72 °C.
S1P Lyase Enzyme Assay
Tissues were homogenized in extraction buffer (5 mm MOPS, pH 7.5, 0.25 m sucrose, 1 mm EDTA, 1 mm DTT, and protease inhibitor mixture (Sigma)). After centrifugation at 1000 × g for 10 min, supernatants were transferred to new tubes, and protein was determined by the Bradford method using the Bio-Rad Protein Assay (Bio-Rad). Enzyme activity reactions contained 50 μg of protein and were carried out at 37 °C for 60 min in 200 μl of reaction buffer (100 mm potassium phosphate buffer, 25 mm NaF, 1 mm EDTA, 1 mm DTT, 5 mm pyridoxal 5′-phosphate, 0.1% Triton X-100, with 40 μm DH-S1P (containing 0.5 μCi of radioactive [3H]DH-S1P). Reactions were stopped by adding 0.2 ml of 1% HClO4, followed by 1.5 ml of chloroform/methanol (1/2, v/v). Phase separation was induced by adding 0.5 ml of chloroform and 0.5 ml of 1% HClO4. Samples were vortexed and centrifuged, then the lower phase was washed with 1 ml 1% HClO4/methanol (8/2, v/v). An aliquot of the organic phase was dried down under nitrogen gas, dissolved in chloroform/methanol (8/2, v/v) containing 5 mm palmitic acid and hexadecanol or hexadecanal as carriers, and spotted onto a TLC plate. Plates were developed in chloroform/methanol/acetic acid (50:50:1, v/v), and radioactive bands were detected with a Fuji phosphorimager.
Western Blot Analysis
Tissues were homogenized in extraction buffer (5 mm MOPS, pH 7.5, 0.25 m sucrose, 1 mm EDTA, 1 mm DTT, 1% Triton X-100, and protease inhibitor mixture (Sigma)). Samples were centrifuged at 13,000 × g for 10 min, and the supernatants transferred to new tubes. Protein was determined by the Bradford method using the Bio-Rad protein assay. Samples (30 μg of protein) were subjected to SDS-PAGE (4–20% gradient) and subsequently transferred to a nylon membrane. The blots were blocked and incubated with an affinity-purified polyclonal rabbit anti-mouse S1P lyase antibody (generated by injecting rabbits with the C-terminal peptide: 551-TTDPVTQGNQMNGSPKPR-568; Bethyl Laboratories, Montgomery, TX) or with a monoclonal anti-β-actin antibody (Sigma-Aldrich) for loading control.
Lipid Analysis
Sphingolipids in serum and liver homogenates were measured by high-performance liquid chromatography-tandem mass spectrometry (LC-MS) by the Lipidomics Core at the Medical University of South Carolina on a Thermo Finnigan (Waltham, MA) TSQ 7000 triple quadrupole mass spectrometer, operating in a multiple reaction monitoring-positive ionization mode as described (8).
Lipid profile analyses (performed by Lipomics Technologies, West Sacramento, CA) were used to quantify levels of glycerophospholipids, cholesterol (free and esterified), triacylglycerol (TAG), diacylglycerol (DAG), and fatty acids in liver extracts. Briefly, the technique used involves extraction of tissue lipids with authentic internal standards added by the method described previously (9), using chloroform-methanol (2:1, v/v). Individual lipid classes within each extract were separated by liquid chromatography (Agilent Technologies model 1100 Series). Each lipid class was trans-esterified in 1% sulfuric acid in methanol in a sealed vial under nitrogen at 100 °C for 45 min. The resulting fatty acid methyl esters were prepared for gas chromatography by sealing the hexane extracts under nitrogen. Fatty acid methyl esters were extracted from the mixture with hexane containing 0.05% butylated hydroxyltoluene and prepared for gas chromatography by sealing the hexane extracts under nitrogen. Fatty acid methyl esters were separated and quantified by capillary gas chromatography (Agilent Technologies model 6890) with a 30-m DB-88MS capillary column (Agilent Technologies) and flame ionization detector.
Serum lipoproteins were resolved by fast protein liquid chromatography (FPLC) on a Superose-6 column. Samples were analyzed enzymatically for total cholesterol, free cholesterol, triglycerides (Roche Diagnostics, Indianapolis, IN), and phospholipids (Wako Chemicals, Richmond, VA) on a ChemWell analyzer (Awareness Technologies, Palm City, FL).
Histology
Sections from paraffin embedded liver fixed with 10% formaldehyde were stained with hematoxylin and eosin (H&E). For Oil red O staining, frozen sections of liver were fixed in 4% formaldehyde for 1 h at room temperature, rinsed with water, and then stained with Oil red O solution for 30 min at room temperature. After the sections were washed, they were examined on a Leica DMLB microscope. For electron microscopy, liver tissue was fixed with 1% glutaraldehyde/4% paraformaldehyde at 4 °C for 24 h, postfixed with 1% osmium tetrahydroxide, and processed for embedding in plastic resin. Ultrathin sections were cut, stained with uranyl acetate and lead citrate, and examined with an electron microscope (Philips EM 410). For LAMP-2 immunostaining (10), de-paraffinized sections of fixed liver were immunostained with rat anti-LAMP-2 (sc-19991) and the rat ABC staining system (Santa Cruz Biotechnology, Inc., Santa Cruz, CA).
Microarray Analysis
RNA from Sgpl1+/+ and Sgpl1−/− livers was isolated using TRIzol. Total RNA was further purified on an RNAeasy column (Qiagen) and the RNA quality was checked on an Agilent Bioanalyzer (Agilent Technologies). Target labeling and hybridization to GeneChips were carried out in the NIDDK Microarray Core facility using the GeneChip Mouse Genome 430 2.0 Array purchased from Affymetrix. A total of six samples were used for the two experimental conditions (Sgpl1−/− versus Sgpl1+/+), with three replications. The microarray signals were analyzed using the Affymetrix RMA algorithm. Genes with a significant difference in expression between Sgpl1+/+ and Sgpl1−/− mice were selected based on p values of <0.05 as assessed by ANOVA results using Partek Pro software (Partek, St. Charles, MO). To identify genes in the lipid metabolism pathway, the Metacore pathway analysis web tool was used. To generate the heat map, the probe ids for the genes in the lipid metabolism pathway were extracted and the signal values of each probe set id were plotted by the commercial software GeneSpring7.2. When there was more than one probe set per gene, data for the significantly different probe ids were used. In the cases where none of the probe ids for a particular gene were significantly different, only one probe set id was used per gene. Probes that had raw signals of less than 100 in all samples were excluded. The National Center for Biotechnology Information Gene Expression Omnibus (GEO) accession number for the microarray data is GSE18745.
Statistical Analysis
p values of < 0.05 were considered statistically significant.
RESULTS
Sgpl1 Deficiency Elevates Sphingolipids and Other Lipids in the Serum
The Sgpl1 homozygous gene trap (Sgpl1−/−) mice (7) died within the first weeks after weaning, and had significantly smaller body size than their wild-type (Sgpl1+/+) littermates at about 18 days of age (Fig. 1B). RT-qPCR demonstrated that Sgpl1 mRNA was greatly reduced in the tissues of Sgpl1−/− mice compared with those of Sgpl1+/+ mice (Fig. 1C). Western blot analysis of tissues from Sgpl1+/+ and Sgpl1−/− mice showed a lack of S1P lyase protein expression in the Sgpl1−/− mice (Fig. 1D). Finally, S1P lyase enzyme activity was found to be highly deficient in the liver, spleen, and thymus of the Sgpl1−/− mice (Fig. 1E). These results indicate that the gene trap insertion resulted in a null Sgpl1 allele. Because most Sgpl1−/− mice did not usually live beyond a few weeks, we concentrated our studies on mice obtained prior to weaning.
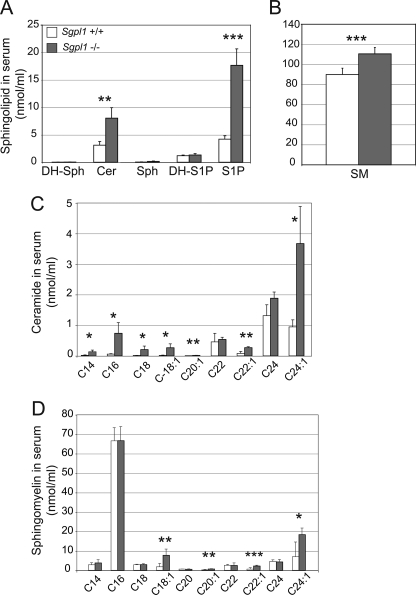
In the serum of Sgpl1−/− mice, LC-MS measurements demonstrated that S1P levels were elevated ∼4-fold over that in Sgpl1+/+ serum samples, but without increases in DH-S1P or sphingosine (Fig. 2A). Total ceramide levels were elevated ∼2.5-fold in Sgpl1−/− mice over levels in Sgpl1+/+ mice, with most of the individual ceramide chain species with different length fatty acid chains significantly increased (Fig. 2C). Total sphingomyelin levels were slightly but significantly elevated in the serum of the Sgpl1−/− mice compared with levels in Sgpl1+/+ mice (Fig. 2B). The sphingomyelin species showing statistically significant increases contained C18:1, C20:1, C22:1, or C24:1 fatty acid chains (Fig. 2D).
FIGURE 2.
Sphingolipid levels are elevated in serum of Sgpl1−/− mice. Sphingolipid levels were determined in serum of Sgpl1−/− (gray bars) and Sgpl1+/+ (open bars) mice by LC-MS. A, total ceramide (Cer), sphingosine (Sph). B, total sphingomyelin (SM). C, individual ceramide fatty acid chain species. D, individual sphingomyelin fatty acid chain species. Data represent mean values ± S.E. n = 3. *, p < 0.05; **, p < 0.01; ***, p < 0.005, paired Student's t test.
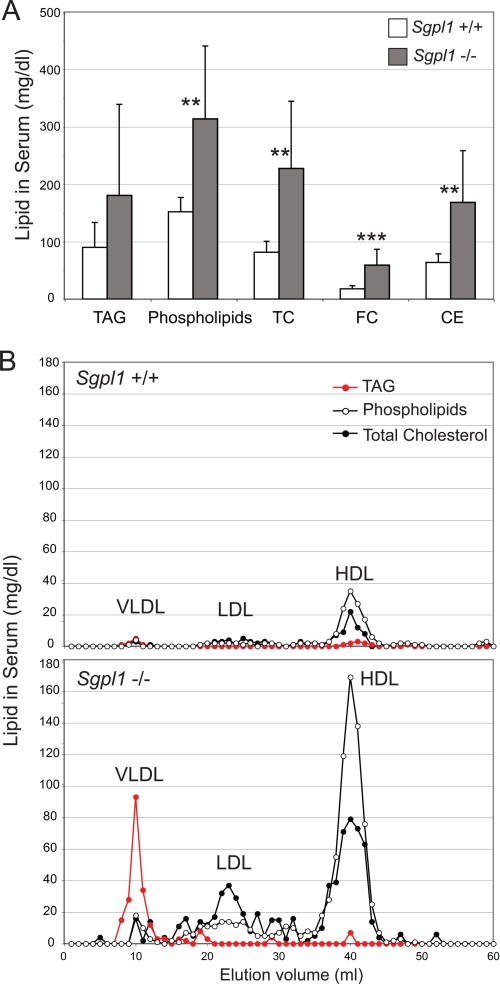
Total cholesterol, free cholesterol, cholesterol esters, and phospholipids were all markedly elevated in the serum of Sgpl1−/− mice compared with that of Sgpl1+/+ mice (Fig. 3A). The average TAG level was increased in the serum of the Sgpl1−/− mice compared with that of Sgpl1+/+ mice but was variable among individual mice and did not reach the level of statistical significance. However, size separation of the serum revealed highly increased levels of TAG associated with the very low density lipoprotein (VLDL) fraction in the Sgpl1−/− mice relative to the Sgpl1+/+ mice (Fig. 3B). Additionally, low density lipoprotein (LDL), and high density lipoprotein (HDL) cholesterol along with the phospholipid content of HDL was substantially increased in the Sgpl1−/− mice compared with the Sgpl1+/+ mice (Fig. 3B).
FIGURE 3.
Sgpl1−/− mice are hyperlipidemic. A, triacylglycerol (TAG), phospholipids, total cholesterol (TC), free cholesterol (FC), and cholesterol esters (CE) were determined in the serum of Sgpl1−/− (gray bars) and Sgpl1+/+ (open bars) mice. Data represent mean values ± S.E. n = 7. **, p < 0.01; ***, p < 0.005, paired Student's t test. B, pooled serum samples from Sgpl1−/− (closed circles) and Sgpl1+/+ (open circles) mice (n = 3 each genotype) were fractionated by FPLC to separate VLDL, LDL, and HDL.
Sgpl1 Deficiency Elevates Multiple Sphingolipids in the Liver
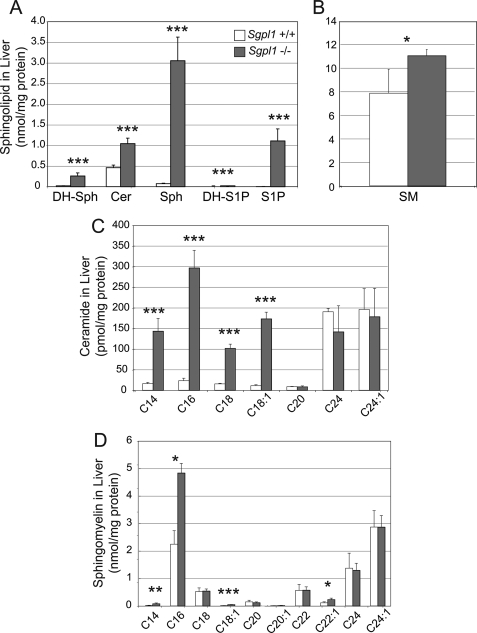
Because liver is a major site of lipid metabolism, we determined sphingolipid levels in the liver of Sgpl1−/− and Sgpl1+/+ mice. S1P levels were increased 472-fold, sphingosine levels 42-fold, and ceramide levels 2-fold (Fig. 4A) in the Sgpl1−/− livers compared with Sgpl1+/+ livers. Dihydrosphingosine (DH-Sph) and DH-S1P, which were present at low, or in the case of the latter, undetectable concentrations in the liver of Sgpl1+/+ mice, were also significantly elevated in the liver of Sgpl1−/− mice. DH-Sph levels were increased more than 10-fold (from 20.8 ± 3.0 pmol/mg protein in the liver Sgpl1+/+ mice to 260 ± 73 pmol/mg protein) in the liver of Sgpl1−/− mice. DH-S1P concentrations in the Sgpl1+/+ liver were below the detection limit, and in Sgpl1−/− liver rose to 1 pmol/mg protein.
FIGURE 4.
Sphingolipids are elevated in the liver of Sgpl1−/− mice. Sphingolipid levels were determined in the liver of Sgpl1−/− (gray bars) and Sgpl1+/+ (open bars) mice by LC-MS. A, total ceramide (Cer), sphingosine (Sph). B, total sphingomyelin (SM). C, individual ceramide fatty acid chain species. D, individual sphingomyelin fatty acid chain species. Data represent mean values ± S.E. n = 3. *, p < 0.05; **, p < 0.01; ***, p < 0.005; paired Student's t test.
The levels of ceramide species with shorter fatty acids chains, C14, C16, C18, or C18:1, were increased 9-, 13-, 7- and 16-fold, respectively, in the liver of Sgpl1−/− mice compared with those in the liver of Sgpl1+/+ mice, whereas the levels of ceramide subspecies with longer fatty acid chains were not significantly different in Sgpl1+/+ and Sgpl1−/− liver (Fig. 4C).
Total sphingomyelin levels were also increased in the liver of Sgpl1−/− mice compared with those in the liver of Sgpl1+/+ mice (Fig. 4B). Measurements of the subspecies of sphingomyelin revealed a pattern of fatty acid chain lengths generally similar to what was seen for the ceramide profile, with significant elevations of sphingomyelin species with relatively shorter fatty acid chains (Fig. 4D).
Sgpl1 Deficiency Produces Major Alterations in Levels of Other Lipid Classes
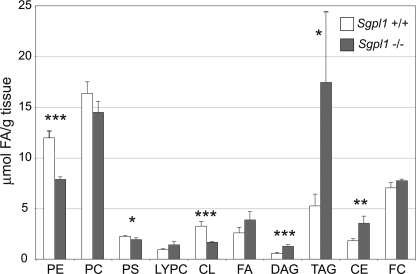
Because sphingolipid metabolism is interconnected with the metabolic pathways of other lipids (Fig. 1A), we performed lipidomic profiling on liver from the Sgpl1−/− and Sgpl1+/+ mice to identify levels of other lipid classes (Fig. 5). Of the major plasma membrane glycerophospholipids, phosphatidylethanolamine levels were the most substantially changed, decreasing ∼30% in the liver of Sgpl1−/− mice compared with the liver of Sgpl1+/+ mice. In the Sgpl1−/− livers, phosphatidylserine levels were slightly lower than those in the liver of Sgpl1+/+ mice, and phosphatidylcholine levels were not significantly changed compared with the liver of Sgpl1+/+ mice. Cardiolipin, a diphosphatidylglycerol lipid of the inner mitochondrial membrane, was also reduced in the liver of Sgpl1−/− mice. Lysophosphatidylcholine levels in Sgpl1−/− and Sgpl1+/+ mice were not significantly different.
FIGURE 5.
Lipid profile is altered in the liver of Sgpl1−/− mice. Lipid levels were determined in the liver of Sgpl1−/− (gray bars) and Sgpl1+/+ (open bars) mice as described under “Experimental Procedures.” PE, phosphatidylethanolamine; PC, phosphatidylcholine; PS, phosphatidylserine; LYPC, lysophosphatidylcholine; CL, cardiolipin; FA, fatty acids; DAG, diacylglycerol; TAG, triacylglycerol; CE, cholesterol esters; FC, free cholesterol. Data represent mean values ± S.E. n = 3. *, p < 0.05; **, p < 0.01; ***, p < 0.005; paired Student's t test.
DAG and TAG levels were significantly elevated in the liver of Sgpl1−/− mice compared with the liver of Sgpl1+/+ mice. Free cholesterol levels were similar in the liver of Sgpl1−/− and Sgpl1+/+ mice, whereas cholesterol ester levels were significantly increased in the liver of Sgpl1−/− mice compared with the liver of Sgpl1+/+ mice. Liver total free fatty acid levels in Sgpl1−/− and Sgpl1+/+ mice were not significantly different.
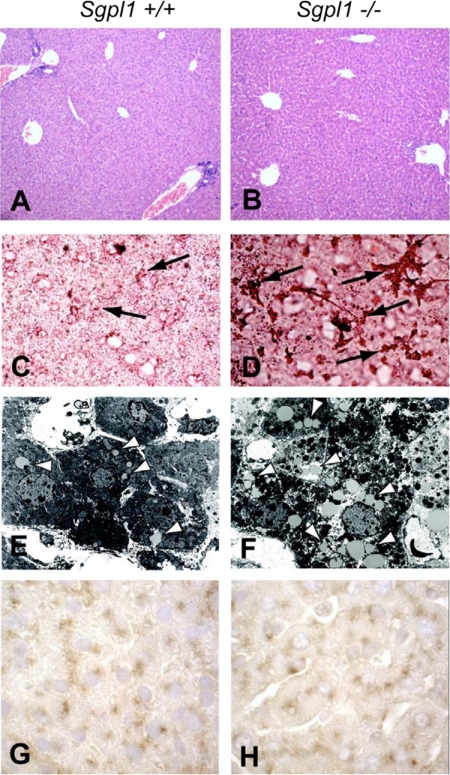
Evaluation of liver sections of Sgpl1−/− mice after H&E staining indicated that the organization and morphology was similar to that of the control sections (Fig. 6, A and B). Although the Sgpl1−/− mice have been reported to have inflammatory changes (7, 11), there was minimal evidence of leukocyte infiltration into the liver parenchyma. Consistent with the increase of TAG in liver, examination of frozen liver sections stained by Oil red O revealed a discernible increase in lipid deposits in the liver of Sgpl1−/− mice compared with the liver of Sgpl1+/+ mice (Fig. 6, C and D). Accordingly, electron micrographs of liver sections demonstrated an increase in the number and size of lipid droplets in the liver tissue of Sgpl1−/− mice compared with that of Sgpl1+/+ mice (Fig. 6, E and F). Liver sections were immunostained with antibody to LAMP-2 to determine whether the lysosomal compartment was enlarged due to the possible increased lysosomal storage of lipids (10) in the Sgpl1−/− liver. The similar degree of LAMP-2 staining in the liver sections of Sgpl1−/− and Sgpl1+/+ mice indicated that the size of the lysosomal compartment was normal in the Sgpl1−/− hepatocytes and not distorted by lipid storage.
FIGURE 6.
Excess lipids are stored in the liver of Sgpl1−/− mice. Paraffin-embedded liver sections from (A) Sgpl1+/+ or (B) Sgpl1−/− mice were stained with H&E (×10 magnification). Frozen sections of liver from (C) Sgpl1+/+ or (D) Sgpl1−/− mice were stained with Oil red O (×40 magnification). Arrows indicate lipid deposits. Liver samples from (E) Sgpl1+/+ or (F) Sgpl1−/− mice were analyzed by electron microscopy (×6000 magnification). Arrowheads indicate examples of lipid droplets. Liver sections from (G) Sgpl1+/+ or (H) Sgpl1−/− mice immunostained with LAMP-2 antibody (brown reaction product) and counterstained with hematoxylin (×100 magnification).
Because lipid accumulation was increased in the liver of S1P lyase-deficient mice, we preformed analysis of total lean and fat mass of wild-type and S1P lyase-deficient mice. The results demonstrated that the Sgpl1−/− mice had significantly lower body weight, less total lean mass and adipose tissue mass than did the Sgpl1+/+ mice (Fig. 7, A–C). As a percentage of body weight, the Sgpl1−/− mice were significantly leaner (less than 2% body fat) than Sgpl1+/+ mice (∼6% body fat) (Fig. 7D).
FIGURE 7.
Adiposity is reduced in Sgpl1−/− mice. A, weights of the mice were taken at about 18 days after birth. ***, p < 0.005. Sgpl1−/− (gray bars) and Sgpl1+/+ (open bars) mice were subjected to quantitative magnetic resonance body composition analysis to determine their fat (B) and lean mass (C) content. The fat mass as a percent of body weight is presented in (D). Data represent mean values ± S.E. n = 3. ***, p < 0.005, paired Student's t test.
S1P Lyase Deficiency Is Associated with Widespread Alterations of Lipid Metabolism Genes in the Liver
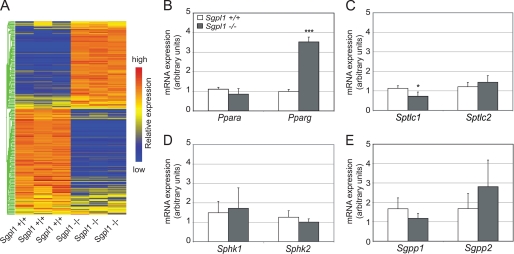
To gain a comprehensive view of gene expression relating to lipid metabolism in liver due to the deletion of the Sgpl1 gene, we performed Affymetrix expression microarray analysis on mRNA isolated from the liver of Sgpl1−/− and Sgpl1+/+ mice. The Gene Ontology (GO) category lipid metabolic process, which includes genes involved in neutral lipid, phospholipid, sterol, and sphingolipid metabolism, was significantly affected (p = 3.96E-9) when comparing the Sgpl1−/− and Sgpl1+/+ liver groups, with 177 out of 307 total genes in the category showing a significant difference in expression (p < 0.05) (supplemental Table S1). Clustering of the raw microarray expression data from the genes that composed the lipid metabolic process GO category in a heat map indicated widespread differences in the gene expression profiles between Sgpl1−/− and Sgpl1+/+ liver mRNA (Fig. 8A).
FIGURE 8.
Lipid metabolism gene expression profile in the liver of Sgpl1−/− mice exhibits widespread alteration. A, Affymetrix microarray gene expression analysis was performed with liver RNA from three Sgpl1+/+ and three Sgpl1−/− mice. The raw signal values of the genes from the GO category lipid metabolic process were clustered to produce a heat map as described under “Experimental Procedures.” Blue corresponds to reduced expression relative to red, which corresponds to relatively increased expression. RT-qPCR analysis of (B) Ppara and Pparg, (C) Sptlc1, and Sptlc2, (D) Sphk1 and Sphk2, and (E) Sgpp1 and Sgpp2 in liver mRNA from Sgpl1−/− (gray bars) and Sgpl1+/+ (open bars) mice. Data represent mean values ± S.E. n = 3. *, p < 0.05; ***, p < 0.005, paired Student's t test.
Pparg, the gene encoding peroxisome proliferator-activated receptor (PPAR)γ, which is a major regulator of lipid metabolism (12) that has been linked to liver steatosis (13), was found to be up-regulated in the liver of Sgpl1−/− mice by microarray analysis (supplemental Table S1) and was also found to be highly elevated in the liver of Sgpl1−/− mice by RT-qPCR analysis (Fig. 8B). Expression of the gene for PPARα (Ppara), which is also important in liver lipid metabolism (12), was not significantly different in Sgpl1−/− and Sgpl1+/+ liver mRNA (Fig. 8B).
Expression of genes encoding the major subunits of serine palmitoyltransferase (Sptlc1, Sptlc2), the first committed step in sphingolipid metabolism (Fig. 1A), was assayed in the liver of Sgpl1−/− and Sgpl1+/+ mice by RT-qPCR (Fig. 8C). Expression of Sptlc1 was significantly decreased in the liver of Sgpl1−/− mice compared with that in Sgpl1+/+ mice, while expression of Sptlc2 was not significantly different in Sgpl1−/− and Sgpl1+/+ liver mRNA. The expression of sphingosine kinases, Sphk1 and Sphk2, and S1P phosphatases, Sgpp1 and Sgpp2, were not significantly altered in the liver of the Sgpl1−/− mice.
DISCUSSION
S1P lyase controls the irreversible exit of substrate from the sphingolipid metabolic pathway via the degradation of sphingoid base phosphates (3). As anticipated from the established pathway of sphingolipid metabolism (Fig. 1A), we found that S1P deficiency caused an elevation of S1P levels in serum and liver in mice lacking a functional S1P lyase gene. Not necessarily expected was our finding that other major lipids in the sphingolipid metabolic pathway, notably sphingosine, ceramide, and sphingomyelin in liver, and ceramide and sphingomyelin in serum, were also substantially elevated in the S1P lyase-deficient mice. S1P lyase deficiency has also been reported to cause age-dependent increases of S1P, sphingosine, and C16 ceramide in the thymus (14).
The increase in the levels of multiple sphingolipids might be due to elevated de novo synthesis, impaired lysosomal degradation or sphingoid base recycling. Serine palmitoyltransferase gene expression was not elevated in the lyase-deficient mice consistent with an absence of heightened de novo synthesis. Further, the lack of histologic and morphologic evidence of lysosomal storage was suggestive that lysosomal degradation of sphingolipids was not impaired and, thus, not responsible for the elevated lipids in the lyase-deficient mice. Instead, the increased levels of sphingolipids is more compatible with their generation by the sphingolipid recycling or salvage pathway that has been shown to utilize S1P as a starting point (5, 15). In the recycling pathway, S1P is dephosphorylated by S1P phosphatases, which reside in the endoplasmic reticulum, to produce sphingosine. Ceramide is then synthesized, via acylation of sphingosine, by either ceramide synthases (CerS), encoded by Lass genes (16), or by the reverse ceramide synthase activity intrinsic to ceramidases, encoded by Asah genes (17).
Each of the ceramide synthases has unique preferences for particular chain-length fatty acyl-CoAs, resulting in the generation of ceramide species with specific fatty acid chain lengths. In this study, we found that ceramides with shorter fatty acid chain lengths (C14–18) were increased in the Sgpl1−/− liver relative to those with longer fatty acid chain lengths (C20–24), suggesting that the synthase activities involved in the ceramide accumulation may preferentially utilize relatively shorter fatty acyl-CoA substrates. Protein kinase C-mediated activation of the sphingolipid salvage pathway in human breast cancer cells has been reported to selectively elevate levels of shorter-chain ceramides (C16) through the activity of Lass5 (CerS5) (18, 19). However, the reverse ceramide synthase activity of acid ceramidase also produced ceramides with shorter fatty acid chains (17) consistent with either enzyme group, Lass or Asah, being involved. Another possibility for the relative increase in the shorter-chain ceramides in liver might be a selective S1P-mediated inhibition of CerS2 activity. CerS2 is highly expressed in liver and specifically produces ceramides with longer fatty acid chains (>20) (20). Interestingly, CerS contains a S1P receptor-like motif that mediates an inhibitory effect of S1P on its ceramide synthase activity (20). Thus, the very high levels of S1P we observed in the liver of Sgpl1−/− mice may inhibit the activity of CerS2, which utilizes relatively longer fatty acyl-CoA substrates, skewing the ceramide profile toward subspecies with shorter fatty acid chains.
Sphingomyelin is synthesized by sphingomyelin synthases in the Golgi, which transfer a phosphocholine group from phosphatidylcholine onto the primary hydroxyl of ceramide (Fig. 1A). As a consequence of this reaction, both sphingomyelin and DAG are produced (21). Thus the increase of DAG detected in the liver of Sgpl1−/− mice may be the result of increased synthesis of sphingomyelin driven by elevated ceramide levels arising from the inability of these mutant mice to degrade S1P. The sphingomyelin profile in the liver of Sgpl1−/− mice, like the ceramide profile, was skewed toward the shorter fatty acid chain lengths consistent with such a precursor product relationship.
TAG levels were also elevated in the livers of the Sgpl1−/− mice, with a corresponding increased accumulation of lipid droplets in their hepatocytes. DAG is a direct precursor substrate for the synthesis of TAG through the addition of a fatty acid by diacyglycerol acyltransferase (Fig. 1A) (22). A metabolic interaction between sphingolipid and TAG synthesis has been inferred from previous studies in mice with simultaneous deletions of the acid sphingomyelinase and LDL receptor genes (23). In this case, the absence of acid sphingomyelinase was believed to cause a decrease in the rate of sphingomyelin synthesis, resulting in less DAG and TAG accumulation in liver, together with lower serum lipoprotein levels. In Sgpl1−/− mice, we suggest that an increase in the flow of substrate through the sphingolipid salvage pathway toward sphingomyelin resulted in more DAG and TAG generation in liver together with higher lipoprotein levels in serum.
The generation of phosphoethanolamine by the S1P lyase reaction can be utilized for phosphatidylethanolamine biosynthesis through the production of the intermediate, CDP-ethanolamine, by phosphoethanolamine cytidyltransferase (Fig. 1A) (24–27). CDP-ethanolamine is subsequently used for the transfer of phosphoethanolamine to DAG to generate phosphatidylethanolamine. In Drosophila and Leishmania, the generation of phosphoethanolamine by the S1P lyase-mediated cleavage of S1P is an important pathway for the generation of phosphatidylethanolamine (24, 27). In mammalian tissues, however, the significance of sphingolipid metabolism for the biosynthesis of phosphatidylethanolamine has not been established, although a link between S1P formation and the generation of phosphatidylethanolamine has been suggested by the reduction of phosphatidylethanolamine levels in the pregnant uteri of sphingosine kinase-deficient mice (28). The reduction of phosphatidylethanolamine levels in the liver of Sgpl1−/− mice that we observed indicates that sphingolipid metabolism may have a significant role in phosphatidylethanolamine biosynthesis in liver, but that other pathways must operate to maintain the bulk of the phosphatidylethanolamine levels. These include the direct utilization of ethanolamine through its phosphorylation by ethanolamine kinases to generate phosphoethanolamine in the CDP-ethanolamine pathway, as well as a second major phosphatidylethanolamine biosynthetic pathway that occurs via the decarboxylation of phosphatidylserine by phosphatidylserine decarboxylase (26).
The S1P lyase deficiency resulted in the elevation of total cholesterol levels along with LDL and HDL levels in serum. The change in sterol homeostasis after perturbation of sphingolipid metabolism in Sgpl1−/− mice is in line with results in yeast (29), in sphingolipid storage diseases (30), and in conditions of sphingomyelin depletion (31, 32), demonstrating functional interactions and regulatory links between these lipid classes (33). Although we have not defined the mechanisms underlying the observed changes, a number of possibilities exist. It has been suggested that sphingomyelin, which physically interacts with cholesterol in membranes, influences the distribution of free cholesterol in cell compartments, thereby controlling cholesterol influence on the sterol regulatory element-binding proteins in the endoplasmic reticulum that regulate the expression of genes for cholesterol metabolism (32). Furthermore, elevated ceramide may increase HDL levels by stimulating cholesterol efflux via the ABCA1 pathway (34). Finally, inflammatory changes, which have been observed in the S1P lyase-deficient mice (7, 11), may modify lipoprotein levels (35).
Even though the Sgpl1−/− mice exhibited high TAG levels in liver and TAG associated VLDL levels in serum, they were significantly leaner than the Sgpl1+/+ mice. The reduced adiposity of the Sgpl1−/− mice is reminiscent of mice with lysosomal storage diseases in which specific catabolic pathways are blocked. These mice are thought to have a negative energy balance due to the inability to salvage metabolites, which necessitates increased energy output for their synthesis (36). Alternatively, the decreased adiposity of the Sgpl1−/− mice may be the result of defects in the formation of adipose tissue or in the uptake of lipid by adipocytes resulting in a novel form of lipodystrophy (37).
The Sgpl1 deletion produced major changes in the expression profile of lipid metabolism genes. However, the expression of sphingolipid metabolism genes encoding sphingosine kinases and S1P phosphatases, which directly control S1P levels, were not changed. Many of observed lipid metabolism gene changes may be secondary to alterations in the levels of diverse lipid species caused by the block in S1P degradation. These gene expression changes may then also contribute to the overall derangement of lipid homeostasis. In particular, we found that the expression of PPARγ, a nuclear receptor with diverse lipid ligands (12), was significantly elevated in the liver of Sgpl1−/− mice. Increased PPARγ is a general property of fatty liver, in which TAG accumulates abnormally (13). Moreover, PPARγ expression has been shown to contribute directly to lipid storage in liver through its regulation of lipogenesis and TAG uptake transcriptional programs. In the Sgpl1−/− mice, TAG levels, which we found to be increased by diversion of the sphingolipid pathway toward sphingomyelin, may cause increased PPARγ expression, which could in turn exacerbate the TAG storage through alterations of gene expression programs.
Our studies on S1P lyase-deficient mice have shown that S1P lyase not only regulates the level of key sphingolipids, but have also revealed functional linkages between sphingolipid metabolism and the metabolic pathways of other diverse lipids. Abnormalities in sphingolipid metabolism are associated with obesity, insulin resistance, type 2 diabetes, and atherosclerosis, conditions often associated with disrupted lipid homeostasis (38, 39). Our results show that alterations in the sphingolipid metabolic pathway can broadly disturb lipid metabolism, suggesting its potential role in this pathophysiology.
Supplementary Material
This work was supported, in whole or in part, by the Intramural Research Program of the NIDDK and NHLBI, National Institutes of Health, and by National Institutes of Health Grants CA77528 (to J. D. S.) and C06 RR018823 (to the MUSC Lipomics Core).

The on-line version of this article (available at http://www.jbc.org) contains supplemental Table S1.
- S1P
- sphingosine 1-phosphate
- DH-S1P
- dihydrosphingosine 1-phosphate
- MOPS
- 4-morpholinepropanesulfonic acid
- DTT
- dithiothreitol
- LC-MS
- high performance liquid chromatography-tandem mass spectrometry
- TAG
- triacylglycerol
- DAG
- diacylglycerol
- FPLC
- fast protein liquid chromatography
- VLDL
- very low density lipoprotein
- LDL
- low density lipoprotein
- HDL
- high density lipoprotein
- DH-Sph
- dihydrosphingosine
- GO
- gene ontology
- PPAR
- peroxisome proliferator-activated receptor
- CerS
- ceramide synthase.
REFERENCES
- 1.Futerman A. H., Hannun Y. A. (2004) EMBO Rep. 5, 777–782 [DOI] [PMC free article] [PubMed] [Google Scholar]
- 2.Merrill A. H., Jr. (2002) J. Biol. Chem. 277, 25843–25846 [DOI] [PubMed] [Google Scholar]
- 3.Fyrst H., Saba J. D. (2008) Biochim. Biophys. Acta 1781, 448–458 [DOI] [PMC free article] [PubMed] [Google Scholar]
- 4.Saba J. D., Nara F., Bielawska A., Garrett S., Hannun Y. A. (1997) J. Biol. Chem. 272, 26087–26090 [DOI] [PubMed] [Google Scholar]
- 5.Le Stunff H., Giussani P., Maceyka M., Lépine S., Milstien S., Spiegel S. (2007) J. Biol. Chem. 282, 34372–34380 [DOI] [PubMed] [Google Scholar]
- 6.Skoura A., Hla T. (2009) J. Lipid Res. 50, S293–S298 [DOI] [PMC free article] [PubMed] [Google Scholar]
- 7.Schmahl J., Raymond C. S., Soriano P. (2007) Nat. Genet. 39, 52–60 [DOI] [PubMed] [Google Scholar]
- 8.Bielawski J., Szulc Z. M., Hannun Y. A., Bielawska A. (2006) Methods 39, 82–91 [DOI] [PubMed] [Google Scholar]
- 9.Folch J., Lees M., Sloane, Stanley G. H. (1957) J. Biol. Chem. 226, 497–509 [PubMed] [Google Scholar]
- 10.Obert L. A., Sobocinski G. P., Bobrowski W. F., Metz A. L., Rolsma M. D., Altrogge D. M., Dunstan R. W. (2007) Toxicol. Pathol. 35, 728–734 [DOI] [PubMed] [Google Scholar]
- 11.Vogel P., Donoviel M. S., Read R., Hansen G. M., Hazlewood J., Anderson S. J., Sun W., Swaffield J., Oravecz T. (2009) PLoS One 4, e4112. [DOI] [PMC free article] [PubMed] [Google Scholar]
- 12.Li A. C., Glass C. K. (2004) J. Lipid Res. 45, 2161–2173 [DOI] [PubMed] [Google Scholar]
- 13.Gavrilova O., Haluzik M., Matsusue K., Cutson J. J., Johnson L., Dietz K. R., Nicol C. J., Vinson C., Gonzalez F. J., Reitman M. L. (2003) J. Biol. Chem. 278, 34268–34276 [DOI] [PubMed] [Google Scholar]
- 14.Weber C., Krueger A., Münk A., Bode C., Van Veldhoven P. P., Gräler M. H. (2009) J. Immunol. 183, 4292–4301 [DOI] [PubMed] [Google Scholar]
- 15.Kitatani K., Idkowiak-Baldys J., Hannun Y. A. (2008) Cell Signal. 20, 1010–1018 [DOI] [PMC free article] [PubMed] [Google Scholar]
- 16.Pewzner-Jung Y., Ben-Dor S., Futerman A. H. (2006) J. Biol. Chem. 281, 25001–25005 [DOI] [PubMed] [Google Scholar]
- 17.Okino N., He X., Gatt S., Sandhoff K., Ito M., Schuchman E. H. (2003) J. Biol. Chem. 278, 29948–29953 [DOI] [PubMed] [Google Scholar]
- 18.Becker K. P., Kitatani K., Idkowiak-Baldys J., Bielawski J., Hannun Y. A. (2005) J. Biol. Chem. 280, 2606–2612 [DOI] [PubMed] [Google Scholar]
- 19.Kitatani K., Idkowiak-Baldys J., Bielawski J., Taha T. A., Jenkins R. W., Senkal C. E., Ogretmen B., Obeid L. M., Hannun Y. A. (2006) J. Biol. Chem. 281, 36793–36802 [DOI] [PubMed] [Google Scholar]
- 20.Laviad E. L., Albee L., Pankova-Kholmyansky I., Epstein S., Park H., Merrill A. H., Jr., Futerman A. H. (2008) J. Biol. Chem. 283, 5677–5684 [DOI] [PubMed] [Google Scholar]
- 21.Voelker D. R., Kennedy E. P. (1982) Biochemistry 21, 2753–2759 [DOI] [PubMed] [Google Scholar]
- 22.Lehner R., Kuksis A. (1996) Prog. Lipid Res. 35, 169–201 [DOI] [PubMed] [Google Scholar]
- 23.Deevska G. M., Rozenova K. A., Giltiay N. V., Chambers M. A., White J., Boyanovsky B. B., Wei J., Daugherty A., Smart E. J., Reid M. B., Merrill A. H., Jr., Nikolova-Karakashian M. (2009) J. Biol. Chem. 284, 8359–8368 [DOI] [PMC free article] [PubMed] [Google Scholar]
- 24.Zhang K., Pompey J. M., Hsu F. F., Key P., Bandhuvula P., Saba J. D., Turk J., Beverley S. M. (2007) EMBO J. 26, 1094–1104 [DOI] [PMC free article] [PubMed] [Google Scholar]
- 25.van Veldhoven P. P., Mannaerts G. P. (1993) Adv. Lipid Res. 26, 69–98 [PubMed] [Google Scholar]
- 26.Kent C. (1995) Annu. Rev. Biochem. 64, 315–343 [DOI] [PubMed] [Google Scholar]
- 27.Dobrosotskaya I. Y., Seegmiller A. C., Brown M. S., Goldstein J. L., Rawson R. B. (2002) Science 296, 879–883 [DOI] [PubMed] [Google Scholar]
- 28.Mizugishi K., Li C., Olivera A., Bielawski J., Bielawska A., Deng C. X., Proia R. L. (2007) J. Clin. Invest. 117, 2993–3006 [DOI] [PMC free article] [PubMed] [Google Scholar]
- 29.Guan X. L., Souza C. M., Pichler H., Dewhurst G., Schaad O., Kajiwara K., Wakabayashi H., Ivanova T., Castillon G. A., Piccolis M., Abe F., Loewith R., Funato K., Wenk M. R., Riezman H. (2009) Mol. Biol. Cell 20, 2083–2095 [DOI] [PMC free article] [PubMed] [Google Scholar]
- 30.Pagano R. E. (2003) Philos. Trans. R. Soc. Lond. B. Biol. Sci. 358, 885–891 [DOI] [PMC free article] [PubMed] [Google Scholar]
- 31.Scheek S., Brown M. S., Goldstein J. L. (1997) Proc. Natl. Acad. Sci. U.S.A. 94, 11179–11183 [DOI] [PMC free article] [PubMed] [Google Scholar]
- 32.Puri V., Jefferson J. R., Singh R. D., Wheatley C. L., Marks D. L., Pagano R. E. (2003) J. Biol. Chem. 278, 20961–20970 [DOI] [PubMed] [Google Scholar]
- 33.Worgall T. S. (2008) Subcell Biochem. 49, 371–385 [DOI] [PubMed] [Google Scholar]
- 34.Witting S. R., Maiorano J. N., Davidson W. S. (2003) J. Biol. Chem. 278, 40121–40127 [DOI] [PubMed] [Google Scholar]
- 35.Khovidhunkit W., Kim M. S., Memon R. A., Shigenaga J. K., Moser A. H., Feingold K. R., Grunfeld C. (2004) J. Lipid Res. 45, 1169–1196 [DOI] [PubMed] [Google Scholar]
- 36.Woloszynek J. C., Coleman T., Semenkovich C. F., Sands M. S. (2007) J. Biol. Chem. 282, 35765–35771 [DOI] [PubMed] [Google Scholar]
- 37.Simha V., Garg A. (2009) Curr. Opin. Lipidol. 20, 300–308 [DOI] [PubMed] [Google Scholar]
- 38.Cowart L. A. (2009) Trends Endocrinol. Metab. 20, 34–42 [DOI] [PubMed] [Google Scholar]
- 39.Holland W. L., Summers S. A. (2008) Endocr. Rev. 29, 381–402 [DOI] [PMC free article] [PubMed] [Google Scholar]
Associated Data
This section collects any data citations, data availability statements, or supplementary materials included in this article.


