

Abstract
We have generated a mouse that cannot synthesize very long acyl chain (C22–C24) ceramides (Pewzner-Jung, Y., Park, H., Laviad, E. L., Silva, L. C., Lahiri, S., Stiban, J., Erez-Roman, R., Brugger, B., Sachsenheimer, T., Wieland, F. T., Prieto, M., Merrill, A. H., and Futerman, A. H. (2010) J. Biol. Chem. 285, 10902–10910) due to ablation of ceramide synthase 2 (CerS2). As a result, significant changes were observed in the sphingolipid profile of livers from these mice, including elevated C16-ceramide and sphinganine levels. We now examine the functional consequences of these changes. CerS2 null mice develop severe nonzonal hepatopathy from about 30 days of age, the age at which CerS2 expression peaks in wild type mice, and display increased rates of hepatocyte apoptosis and proliferation. In older mice there is extensive and pronounced hepatocellular anisocytosis with widespread formation of nodules of regenerative hepatocellular hyperplasia. Progressive hepatomegaly and noninvasive hepatocellular carcinoma are also seen from ∼10 months of age. Even though CerS2 is found at equally high mRNA levels in kidney and liver, there are no changes in renal function and no pathological changes in the kidney. High throughput analysis of RNA expression in liver revealed up-regulation of genes associated with cell cycle regulation, protein transport, cell-cell interactions and apoptosis, and down-regulation of genes associated with intermediary metabolism, such as lipid and steroid metabolism, adipocyte signaling, and amino acid metabolism. In addition, levels of the cell cycle regulator, the cyclin dependent-kinase inhibitor p21WAF1/CIP1, were highly elevated, which occurs by at least two mechanisms, one of which may involve p53. We propose a functional rationale for the synthesis of sphingolipids with very long acyl chains in liver homeostasis and in cell physiology.
Keywords: Enzymes/Lipid, Lipid/Phospholipid/Turnover, Lipid/Sphingolipid, Lipid/Sphingolipids, Lipid/Synthesis, Membrane/Lipids, Ceramide, Ceramide Synthesis
Introduction
Ceramide is an important signaling molecule and an important intermediate in the pathway of sphingolipid (SL)3 biosynthesis. Six mammalian ceramide synthase (CerS) genes have recently been described, with each using a relatively defined subset of fatty acyl-CoAs for N-acylation of the sphingoid base (1).
In the accompanying study (2), we report the generation of a CerS2 null mouse and characterize the changes in the ceramide and SL profile that occur in the liver of this mouse. Briefly, ceramide and downstream SLs containing very long (C22–C24) acyl chains were barely detectable, whereas C16-ceramide and sphinganine levels were significantly elevated. Prior studies have shown that interfering with ceramide metabolism by genetic manipulation has profound effects on cell physiology. For instance, targeted disruption of the gene encoding glucosylceramide synthase led to an embryonic lethal phenotype, with differentiation into primitive germ layers and patterning of the embryo abruptly halted by a major apoptotic process, possibly because of ceramide accumulation (3). Likewise, knock-out of both isoforms of serine palmitoyltransferase caused embryonic lethality (4). More recently, the ceramide transfer protein, CERT, has been shown to be essential for mouse development and embryonic survival (5). Thus, ablation of the activity of three proteins critically involved in ceramide metabolism results in embryonic lethality.
We now report that CerS2 null mice can survive for at least 20 months, but they display a remarkable phenotype in the liver, consistent with an ongoing metabolic dysfunction manifested as shortened hepatocellular life span, apoptosis, and hepatocellular regeneration, leading to pronounced hepatomegaly and hepatocellular carcinoma. These findings considerably expand the work of Imgrund et al. (6), who mainly reported pathological findings in the brain of the CerS2 null mouse but also described some liver pathology at 7 months of age. Imgrund et al. (6) did not, however, systematically address the developmental progression of the pathology or evaluate possible underlying biochemical mechanisms, as reported herein.
EXPERIMENTAL PROCEDURES
Materials
An anti-p21WAF1/CIP1 antibody was from Santa Cruz Biotechnology; anti-actin was from MP Biomedicals; anti-α-tubulin was from Sigma; and anti-glyceraldehyde-3-phosphate dehydrogenase was from Millipore. A rabbit anti-human cleaved caspase 3 antibody was from Cell Signaling Technology (Danvers, MA); a rat anti-5-bromodeoxyuridine (BrdUrd) antibody was from Serotec (Oxford, UK). The ApopTag Red in situ apoptosis detection kit was from Chemicon International (Temecula, CA).
Mice
All mice were maintained under specific pathogen-free conditions and handled according to protocols approved by the Weizmann Institute Animal Care Committee as per international guidelines.
CerS2 Activity and mRNA Expression
CerS2 was assayed as in the accompanying study (2), except that 35 μg of protein was used. mRNA expression was measured as in Ref. 2.
Serum Enzymes and Metabolites
Measurements were performed by the Pathovet Veterinary Diagnostic Services (Kfar Bilu, Israel) using a Roche Applied Science/Hitachi 917 system. Electrolytes were determined with an ion selective unit integrated in the analyzer.
Histology
For paraffin sections, tissues were collected at necropsy and fixed by immersion in 10% neutral buffered formalin. They were processed routinely, embedded in paraffin, trimmed at 4–5 μm, and stained with hematoxylin and eosin. Selected samples were stained with periodic acid-Schiff and Mason's trichrome.
Immunohistochemistry was performed on deparaffinized sections of formalin-fixed tissues using an immunoperoxidase procedure with diaminobenzidine as the chromogen. For identification of apoptotic and proliferating cells, anti-caspase 3 (1:50 dilution) and anti-BrdUrd antibodies (1:100 dilution) were used, respectively. Tissues were stained for terminal deoxynucleotidyltransferase dUTP nick end labeling (TUNEL) using the ApopTag Red in situ apoptosis detection kit, and nuclei were stained with 1 μg/ml 4′,6-diamidino-2-phenylindole. Before staining, slides were microwave-treated. BrdUrd (100 mg/kg) was applied intraperitoneally to mice 1 h prior to sacrifice.
For Oil-Red-O and X-gal staining, tissues were embedded in optimal cutting temperature (OCT) compound, (Tissue-Tek) and frozen on dry ice for cryosectioning. Slides were stained for Oil-Red-O according to the supersaturated isopropyl alcohol method. For whole mount X-gal staining, livers were fixed in 4% formaldehyde in phosphate-buffered saline at 4 °C for 30 min, washed (2 mm MgCl2, 5 mm EGTA, 0.02% Nonidet P-40, 0.01% sodium deoxycholate in phosphate-buffered saline) three times at room temperature, and stained in the dark using 1 mg/ml X-gal, 5 mm K3Fe(CN)6, 5 mm C6FeK4N6 (37 °C, overnight). Stained livers were dehydrated in graded ethanol and cleared in benzyl alcohol/benzyl benzoate (1:2, v/v) for several hours. For X-gal staining on cryosections, slides were fixed in 0.2% glutaraldehyde for 5 min and then washed and stained overnight as above. Slides were washed three times in phosphate-buffered saline and stained with hematoxylin.
Lipid Analysis
SL analyses by electrospray ionization-tandem mass spectrometry were conducted using a PE-Sciex API 3000 triple quadrupole mass spectrometer and an ABI 4000 quadrupole-linear ion trap mass spectrometer (7–10).
Hepatocyte Isolation
Hepatocytes were isolated according to published procedures (11, 12). Briefly, mice were perfused through the inferior vena cava using liver perfusion media (Invitrogen) preheated to 42 °C. Perfusion was performed using a peristaltic pump at a rate of 4 ml/min for 4 min. The buffer was immediately replaced with liver digest media (Invitrogen) preheated to 42 °C for 12 min. The liver was collected in 10 ml of plating media (Dulbecco's modified Eagle's medium supplemented with 10% lipid-reduced fetal bovine serum, 2 mm sodium pyruvate, 2% penicillin/streptomycin, 1 μm dexamethasone, and 0.1 μm insulin). The liver was dissected using tweezers and passed through a cell strainer (70 μm nylon). Cells were centrifuged at 50 × gav (5 min, 4 °C). The pellet was resuspended in Percoll. After centrifugation, dead cells were removed, and the pellet was washed twice using plating medium. Cells were resuspended in plating medium and counted using a hemocytometer and trypan blue to exclude dead cells.
Digital Gene Expression
For digital gene expression (DGE), total RNA was prepared from whole liver and extracted on Maxi RNeasy columns (Qiagen, Hilden, Germany); RNA was pooled from five 30-day-old CerS2 null and wild type (WT) female mice, and 2 μg was used for construction of the library. Tags were sequenced using an Illumina Genome Analyzer II (San Diego) and analyzed using the Illumina Pipeline software.
Library Construction
Sequence tags for digital gene expression profiling were prepared according to the Illumina NlaIII protocol and using DGE tag profiling sample prep kit (FC-1002-1005, Illumina).
Sequencing Using Illumina Genome Analyzer GAII
Using the standard cluster generation kit, version 2, cluster generation was performed. Primer hybridization and cycles of base incorporation were performed on the GAII according to the manufacturer's instructions. Image analysis and base calling were performed using the Illumina Pipeline, where sequence tags were obtained after purity filtering (6.65 × 10⁶ for CerS2 null and 5.81 × 10⁶ for WT mice) and aligned to the canonical transcriptome tag library obtained from Illumina. This was followed by sorting and counting the unique tags using Eland tag. The raw data have been submitted to the NCBI Short Read Archive under the accession number SRA008869 and is listed in supplemental Table 1. The read count per tag was normalized to the number of total reads uniquely aligned for each lane. 4.3 and 5 × 10⁶ sequence reads were obtained for the WT and CerS2 null mouse livers, respectively. Tags with less than 10 reads in the two samples were filtered out. Differential expression was assessed as in Ref. 13. The cutoff on the false discovery rate was fixed at 5% (13,000 genes) (14). Fold-changes were calculated on the normalized tag counts, and tags with a minimum fold-change of 1.5 were chosen for functional analysis. After the previous filtrations, 6,247 up-regulated tags remained, of which 6,120 had gene symbols for a total of 5,075 nonredundant gene symbols. There were 1,189 down-regulated tags, 1,126 of them with gene symbols and a total of 970 nonredundant gene symbols.
Differentially expressed genes were categorized based on Gene Ontology (GO) and Kyoto encyclopedia of genes and genomes pathways (15–17) using Ontologizer 2.0 (18) for the former and WebGestalt (19) for the latter. Ontologizer recognized 14,843, 4,213, and 780 gene symbols from the background and up- and down-regulated gene sets, respectively, whereas WebGestalt recognized the full sets of Entrez GeneIDs for all. GO and Kyoto encyclopedia of genes and genomes analyses were additionally performed using the Data base for Annotation, Visualization, and Integrated Discovery (DAVID, version 2008) (20, 21), and the results concurred. The apoptosis pathway was visualized with Ingenuity Pathway Analysis software version 8.0 (IPA, 260 Ingenuity Systems, Redwood City, CA).
Comparative analyses to other data sets was performed with Ontologizer and BioVenn (22). For the stearoyl-CoA desaturase-1 (Scd1−/−) mouse, the GO terms were taken from the supplemental material in Ref. 23 (see Tables 6 and 7, respectively, for enriched terms in down-and up-regulated genes). For the peroxisome proliferator-activated receptor α (Pparα−/−) mouse, genes with a fold-change of >1.5 were taken from supplemental Table 1 (24). For the multidrug resistance 2 (Mdr2−/−) mouse, the full list of differentially expressed genes with a fold-change of >1.8 was kindly provided by the authors (25). Where gene lists were taken, GO analysis was performed with Ontologizer. Note that the various mouse models are from different strains (supplemental Table 2).
Real Time PCR
The following primers were used: p21WAF1/CIP1 sense, 5′-TCAGAGCCACAGGCACCA-3′, and antisense, 5′-GGAACAGGTCGGACATCACCA-3′; p53 sense, 5′-GCTTCTCCGAAGACTGGATGA-3′, and antisense, 5′-TGATATCCGACTGTGACTCCTCC-3′. Conditions were as follows: 95 °C for 10 min (95 °C for 15 s; 60 °C for 1 min) for 40 cycles; 95 °C for 15 s; 60 °C for 1 min; 95 °C for 15 s; 60 °C for 15 s.
Western Blotting
The following antibodies were used: anti-p21WAF1/CIP1 (1:200 dilution), anti-actin (1:5,000 dilution), anti-α-tubulin (1:10,000 dilution), anti-glyceraldehyde-3-phosphate dehydrogenase (1:5,000 dilution). Antibodies were diluted in 5% bovine serum albumin in phosphate-buffered saline.
Statistics
All data are shown as means ± S.E. (unless indicated). p values were calculated using a one-tailed two-independent samples Student's t test. A p value <0.05 was considered statistically significant.
RESULTS
Expression and Activity of CerS2 in WT Mouse Liver
To determine the developmental profile of CerS2, mRNA expression was examined by quantitative PCR in WT mouse liver during the first 10 months of life. CerS2 mRNA expression was relatively low in fetal tissue (embryonic day 17) and at birth, and it increased until it peaked at ∼1–3 month of age. By 6 months of age, expression was reduced, reaching levels similar to those at birth, but increased again to the highest levels of expression at 10 months (Fig. 1A). CerS2 activity followed a similar general pattern to that of CerS2 mRNA expression, although activity was higher in fetal tissue than at birth (Fig. 1B, inset). After birth, CerS2 activity increased and peaked, along with mRNA levels, at ∼1–2 months of age (Fig. 1B). Again, similar to mRNA levels, CerS2 activity decreased at 6 months, but did not reach levels as low as those found at birth, and increased at 10 months. Together, these findings suggest that CerS2 expression is tightly regulated during development and imply that CerS2 may play a vital role in postnatal liver development and physiology.
FIGURE 1.

CerS2 expression and activity during development of WT mice. A, CerS2 mRNA expression in WT mice; n = 3. The inset shows an expanded graph of mRNA expression levels at embryonic day 17, birth, and 7 days. mRNA levels at 1 month were statistically different (p < 0.05) from levels at day 0. The value at 6 months was statistically different from that at 5 months (p < 0.05), and the value at 10 months was statistically different from 6 months (p < 0.005). B, CerS2 activity was assayed using C24:1-CoA in WT mice; n = 3–5. The inset shows an expanded graph of CerS activity at embryonic day 17, birth, and 7 days. CerS2 activity at 1 month was statistically different (p < 0.001) from levels at 0 days. CerS2 activity at 6 months was statistically different from that at 1 month (p < 0.005); although activity appeared to increase at 10 months, the value was just outside the range of statistical significance.
Liver Dysfunction in CerS2 Null Mice
Because CerS2 activity increases significantly during post-natal development until ∼1–2 months of age in WT mice (Fig. 1B), we reasoned that pathological changes might occur at around this time in CerS2 null mice. Serum alanine aminotransferase, aspartate aminotransferase, alkaline phosphatase (Fig. 2), and cholesterol (Fig. 3) were elevated at 1 month of age and further elevated at 11 months (Figs. 2 and 3), indicative of liver damage (26). Hypoglycemia was also observed, albeit to a limited extent at 1 month, which became statistically significant at 11 months (Fig. 3). Hints that pathology is tissue-specific were obtained by the lack of change of enzymes and metabolites used to diagnose dysfunction of other organs, including kidney (creatinine, urea, and phosphate) (Fig. 3). Interestingly, kidney shows similarly high levels of CerS2 mRNA expression as liver (9) and similar changes in the SL profile in the CerS2 null mouse (see Fig. 8B). However, renal dysfunction was not observed in CerS2 null mice of up to 11 months of age.
FIGURE 2.
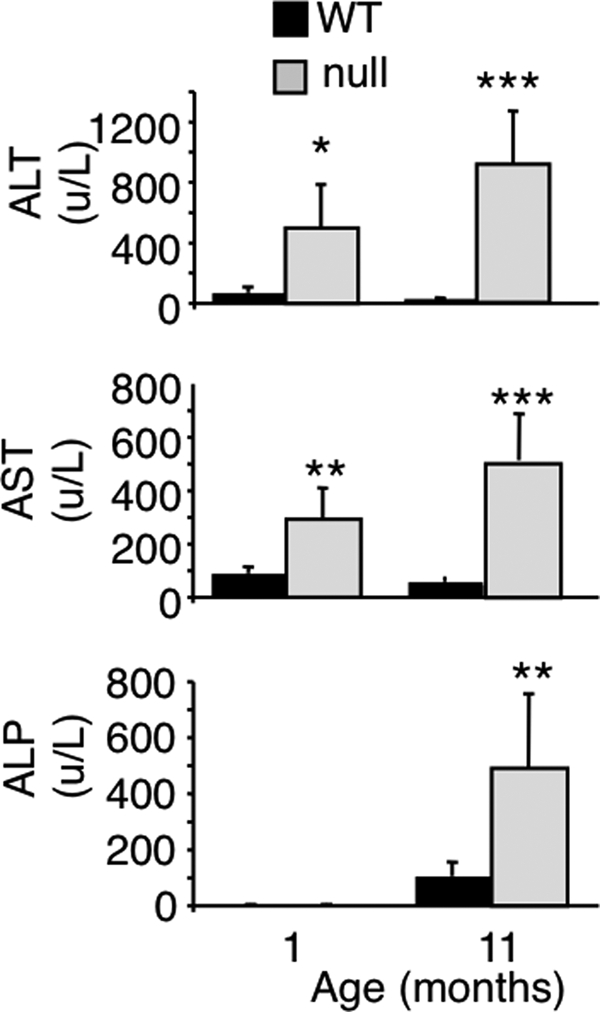
Serum levels of liver enzymes at 1 and 11 months of age. ALT, alanine aminotransferase; AST, aspartate aminotransferase; ALP, alkaline phosphatase. n = 5. *, p < 0.05; **, p < 0.01; ***, p < 0.001.
FIGURE 3.

Enzyme and metabolite levels in serum from CerS2 null mice. LDH, lactate dehydrogenase. n = 5. **, p < 0.01; ***, p < 0.001.
FIGURE 8.

Lack of renal pathology in the CerS2 null mouse. A, transverse section of the kidney of an 11-month-old CerS2 null mouse. The tips of the interlobar veins, located near the corticomedullary junction, are uniformly small (arrows). These structures were suggested to be tissue clefts (6), but our data suggest that they are normal renal veins (see further discussion in supplemental Fig. 1). B, SL levels were measured by electrospray ionization-tandem mass spectrometry in 4-month-old kidney from WT and CerS null mice. n = 2. *, p < 0.05; **, p < 0.01.
Gross Pathology of the Liver of CerS2 Null Mice
The life span of CerS2 null mice was shorter than that of WT mice, with the mean age of natural death at 5.1 ± 3.7 months (Fig. 4A); however, note that the actual age of survival is much older because many mice were sacrificed for humane reasons and therefore did not die a natural death, and other mice were sacrificed for use in experiments. Many mice survived longer, with some surviving up to 20 months (see for instance, Fig. 4B). Based on the survival rates, and on the pathological findings in the liver, the CerS2 null mice were divided into three groups for further analysis, P0 (i.e. day of birth) to 4 months of age, 4–7 months, and 8–20 months. Although there was a good correlation between the age of the mice and the lesion severity, exceptions occurred that can probably be ascribed to the mixed genetic background of the mice.
FIGURE 4.

General features of the liver in CerS2 null mice. A, survival curve for CerS2 null mice was generated analyzing the time of natural death of 39 CerS2 null mice and their littermate WT controls. Each point in the CerS2 null curve represents the age of a mouse when it died naturally. The data refers to the F2 (C57BL/6 × 129SVJ) mixed genetic background only and do not take into account mice that were sacrificed for humane reasons or for use in experiments. B, macroscopic appearance of the liver. The liver on the left is from a 13.5-month-old mouse. It is enlarged and contains multiple nodules of variable color. The liver in the middle is from a 20-month-old mouse. It is markedly distorted by numerous coalescing nodules (and a cyst). The liver on the right is from a 13.5-month-old WT control. C, liver/body weight ratio of CerS2 null (n = 20) versus WT mice (n = 18).
In CerS2 null mice up to 4 months of age, the only gross abnormalities were reduced body size and fat deposits. Beyond 4 months of age, the liver was grossly abnormal. Its capsular surface was irregular due to the presence of randomly scattered nodules of variable size and color (Fig. 4B). The color of many nodules was similar to that of the surrounding parenchyma, but some were pale, suggestive of focal fatty accumulation, and others were orange-tinged, consistent with localized bile retention (Fig. 4B). The color of the intervening parenchyma was normal, and the liver edges were usually sharp.
Some (3 out of 20) CerS2 null mice >8 months of age showed pathology similar to that in the 4–7 month group. However, in the majority of older mice, the liver was characterized by marked distortion of the lobar architecture as a result of widespread nodular proliferation and coalescence. Most nodules were solid, although a few were cystic (Fig. 4B). A pronounced increase in the size and weight of the liver (i.e. hepatomegaly) was also observed (Fig. 4C). In half of the CerS2 null mice, the liver showed an ∼300% increase in liver/body weight ratio. Liver weight reached 15.8–21.4% of body weight in cases without hepatocellular carcinoma and 18.5–32.7% in cases with hepatocellular carcinoma (see below).
Microscopic Features of the CerS2 Null Mouse Liver
CerS2 is expressed in a zonal pattern in heterozygous mice (CerS2GT/+), found at high levels in periportal hepatocytes but at lower levels in centrilobular hepatocytes (Fig. 5A). In CerS2 null mice up to ∼4 months of age, histological abnormalities included increased apoptosis at 21 days of age and increased mitosis by 30 days of age (Fig. 5, B and C), heterogeneity in hepatocellular size (anisocytosis and anisokaryosis), and hypertrophy and hyperplasia of Kupffer cells. Moreover, live hepatocytes could not be isolated from 30-day-old CerS2 null mice (Fig. 5D).
FIGURE 5.

Enhanced rates of apoptosis and proliferation in the CerS2 null mouse. A, whole mount X-gal staining of WT (upper left) and heterozygous (CerS2GT/+) (upper right) liver (bar = 2 mm) from 5-month-old mice. Lower panel shows X-gal staining on a 20-μm thick cryosection. CerS2 is highly expressed in the portal triad region (p) and to a lesser extent in the centrilobular region (c) (bar = 250 μm). B, upper panel shows the number of cleaved caspase 3-positive (apoptotic) cells; middle panel shows the number of BrdUrd (BrdU)-positive (replicating) cells, and bottom panel shows the fold-change of each calculated for littermate controls. 10 images were collected and analyzed per mouse. Day 14, n = 5–6; day 21, n = 2–5; day 30, n = 5–6. *, p < 0.05; **, p < 0.005. C, immunohistochemical staining for cleaved caspase 3 (bar = 50 μm), TUNEL (bar = 100 μm; 4′,6-diamidino-2-phenylindole labeling (cell nuclei) is blue, and TUNEL is red (indicated by yellow circles)), and BrdUrd (bar = 250 μm) on liver sections of 30-day-old mice. D, hepatocytes were isolated from 1-month-old WT and CerS2 null mice. n = 3 ± S.D.
Hepatocellular anisocytosis and anisokaryosis were prominent from ∼4 months of age and affected the entire parenchyma, concurrent with abnormally elevated levels of apoptosis and mitosis. Randomly scattered within the altered parenchyma were 2–4 mm diameter hepatocellular nodules with round to irregular and variably distinct outlines (Fig. 6, A and B). In most cases, hepatocytes within the nodules were 5–10-fold larger than those in the surrounding parenchyma, where hepatocytes were often smaller than normal and crowded (Fig. 6, A–E). The nodules often included portal triads (Fig. 6G) and were morphologically most compatible with nodules of regenerative hepatocellular hyperplasia (27). The lobular architecture of the parenchyma was preserved but multifocally compressed and distorted (Fig. 6, B, D, and G). In the pre-existing parenchyma, portal triads were often crowded, and there was multifocal moderate to marked bile duct and oval cell hyperplasia, accompanied by very mild collagen deposition (Fig. 6, C–E). Small clusters of lipofuscin-laden macrophages were observed predominantly in the portal triads with minimal lymphoplasmacytic infiltration (Fig. 6, F and G). Kupffer cell hypertrophy and hyperplasia were present in the parenchyma and within the nodules. An overall reduction in cytoplasmic glycogen within hepatocytes was observed and was especially pronounced in hepatocytes within nodules (Fig. 6L). The CerS2 promoter was active in the pre-existing parenchyma but not in hepatocytes within nodules (Fig. 6, M and N). Interestingly, in the CerS2 null mouse, there was no zonal expression of the CerS2 promoter in the parenchyma (Fig. 6, M and N).
FIGURE 6.

Histological analysis of the liver of 4–10-month-old CerS2 null mice. A, low magnification of a liver from a 4-month-old CerS null mouse. Four randomly distributed nodules of regenerative hyperplasia are indicated. Nodules 2–4 are more distinct because the hepatocytes in them are vacuolated. In the remaining parenchyma, the normal lobular architecture is retained. Portal areas are prominent due to bile duct and oval cell hyperplasia. The boxed area is shown in B. B, portions of two nodules of regenerative hyperplasia. The cytoplasm of hepatocytes in the nodules stains more lightly and shows moderate vacuolation. The intervening parenchyma is composed of small hepatocytes. Oval cell hyperplasia is indicated by arrowheads, and a bile duct by an arrow. C, pronounced bile duct and oval cell hyperplasia. Lipofuscin-laden macrophages are identified by arrowheads. D, marked hepatocellular heterogeneity. On the left are three coalescing nodules, in which morphologic features vary. The rest of the field is occupied by parenchyma, considered to be pre-existing. The lobular arrangement is not apparent and the hepatocytes are not organized into orderly cords and are of variable size. E, high magnification of pre-existing parenchyma showing variation in hepatocellular size and multifocal bile duct and oval cell hyperplasia (arrows). An apoptotic hepatocyte is indicated by an arrowhead. F, low magnification of a liver from a 10-month-old CerS2 null mouse with three coalescing nodules. Nodule 2 is the easiest to identify because it is composed of vacuolated hepatocytes and is consequently pale. The outlines of this nodule are very irregular. Nodule 3 extends to the right edge of the field. Residual pre-existing parenchyma is compressed to the edges (asterisks). The boxed area is shown in G. G, high magnification showing part of nodule 2, composed of large and vacuolated hepatocytes, and part of nodule 3 composed of large hepatocytes. The pre-existing parenchyma, compressed into a triangular shape, is composed of small hepatocytes (asterisks). A bile duct is present in nodule 2 (arrow) and a portal triad with mild oval cell hyperplasia is entrapped at the interface between the two nodules (arrowhead). H, periodic acid-Schiff staining for glycogen on a liver sample from a 6-month-old WT mouse. There is strong and regular zonal staining. The boxed area is shown in I. I, high magnification showing the centrilobular distribution of glycogen. A bile duct is identified (arrow). J, periodic acid-Schiff staining for glycogen on a liver sample from a 6-month-old CerS2 null mouse. There is an overall reduction in the amount of glycogen affecting the pre-existing parenchyma and three nodules of regenerative hyperplasia (asterisks). The boxed area is shown in K. K, amount of glycogen in the pre-existing parenchyma, located above the black line, is reduced, and its distribution is irregular. The black line demarcates the top edge a nodule of regenerative hepatocellular hyperplasia. Hepatocytes in the nodule are larger than those in the surrounding parenchyma and most contain no or little glycogen, although exceptions occur (arrowhead). L, low magnification of a liver sample from a 4-month-old mouse stained with Oil-Red-O. Four nodules can be identified due to their positive staining (asterisks). M, consecutive section of a parallel sample to that shown in L stained with lacZ. Positive staining for lacZ is present in the pre-existing parenchyma but not in the four nodules (asterisks). The boxed area is shown in N. N, high magnification showing the discrepant status of hepatocytes with respect to CerS2 promoter activity. The large hepatocytes on the left are located in a nodule and do not show lacZ staining. The small hepatocytes of the pre-existing parenchyma, located on the right, are positive.
The histological picture in CerS2 null mice ∼1 year of age and older was more complex due to the relentless progression of the hepatopathy. Individual nodules were larger and frequently coalesced (Fig. 7A). In some cases, the pre-existing parenchyma was virtually obliterated or reduced to scant tissue entrapped among the nodules or at the edges (Fig. 6, F and G). Hepatocytes within nodules commonly showed degenerative changes such as pronounced megalocytosis, irregular shapes, microvesicular or macrovesicular vacuolation (Fig. 6, B and G), alteration in cytoplasmic tinctorial properties, cytoplasmic granularity, and intracytoplasmic globular hypereosinophilic material (Mallory bodies) (Fig. 7, B and C). Interestingly, a specific type of degenerative change usually characterized an individual nodule and was different from the one affecting an adjacent nodule, suggesting clonal expansion. This feature assisted in the demarcation of the nodules and highlighted the irregular outlines of some of the nodules (Fig. 6, D, F, and G). Most of the nodules were nodules of regenerative hepatocellular hyperplasia (Fig. 6, A, D, F, and G, and Fig. 7A).
FIGURE 7.

Histological analysis of the liver of older CerS2 null mice. A, low magnification of a section through the right median lobe of a 12- month-old CerS2 null mouse liver. The lobe is markedly enlarged, and its capsular outline is convex due to replacement of the normal parenchyma by coalescing nodules. All are nodules of regenerative hepatocellular hyperplasia. B, high magnification showing the typical appearance of hepatocytes within nodules of regenerative hyperplasia. The hepatocytes are not organized into cords, and their size is variable, and large cells abound. The arrowhead indicates a focus of spindle cell proliferation, probably oval cell hyperplasia. An apoptotic cell is identified by an arrow. C, high magnification showing hepatocytes with round intracytoplasmic structures consistent with Mallory bodies (arrowhead). A portal triad showing mild oval cell hyperplasia located in the nodule is identified by an arrow. D, high magnification of florid oval cell hyperplasia. E, hepatocellular carcinoma. The field is occupied by two thick trabeculae composed of neoplastic hepatocytes. The inset shows subgross magnification of a similar tumor. F, hepatocellular carcinoma. This tumor is less well differentiated than the one shown in E. The neoplastic hepatocytes have a high nuclear/cytoplasmic ratio, and mitotic figures are common (arrowheads). The inset shows differentiation into glandular (adenoid) structures in a hepatocellular carcinoma from another mouse. G, low magnification of a liver with cystic degeneration/spongiosis hepatitis. The lesion consists of multiple variably sized cavities. The boxed area is shown in H. H, in the lower half there are several cavities (asterisks) lined by hepatocytes. In the surrounding parenchyma, there is marked bile duct and oval cell hyperplasia (arrows). The inset shows cystic degeneration from another mouse exhibiting accumulation of proteinaceous material within the cavity. I, high magnification of two small cysts of spongiosis hepatitis with walls composed of hepatocytes (arrowheads). Free-floating cells and a small amount of eosinophilic fluid are present in the cavities.
Hepatocellular carcinoma was diagnosed in some (6 out of 20) CerS2 null mice older than 8 months of age (three males and three females), with four of them only diagnosed at 14 months and older. The carcinomas were mostly well differentiated and consisted of a moderately pleomorphic population of hepatocytes arranged in solid, trabecular, or adenoid patterns (Fig. 7, E and F). Remarkably, the degree of hepatocellular pleomorphism was often more striking in the nodules of regenerative hepatocellular hyperplasia than in the carcinomas (compare Fig. 7, B and C with Fig. 7, E and F).
Cystic degeneration/spongiosis hepatitis was observed in 5 out of 20 CerS2 null mice >8 months of age, with the earliest case at 10.5 months. The lesion was characterized by formation of cavities filled with eosinophilic fluid and lined by hepatocytes (Fig. 7, F–I). The fluid contained small groups of cells often with vacuolated cytoplasm, interpreted as sloughed hepatocytes or macrophages (Fig. 7, H and I). Groups of lymphocytes and a low number of neutrophils were mixed with the cells forming the walls of these cavities. In three mice, the lesion was small and consisted of a few cavities, ∼500 μm in length, adjacent to each other. In two mice, this lesion formed grossly visible cystic masses. Three cases had concurrent hepatocellular carcinoma, but except for one case, where the cystic change was located in the tumor, the lesions appeared to be located in nodules of regenerative hepatocellular hyperplasia (Fig. 7, H and I). Oval cell hyperplasia was frequently pronounced. In sporadic cases, foci of moderate inflammation and fibrosis were present. No significant pathologic changes were identified in heterozygotes (data not shown). In addition, no significant histological abnormalities were identified in the kidney of CerS2 null mice at any age, even though the changes in the SL profile of the kidney were similar to that of liver (Fig. 8 and supplemental Fig. 1).
Gene Expression Is Significantly Altered in the CerS2 Null Mouse
To obtain mechanistic insight into the pathological changes discussed above, gene expression was examined in livers from 30-day-old CerS2 null mice and compared with WT mice using high throughput Illumina DGE deep sequencing. Reads were matched to Illumina canonical transcripts and filtered for perfect matches with a minimum of 10 reads per tag in at least one genotype and a false discovery rate of 0.05. 13,000 tags passed these criteria, and of these, 6,247 (representing 5,075 nonredundant gene symbols) were up-regulated in the CerS2 null mouse, and 1,189 (representing 970 nonredundant gene symbols) were down-regulated. Kyoto encyclopedia of genes and genome pathways (Table 1) and GO analysis (supplemental Fig. 2) were independently performed for down- and up-regulated genes.
TABLE 1.
KEGG pathway enrichment analysis of differentially expressed genes in 30-day-old CerS2 mouse liver versus WT
KEGG pathway analysis was performed with WebGestalt using the hypergeometric test. The top 20 pathways enriched in both down-regulated and up-regulated genes are shown. The top pathway of both up- and down-regulated genes is shown graphically in supplemental Fig. 2. PPAR is peroxisome proliferator-activated receptor; MAPK, mitogen-activated protein kinase.
| p value | |
|---|---|
| Down-regulated genes | |
| PPAR signaling pathway | 1.01E-10 |
| Metabolism of xenobiotics by cytochrome P450 | 7.55E-08 |
| Insulin signaling pathway | 1.60E-07 |
| Arachidonic acid metabolism | 9.85E-07 |
| Linoleic acid metabolism | 1.14E-06 |
| C21-steroid hormone metabolism | 3.95E-06 |
| Pyruvate metabolism | 1.15E-05 |
| Benzoate degradation via CoA ligation | 1.20E-05 |
| Nitrogen metabolism | 2.21E-05 |
| Glycolysis/gluconeogenesis | 2.34E-05 |
| Glycine, serine, and threonine metabolism | 4.28E-05 |
| Fatty acid metabolism | 5.03E-05 |
| Starch and sucrose metabolism | 1.09E-04 |
| Androgen and estrogen metabolism | 1.11E-04 |
| Tyrosine metabolism | 2.88E-04 |
| ABC transporters, general | 4.58E-04 |
| Galactose metabolism | 7.13E-04 |
| Butanoate metabolism | 8.94E-04 |
| Fatty acid biosynthesis | 9.57E-04 |
| Alkaloid biosynthesis II | 1.15E-03 |
| Up-regulated genes | |
| Cell cycle | 6.57E-12 |
| Focal adhesion | 1.51E-09 |
| Tight junction | 1.01E-08 |
| Pyrimidine metabolism | 1.38E-08 |
| Regulation of actin cytoskeleton | 1.18E-07 |
| Pancreatic cancer | 8.04E-07 |
| Adherens junction | 1.25E-06 |
| Amino sugars metabolism | 2.81E-06 |
| MAPK signaling pathway | 1.36E-05 |
| Ribosome | 3.69E-05 |
| Leukocyte transendothelial migration | 8.21E-05 |
| Proteasome | 9.34E-05 |
| Huntington disease | 1.26E-04 |
| B cell receptor signaling pathway | 1.61E-04 |
| Chronic myeloid leukemia | 3.16E-04 |
| Antigen processing and presentation | 4.30E-04 |
| Gap junction | 5.37E-04 |
| Glioma | 5.82E-04 |
| Aminoacyl-tRNA biosynthesis | 8.98E-04 |
| Apoptosis | 9.30E-04 |
Down-regulated genes were significantly enriched in pathways associated with intermediary metabolism, such as those of lipid and fatty acid metabolism and sugar homeostasis (Fig. 9, Table 1, and supplemental Fig. 2A). GO analysis supported these results (see, for instance, the fatty acid metabolic process in Fig. 9 and supplemental Fig. 2). The top two enriched pathways, the peroxisome proliferator-activated receptor signaling pathway (supplemental Fig. 3A) and the metabolism of xenobiotics by cytochrome P450, are well known liver pathways. Arachidonic and linoleic acid metabolism pathways are largely overlapping, as linoleic acid is a substrate for arachidonic acid synthesis. Changes in sugar homeostasis are consistent with decreased blood glucose levels (Fig. 3).
FIGURE 9.

Functional enrichment analyses of down-regulated genes in 30-day-old CerS2 mouse liver versus WT. GO analyses of fatty acid metabolic process and related terms, enriched in down-regulated genes. Gene Ontology is built as a tree, with terms lower in the hierarchy (children) directly derived from the terms above them (parents). It is presented here as a directed acyclic graph with the arrows pointing in the direction of the parent-child relationship. The colored arrows signify special relationships: blue is a “part of” the next term down, and green signifies a regulatory relationship.
In the up-regulated genes (Fig. 10 and Table 1), the enriched pathways were dominated by genes associated with regulation of cell growth and death, with cell cycle, multiple forms of cancer, and apoptosis (Fig 10, supplemental Fig. 2D, Fig. 3B, and Fig. 4 and Table 1). This is in agreement with the pathological findings of up-regulated cell growth and death in the CerS2 null mouse liver (Fig. 5). The apoptotic pathway was also enriched (supplemental Fig. 4), but no changes were observed in autophagy-related genes, a pathway that has been linked to CerS2 down-regulation by siRNA in cultured SMS-KCNR neuroblastoma and MCF-7 breast cancer cells (28). Cell structure-related pathways (i.e. focal adhesion, tight, adherens, and gap junctions, and regulation of actin cytoskeleton) were also significantly enriched in the up-regulated genes (Table 1).
FIGURE 10.

Functional enrichment analyses of up-regulated genes in 30-day-old CerS2 mouse liver versus WT. GO analyses of cell cycle (A) and cell death (B) enriched in up-regulated genes.
Additional changes observed by DGE are consistent with the pathological changes observed in the CerS2 null mouse liver and suggest that multiple cellular signaling pathways are modified upon inhibition of very long acyl chain SL synthesis. For example, of the genes involved in ceramide metabolism (2), neutral sphingomyelinase 2 is significantly up-regulated (∼20-fold, false discovery rate of = 2.29 × 10⁻⁶), consistent with the increase in enzyme activity.
Comparison of Gene Expression in the CerS2 Null Mouse with Other Mouse Liver Models
Comparative analysis with other mouse liver disease models was performed to test the uniqueness of the changes in gene expression in the CerS2 null mouse. Three data sets were chosen, each representing a unique pathology (for details, see supplemental Table 2). When terms enriched in GO4 in up- and down-regulated genes were compared between CerS2 null mice and Scd1−/− mice, there was very little overlap (2 terms) in down-regulated genes (Fig. 11 and supplemental Table 3) and slightly more (15 terms) in up-regulated genes. The up-regulated genes are very general, related to basic cellular functions. In contrast, the Pparα−/− mouse (Fig. 11 and supplemental Table 3) displayed no overlapping terms in up-regulated genes but some overlap in down-regulated genes (11 terms), mainly connected to lipid metabolic processes. This might be expected in the case of Pparα as it directly regulates lipid metabolism, and the Pparα pathway was the top down-regulated pathway in the DGE analysis of CerS2 null mice. In both of the above cases, the overlap of significant terms is about one-third of the other data set, and ∼9% of the CerS2 null data set.
FIGURE 11.

Comparison of enriched GO terms in various mouse models. See supplemental Table 3 for more information.
In the case of Mdr2−/− (Fig. 11), there were no significantly enriched GO terms in the down-regulated genes. However, there is considerable enrichment in up-regulated genes, and the overlap in the number of terms (42 terms) and the overlap in the percent of the CerS2 null data set (∼23%) are also larger. The overlapping terms (supplemental Table 3) fall into several categories such as antigen processing, apoptosis and cell death, cell cycle, and actin-related processes. Such an overlap might be expected given the similarities between the two models, which both display a spontaneous liver pathology causing death and tissue regeneration.
We next examined levels of Scd1, Pparα, and Mdr2 in the CerS2 null mouse, as these genes are all critical for hepatic function (summarized in supplemental Table 4). The major transcript of Scd1 (NM_009127; supplemental Fig. 5) decreases 1.5-fold. Pparα is below the threshold of detection in both WT and CerS2 null mice. Mdr2 is up-regulated 1.9-fold in the CerS2 null mouse. This suggests that some of the overlapping GO terms are related to general liver damage rather than being CerS2-specific. Thus, there are some overlapping changes in gene expression between the CerS2 null mouse and other mouse liver models, but the vast majority of the changes in expression are unique to CerS2.
p21 Is Dysregulated in the CerS2 Null Mouse
To further explore changes in the cell cycle, we studied p21WAF1/CIP1, a regulator of the G1 and S phases (29), which was up-regulated 10-fold according to DGE analysis. In WT mouse liver, p21WAF1/CIP1 protein levels decreased with age and were virtually undetectable by 30 days (Fig. 12A). In contrast, p21WAF1/CIP1 remained significantly higher in CerS2 null mice and was elevated by ∼20-fold compared with WT at 3.5 months of age (Fig. 12A). p21WAF1/CIP1 can be regulated by a number of mechanisms, including mRNA and protein stability (30), with both involved in the p21WAF1/CIP1 elevation in CerS2 null mice, because protein levels are up-regulated from birth to 14 days of age (Fig. 12A), a time at which p21WAF1/CIP1 mRNA levels are unaltered compared with WT (Fig. 12B). At later stages (i.e. 30 days), both p21WAF1/CIP1 mRNA and protein levels are up-regulated, the former possibly by a p53-dependent process (Fig. 12B). No changes were observed in kidney p21WAF1/CIP1 levels (Fig. 12A), consistent with the lack of kidney pathology (Fig. 8).
FIGURE 12.

Changes in p21WAF1/CIP1 and p53 in CerS2 null mouse liver. A, Western blot showing changes in p21WAF1/CIP1 levels. The values show the fold difference in p21WAF1/CIP1 levels in WT (+/+) versus CerS2 null mice (−/−), normalized to glyceraldehyde-3-phosphate dehydrogenase (GAPDH). The two right-hand lanes show that there is no change in p21WAF1/CIP1 levels in kidney. B, quantitative PCR analyses showing transcriptional up-regulation of p21WAF1/CIP1 and p53 in CerS2 null mouse liver relative to WT littermate controls, and normalized to glyceraldehyde-3-phosphate dehydrogenase. n = 2–6; *, p < 0.05; **, p < 0.01.
Altered Cytoskeletal Proteins in CerS2 Null Mice
Significant elevation of tubulin and actin was also observed in CerS2 null mice. No changes were seen until 30 days of age, when levels of both were increased by ∼2-fold compared with WT liver (Fig. 13). The elevation in levels of cytoskeletal proteins are also in harmony with DGE data (supplemental Fig. 3 and Table 1) and might reflect increased liver regeneration in CerS2 null mice (Fig. 6). Similar to results with p21WAF1/CIP1 (Fig. 12), no changes were observed in actin or tubulin levels in the kidney (Fig. 13).
FIGURE 13.

Changes in cytoskeletal proteins in CerS2 null mouse liver. Western blots showing changes in α-tubulin and actin levels in liver after 30 days of age and lack of change in kidney.
DISCUSSION
Ceramide has been suggested to act as a common molecular intermediate linking several metabolic pathways involved in stress (31, 32). Since the discovery of the six mammalian CerS (1), considerable effort has been invested in attempting to understand the functional significance of each of these genes in various physiological and pathophysiological states. A number of studies have shown changes in levels of expression or activity of CerS in mammalian cell lines, particularly in cancer cells and tissues (see, for example, Refs. 33–40), but none have directly addressed the functional significance of CerS in live animals. Two studies recently proposed an important role for CerS genes and for the acyl chain composition of ceramides in Caenorhabditis elegans. Two of the putative three C. elegans CerS genes, hyl-1 and hyl-2, which are thought to synthesize ceramides with distinctive acyl chains, had a disparate effect on the ability of C. elegans to survive anoxic conditions (41), and deletion of hyl-1 and lagr-1 caused germ cell death (42). The vast number of SL structures that exist in mammalian cells, in contrast to the relatively small number in C. elegans or in yeast (43), renders much more difficult the determination of the precise functional roles of particular ceramide or SL species in mammals.
Our study showing severe and relentlessly progressive hepatopathy in the CerS2 null mouse provides direct evidence for the nonredundancy of CerS enzymes, and for a tissue-specific functional role for SLs of defined acyl chain length in mammalian cell physiology. Pathology in the CerS2 null mouse liver only develops after about 1 month of age, at approximately the same time that the activity and expression of CerS2 reaches a plateau in the WT mouse. However, levels of very long acyl chain ceramides and SLs do not change significantly during development of WT mice, with levels at birth similar to those in adult mice (2).
The morphological features of the CerS2 null mouse liver suggest an ongoing metabolic dysfunction leading to shortened hepatocellular survival with death via apoptosis followed by hepatocellular regeneration. In contrast to the zonal expression of the CerS2 promoter, the distribution of hepatocellular changes is nonzonal, which may imply secretion and diffusion of a soluble metabolite or toxic agent.
The morphologic features of the hepatopathy indicate prolonged parenchymal damage similar to that caused by chemical exposure, infection, or nutritional disorders (44). Notable in their absence were significant fibrosis and inflammation. Because there was no indication of immune compromise, the absence of inflammation can be ascribed to hepatocellular death via apoptosis (which does not induce inflammation and thus fibrosis (45)) and not necrosis. Despite the profound biochemical and morphological changes in the liver, there was no evidence supporting liver failure as the cause of death.
The vast majority of the nodules in the CerS2 null mouse were nodules of hepatocellular regenerative hyperplasia caused by ongoing hepatocellular damage (27).5 A few nodules fulfilled the histological criteria of adenoma, but it was difficult to make this diagnosis in light of the widespread parenchymal damage (46, 47). In contrast, the diagnosis of hepatocellular carcinoma (in ∼30% of older mice) was straightforward (27, 48). The late onset and relatively low rate of neoplastic transformation indicate that inactivation of CerS2 is not directly mutagenic and that carcinogenesis in these mice is attributable to sustained hepatocellular proliferation (49, 50). Spongiosis hepatitis was diagnosed in ∼20% of older mice, a lesion well documented in rats but very rare in mice, although it may be more common following exposure to hepatocarcinogens (50, 51).
The hepatomegaly in the CerS2 null mouse is striking. A 10–50% increase in liver weight is a typical response to xenobiotic exposure in rodents, although increases >100% have been documented (52). The largest non-neoplastic increase in rodent liver weight in toxicological studies is caused by chemicals that induce peroxisome proliferation, where liver weight may reach 10% of body weight (53).
The hepatopathy shares some morphological features with those found in livers of mice and rats fed fumonisin B1 (FB1), a CerS inhibitor that also causes elevation of sphinganine levels (54, 55). Administration of FB1 to mice for 2 weeks induces apoptosis, anisocytosis, and a slight increase in liver weight (56), and after a 90-day administration, it causes increased mitotic figures, cytomegaly, and appearance of scant inflammatory infiltrates and pigmented macrophages (57). Centrilobular apoptosis, necrosis, hypertrophy, pigmentation, cytoplasmic vacuolization and Kupffer cell hyperplasia have also been reported in FB1-treated female mice (58), whereas in rats, renal lesions predominate (58).6 FB1 can act as a hepatocarcinogen in mice and rats (57, 58) and was reported as the first example of a nongenotoxic agent producing tumors through a mode of action involving apoptotic necrosis, atrophy, and consequent regeneration (49).7 Thus, there are a number of common histological features observed in both CerS2 hepatopathy and following exposure to FB1, including increased hepatocellular turnover, nonzonal distribution, absence of significant inflammation, Kupffer cell hyperplasia, pigment (lipofuscin) accumulation, and a relatively low rate of neoplastic transformation (57). The non-neoplastic hepatopathy in CerS2 null mice appears to be significantly more severe than the effects in the liver after FB1 exposure. Presumably, the common hepatopathy may be related to the elevated levels of sphinganine in both the CerS2 null mouse and after FB1 exposure. The lack of effect on kidney function in the CerS2 null mouse (Fig. 8 and supplemental Fig. 1) implies organ-specific functions for CerS genes and for SLs of defined acyl chain lengths.
The pathological findings are consistent with the results obtained by DGE, in which pathways related to cell-cell and cell-matrix interactions were up-regulated. Cell-matrix junctions play a prominent role in maintaining the integrity of tissues. This is consistent with the observation of nonzonal liver tissue damage and the changes in membrane morphology (2). As a result of changes in membrane morphology, levels of transcription of related pathways are increased, which might be involved in hepatocyte regeneration and death. Moreover, comparison of enriched GO terms between the CerS2 null mouse and three mouse liver disease models showed the uniqueness of the changes in gene expression in the CerS2 null mouse.
At present, we are unable to delineate the precise molecular details leading to hepatopathy, particularly because levels of at least three SLs change significantly. It does, however, seem likely that some of the hepatopathy in the CerS2 null mouse is caused by elevated sphinganine levels (see above), some by reduced levels of very long acyl chain SLs, and some by elevated levels of long acyl chain SLs. This is consistent with observations that different SL species engage distinct cellular signaling pathways. For instance, a relationship has been shown between ceramides of different acyl chains lengths and apoptosis (59), C24:1-lactosylceramide activates Lyn in human neutrophils (60), and levels of cell cycle-regulating proteins such as p21WAF1/CIP1 can be regulated by sphingoid long chain bases such as sphinganine (61). p21WAF1/CIP1 is a negative regulator of cell proliferation, but its levels are elevated in our study even though cell proliferation is increased. Nevertheless, p21WAF1/CIP1 is elevated in various physiological situations such as DNA damage, cell differentiation, and senescence (62), and our finding that p21WAF1/CIP1 is elevated by both transcriptionally independent and dependent pathways supports the notion that several factors may be independently involved in the initiation and progression of pathology.
Irrespective of the specific roles of the individual SLs and SL metabolites, our study demonstrates that CerS2 is a major molecular player in the maintenance of normal liver homeostasis. In addition, the results presented in this study and the accompanying study (2) are a significant advance toward unraveling the basis for the remarkable chemical and structural diversity of mammalian lipids, by the demonstration that inhibition of very long acyl chain SL synthesis has a profound effect on hepatocyte physiology and pathophysiology.
Supplementary Material
Acknowledgments
We thank Reut Pienik, Hani Dekel, Helena Sabanay, Raya Eilam, and Eyal Kalo for excellent technical assistance and Drs. Eitan Galun, Eli Pikarsky, Orit Papo, Eyal Steyer, Rifat Safadi, Amit Sharon, Hanna Mandel, Joseph Alroy, Boaz Nadler, Yisrael Parmet and Ken Voss for helpful discussions.
This work was supported, in whole or in part, by National Institutes of Health Grant GM076217. This work was also supported by Israel Science Foundation Grant 1404/07 and by The Minerva Foundation.

The on-line version of this article (available at http://www.jbc.org) contains supplemental Figs. 1–5 and Tables 1–4.
The significance of biological change is more conserved at the level of biological processes rather than at the level of specific genes, as a specific process can be affected by numerous genes.
Some difficulty was encountered with the classification of the nodules. In general, the following types of hepatocellular nodules are recognized in the liver of mice: foci of cellular alteration, regenerative hepatocellular hyperplasia, hepatocellular adenoma, and hepatocellular carcinoma (27). Classification of the nodules as foci of cellular alteration was rejected because these are characterized by no or only minimal compression at the margins, lack of obvious disruption to the parenchymal architecture, and partial or complete continuity of their plates with the surrounding parenchyma. Despite the classification of the nodules as nodules of hepatocellular regenerative hyperplasia, the nodules deviated in at least two aspects from the typical description of regenerative hepatocellular hyperplasia. (i) Hepatocytes within the nodules were morphologically abnormal, frequently exhibiting a high degree of pleomorphism and a range of degenerative changes. (ii) Many nodules were not discretely demarcated, and their contours were irregular and not spherical (27, 48).
Compared with rats, mice are resistant to nephrotoxicity, but one study showed a very subtle increase in apoptosis in the renal tubules of female but not male B6C3F1 mice (56).
Additional lesions in rat liver after FB1 exposure consist of nodular regeneration or cirrhosis, including bile duct and oval cell proliferation, Kupffer cell hyperplasia, foci of cellular alteration, cholangiomatous lesions, and fibrosis (57).
- SL
- sphingolipid
- BrdUrd
- bromodeoxyuridine
- CerS
- ceramide synthase
- DGE
- digital gene expression
- FB1
- fumonisin B1
- GO
- gene ontology
- TUNEL
- terminal deoxynucleotidyltransferase dUTP nick end labeling
- WT
- wild type
- X-gal
- 5-bromo-4-chloro-3-indolyl-β-d-galactopyranoside.
REFERENCES
- 1.Pewzner-Jung Y., Ben-Dor S., Futerman A. H. (2006) J. Biol. Chem. 281, 25001–25005 [DOI] [PubMed] [Google Scholar]
- 2.Pewzner-Jung Y., Park H., Laviad E. L., Silva L. C., Lahiri S., Stiban J., Erez-Roman R., Brugger B., Sachsenheimer T., Wieland F. T., Prieto M., Merrill A. H., Futerman A. H. (2010) J. Biol. Chem. 285, 10902–10910 [DOI] [PMC free article] [PubMed] [Google Scholar]
- 3.Yamashita T., Wada R., Sasaki T., Deng C., Bierfreund U., Sandhoff K., Proia R. L. (1999) Proc. Natl. Acad. Sci. U.S.A. 96, 9142–9147 [DOI] [PMC free article] [PubMed] [Google Scholar]
- 4.Hojjati M. R., Li Z., Jiang X. C. (2005) Biochim. Biophys. Acta 1737, 44–51 [DOI] [PubMed] [Google Scholar]
- 5.Wang X., Rao R. P., Kosakowska-Cholody T., Masood M. A., Southon E., Zhang H., Berthet C., Nagashim K., Veenstra T. K., Tessarollo L., Acharya U., Acharya J. K. (2009) J. Cell Biol. 184, 143–158 [DOI] [PMC free article] [PubMed] [Google Scholar]
- 6.Imgrund S., Hartmann D., Farwanah H., Eckhardt M., Sandhoff R., Degen J., Gieselmann V., Sandhoff K., Willecke K. (2009) J. Biol. Chem. 284, 33549–33560 [DOI] [PMC free article] [PubMed] [Google Scholar]
- 7.Sullards M. C., Merrill A. H., Jr. (2001) Sci. STKE 86, 2001, pl1. [DOI] [PubMed] [Google Scholar]
- 8.Merrill A. H., Jr., Sullards M. C., Allegood J. C., Kelly S., Wang E. (2005) Methods 36, 207–224 [DOI] [PubMed] [Google Scholar]
- 9.Laviad E. L., Albee L., Pankova-Kholmyansky I., Epstein S., Park H., Merrill A. H., Jr., Futerman A. H. (2008) J. Biol. Chem. 283, 5677–5684 [DOI] [PubMed] [Google Scholar]
- 10.Riebeling C., Allegood J. C., Wang E., Merrill A. H., Jr., Futerman A. H. (2003) J. Biol. Chem. 278, 43452–43459 [DOI] [PubMed] [Google Scholar]
- 11.Danial N. N., Gramm C. F., Scorrano L., Zhang C. Y., Krauss S., Ranger A. M., Datta S. R., Greenberg M. E., Licklider L. J., Lowell B. B., Gygi S. P., Korsmeyer S. J. (2003) Nature 424, 952–956 [DOI] [PubMed] [Google Scholar]
- 12.Flock G., Baggio L. L., Longuet C., Drucker D. J. (2007) Diabetes 56, 3006–3013 [DOI] [PubMed] [Google Scholar]
- 13.Audic S., Claverie J. M. (1997) Genome Res. 7, 986–995 [DOI] [PubMed] [Google Scholar]
- 14.Benjamini Y., Hochberg Y. (1995) J. R. Stat. Soc. Ser. B 57, 289–300 [Google Scholar]
- 15.Kanehisa M., Araki M., Goto S., Hattori M., Hirakawa M., Itoh M., Katayama T., Kawashima S., Okuda S., Tokimatsu T., Yamanishi Y. (2008) Nucleic Acids Res. 36, D480–D484 [DOI] [PMC free article] [PubMed] [Google Scholar]
- 16.Kanehisa M., Goto S. (2000) Nucleic Acids Res. 28, 27–30 [DOI] [PMC free article] [PubMed] [Google Scholar]
- 17.Kanehisa M., Goto S., Hattori M., Aoki-Kinoshita K. F., Itoh M., Kawashima S., Katayama T., Araki M., Hirakawa M. (2006) Nucleic Acids Res. 34, D354–D357 [DOI] [PMC free article] [PubMed] [Google Scholar]
- 18.Bauer S., Grossmann S., Vingron M., Robinson P. N. (2008) Bioinformatics 24, 1650–1651 [DOI] [PubMed] [Google Scholar]
- 19.Zhang B., Kirov S., Snoddy J. (2005) Nucleic Acids Res. 33, W741–W748 [DOI] [PMC free article] [PubMed] [Google Scholar]
- 20.Huang da W., Sherman B. T., Lempicki R. A. (2009) Nat. Protoc. 4, 44–57 [DOI] [PubMed] [Google Scholar]
- 21.Dennis G., Jr., Sherman B. T., Hosack D. A., Yang J., Gao W., Lane H. C., Lempicki R. A. (2003) Genome Biol. 4, P3. [PubMed] [Google Scholar]
- 22.Hulsen T., de Vlieg J., Alkema W. (2008) BMC Genomics 9, 488. [DOI] [PMC free article] [PubMed] [Google Scholar]
- 23.Flowers M. T., Keller M. P., Choi Y., Lan H., Kendziorski C., Ntambi J. M., Attie A. D. (2008) Physiol. Genomics 33, 361–372 [DOI] [PubMed] [Google Scholar]
- 24.Leuenberger N., Pradervand S., Wahli W. (2009) J. Clin. Invest. 119, 3138–3148 [DOI] [PMC free article] [PubMed] [Google Scholar]
- 25.Katzenellenbogen M., Pappo O., Barash H., Klopstock N., Mizrahi L., Olam D., Jacob-Hirsch J., Amariglio N., Rechavi G., Mitchell L. A., Kohen R., Domany E., Galun E., Goldenberg D. (2006) Cancer Res. 66, 4001–4010 [DOI] [PubMed] [Google Scholar]
- 26.Tennant B. (1999) in The Clinical Chemistry of Laboratory Animals, (Loeb W. F. ed), Taylor & Francis, Philadelphia [Google Scholar]
- 27.Deschl U., Cattley R. C., Harada T., Kuettler K., Hailey J. R., Hartig F., Leblanc B., Marsman D. S., Shirai T. (2001) in International Classification of Rodent Tumors: The Mouse (Mohr U. ed), Springer-Verlag, Berlin [Google Scholar]
- 28.Spassieva S. D., Mullen T. D., Townsend D. M., Obeid L. M. (2009) Biochem. J. 424, 273–283 [DOI] [PMC free article] [PubMed] [Google Scholar]
- 29.Xiong Y., Hannon G. J., Zhang H., Casso D., Kobayashi R., Beach D. (1993) Nature 366, 701–704 [DOI] [PubMed] [Google Scholar]
- 30.Albrecht J. H., Meyer A. H., Hu M. Y. (1997) Hepatology 25, 557–563 [DOI] [PubMed] [Google Scholar]
- 31.Holland W. L., Brozinick J. T., Wang L. P., Hawkins E. D., Sargent K. M., Liu Y., Narra K., Hoehn K. L., Knotts T. A., Siesky A., Nelson D. H., Karathanasis S. K., Fontenot G. K., Birnbaum M. J., Summers S. A. (2007) Cell Metab. 5, 167–179 [DOI] [PubMed] [Google Scholar]
- 32.Holland W. L., Knotts T. A., Chavez J. A., Wang L. P., Hoehn K. L., Summers S. A. (2007) Nutr. Rev. 65, S39–S46 [DOI] [PubMed] [Google Scholar]
- 33.Koybasi S., Senkal C. E., Sundararaj K., Spassieva S., Bielawski J., Osta W., Day T. A., Jiang J. C., Jazwinski S. M., Hannun Y. A., Obeid L. M., Ogretmen B. (2004) J. Biol. Chem. 279, 44311–44319 [DOI] [PubMed] [Google Scholar]
- 34.Saddoughi S. A., Song P., Ogretmen B. (2008) Subcell. Biochem. 49, 413–440 [DOI] [PMC free article] [PubMed] [Google Scholar]
- 35.Senkal C. E., Ponnusamy S., Rossi M. J., Bialewski J., Sinha D., Jiang J. C., Jazwinski S. M., Hannun Y. A., Ogretmen B. (2007) Mol. Cancer Ther. 6, 712–722 [DOI] [PubMed] [Google Scholar]
- 36.Min J., Mesika A., Sivaguru M., Van Veldhoven P. P., Alexander H., Futerman A. H., Alexander S. (2007) Mol. Cancer Res. 5, 801–812 [DOI] [PubMed] [Google Scholar]
- 37.Schiffmann S., Sandner J., Birod K., Wobst I., Angioni C., Ruckhäberle E., Kaufmann M., Ackermann H., Lötsch J., Schmidt H., Geisslinger G., Grösch S. (2009) Carcinogenesis 30, 745–752 [DOI] [PubMed] [Google Scholar]
- 38.Panjarian S., Kozhaya L., Arayssi S., Yehia M., Bielawski J., Bielawska A., Usta J., Hannun Y. A., Obeid L. M., Dbaibo G. S. (2008) Prostaglandins Other Lipid Mediat. 86, 41–48 [DOI] [PubMed] [Google Scholar]
- 39.Jin J., Hou Q., Mullen T. D., Zeidan Y. H., Bielawski J., Kraveka J. M., Bielawska A., Obeid L. M., Hannun Y. A., Hsu Y. T. (2008) J. Biol. Chem. 283, 26509–26517 [DOI] [PMC free article] [PubMed] [Google Scholar]
- 40.Walker T., Mitchell C., Park M. A., Yacoub A., Graf M., Rahmani M., Houghton P. J., Voelkel-Johnson C., Grant S., Dent P. (2009) Mol. Pharmacol. 76, 342–355 [DOI] [PMC free article] [PubMed] [Google Scholar]
- 41.Menuz V., Howell K. S., Gentina S., Epstein S., Riezman I., Fornallaz-Mulhauser M., Hengartner M. O., Gomez M., Riezman H., Martinou J. C. (2009) Science 324, 381–384 [DOI] [PubMed] [Google Scholar]
- 42.Deng X., Yin X., Allan R., Lu D. D., Maurer C. W., Haimovitz-Friedman A., Fuks Z., Shaham S., Kolesnick R. (2008) Science 322, 110–115 [DOI] [PMC free article] [PubMed] [Google Scholar]
- 43.Dickson R. C., Lester R. L. (2002) Biochim. Biophys. Acta 1583, 13–25 [DOI] [PubMed] [Google Scholar]
- 44.Narama I., Imaida K., Iwata H., Nakae D., Nisjikawa A., Harada T. (2003) J. Toxicol. Pathol. 16, 1–17 [Google Scholar]
- 45.Cotran R., Kumar V., Collins T. (1999) Robbins Pathologic Basis of Disease, 6th Ed., W. B. Saunders Co., Philadelphia [Google Scholar]
- 46.Hailey J. R., Walker N. J., Sells D. M., Brix A. E., Jokinen M. P., Nyska A. (2005) Toxicol. Pathol. 33, 165–174 [DOI] [PubMed] [Google Scholar]
- 47.Goodman D. G., Maronpot P. P., Newberne P. M., Popp J. A., Squire R. A. (1994) in Guides for Toxicologic Pathology, STP/ARP/AFIP, Washington, DC [Google Scholar]
- 48.Harada T., Enomoto A., Boorman G. A., Maronpot R. R. (1999) in Pathology of the Mouse (Maronpot R. R. ed), Cache River Press, Vienna, IL [Google Scholar]
- 49.Dragan Y. P., Bidlack W. R., Cohen S. M., Goldsworthy T. L., Hard G. C., Howard P. C., Riley R. T., Voss K. A. (2001) Toxicol. Sci. 61, 6–17 [DOI] [PubMed] [Google Scholar]
- 50.Harada T., Enomoto A., Boorman G. A., Maronport R. R. (1999) Liver and Gallbladder, Cache River Press, Vienna, IL [Google Scholar]
- 51.Bannasch P. (2003) Toxicol. Pathol. 31, 566–570 [DOI] [PubMed] [Google Scholar]
- 52.Amacher D. E., Schomaker S. J., Burkhardt J. E. (1998) Food Chem. Toxicol. 36, 831–839 [DOI] [PubMed] [Google Scholar]
- 53.Greaves P. (ed) (2000) Histopathology of Preclinical Toxicity Studies: Interpretation and Relevance in Drug Safety Evaluation, pp. 448–452, Elsevier, London [Google Scholar]
- 54.Merrill A. H., Jr., Liotta D. C., Riley R. T. (1996) Trends Cell Biol. 6, 218–223 [DOI] [PubMed] [Google Scholar]
- 55.Riley R. T., Voss K. A. (2006) Toxicol. Sci. 92, 335–345 [DOI] [PubMed] [Google Scholar]
- 56.Bondy G. S., Suzuki C. A., Fernie S. M., Armstrong C. L., Hierlihy S. L., Savard M. E., Barker M. G. (1997) Food Chem. Toxicol. 35, 981–989 [DOI] [PubMed] [Google Scholar]
- 57.Voss K. A., Riley R. T., Norred W. P., Bacon C. W., Meredith F. I., Howard P. C., Plattner R. D., Collins T. F., Hansen D. K., Porter J. K. (2001) Environ. Health Perspect. 109, Suppl. 2, 259–266 [DOI] [PMC free article] [PubMed] [Google Scholar]
- 58.Howard P. C. (2001) Toxicology and Carcinogenesis Studies of Fumonisin B1 (CAS116355-83-0) in F344 Rats and B6C3F1 Mice (Feed studies), National Institutes of Health, Bethesda [Google Scholar]
- 59.Thomas R. L., Jr., Matsko C. M., Lotze M. T., Amoscato A. A. (1999) J. Biol. Chem. 274, 30580–30588 [DOI] [PubMed] [Google Scholar]
- 60.Sonnino S., Prinetti A., Nakayama H., Yangida M., Ogawa H., Iwabuchi K. (2009) Glycoconj. J. 26, 615–621 [DOI] [PubMed] [Google Scholar]
- 61.Ciacci-Zanella J. R., Merrill A. H., Jr., Wang E., Jones C. (1998) Food Chem. Toxicol. 36, 791–804 [DOI] [PubMed] [Google Scholar]
- 62.Perkins N. D. (2002) Cell Cycle 1, 39–41 [PubMed] [Google Scholar]
Associated Data
This section collects any data citations, data availability statements, or supplementary materials included in this article.