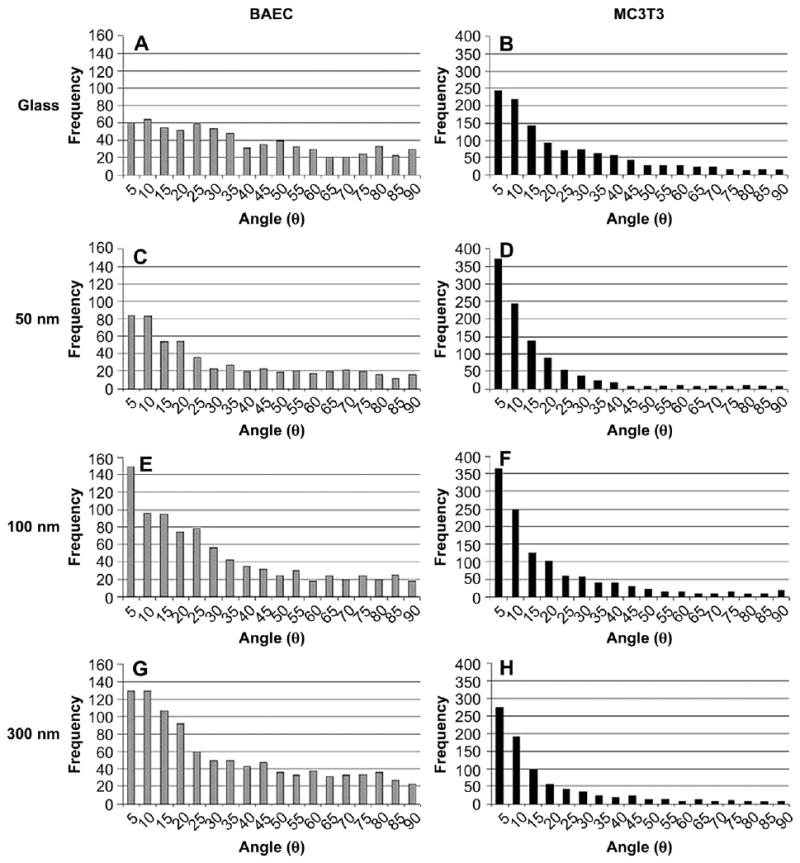
Fig. 7.

Effect of NP size on cytoskeletal F-actin alignment. Histograms represent cytoskeletal F-actin alignment (in degrees) with respect to long axis of cell. A, C, E, and G represent BAEC data; B, D, F, and H represent MC3T3 data. The substrates tested included glass, 50, 100 and 300 nm silica NP-modified glass surfaces.
