

Abstract
Although some studies report increased responsiveness of nucleus accumbens (NAc) AMPA receptors (AMPARs) after withdrawal from repeated cocaine treatment, others report decreased responsiveness after withdrawal plus cocaine challenge. Here we examine this apparent contradiction by quantifying cell surface and intracellular AMPAR subunits in the NAc before and after a challenge injection in behaviorally sensitized rats. Because MAPKs (mitogen-activated protein kinases) regulate AMPAR trafficking and are implicated in addiction, we also evaluated phosphorylation of extracellular signal-regulated kinase (ERK), c-Jun N-terminal kinase (JNK), and p38. Glutamate receptor 1 (GluR1) and GluR2 surface/intracellular (S/I) ratios were increased after 14 d of withdrawal in sensitized rats but were decreased 24 h after challenge with cocaine (which elicited a sensitized locomotor response) or saline (which elicited conditioned locomotion). These findings suggested redistribution of GluR1/2-containing receptors, a possibility supported by immunoprecipitation experiments indicating that most AMPARs in the NAc are GluR1/2 or GluR2/3, with few homomeric GluR1 or GluR1/3 receptors. In sensitized rats, ERK phosphorylation in the NAc increased during withdrawal and normalized after cocaine challenge. JNK phosphorylation also increased after withdrawal, but after cocaine challenge, it was inversely related to GluR1 and GluR2 S/I ratios. After saline challenge, p38 phosphorylation was increased. In summary, surface expression of GluR1/2-containing AMPARs increased in the NAc of sensitized rats, but AMPARs internalized after a single reexposure to cocaine or cocaine-related cues. ERK phosphorylation paralleled AMPAR surface expression. Although JNK results were complex, JNK and p38 may be involved in AMPAR internalization after cocaine or saline challenge, respectively.
Keywords: addiction, AMPA receptor, cocaine, nucleus accumbens, rat, sensitization, trafficking
Introduction
Recent studies indicate that AMPA receptor (AMPAR) transmission in the nucleus accumbens (NAc) is altered during behavioral sensitization to psychomotor stimulants. However, some results support a role for enhanced AMPAR transmission, whereas others support a role for AMPAR internalization associated with long-term depression (LTD). We hypothesize that the discrepant results can be explained based on whether or not a cocaine challenge is administered before assessing AMPAR function.
In studies supporting enhanced AMPAR transmission, animals were tested drug-free, days to weeks after discontinuing stimulant exposure. Pierce et al. (1996) showed an increased locomotor response to intra-NAc injection of AMPA 3 weeks after discontinuing cocaine injections. Suto et al. (2004) showed that both noncontingent amphetamine and cocaine self-administration produced significant enhancement of the priming effect of intra-NAc AMPA in tests of reinstatement of cocaine-seeking conducted 2–4 weeks after discontinuing drug exposure. Yao et al. (2004) found enhancement of late LTP in NAc slices from cocaine-treated mice recorded 2–3 d after the last injection. Paired-pulse facilitation was not altered, so enhanced LTP likely reflected postsynaptic alterations. Increased AMPAR insertion is a strong candidate (Malinow and Malenka, 2002). We used a protein cross-linking assay to directly demonstrate an increase in AMPAR surface expression in the NAc of rats assessed 3 weeks after discontinuing cocaine (Boudreau and Wolf, 2005).
However, there is evidence for decreased AMPAR function within 24 h of drug challenge. Thomas et al. (2001) treated mice for 5 d with saline or cocaine, discontinued injections for 10–14 d, challenged with cocaine, and recorded from NAc slices 24 h later. Chronic cocaine mice exhibited decreased AMPA/NMDA ratios at synapses in the NAc shell activated by cortical afferents. This was interpreted as LTD, because there was no change in the probability of transmitter release and the magnitude of LTD evoked in vitro was reduced in cocaine-treated mice. Brebner et al. (2005) implicated AMPA receptor internalization in the expression of behavioral sensitization to amphetamine. After treating rats with repeated amphetamine injections followed by 21–28 d of withdrawal, they showed that intra-NAc delivery of a peptide that interferes with AMPAR endocytosis, 60 min before amphetamine challenge, prevented the expression of behavioral sensitization.
To directly test our hypothesis, we used the protein cross-linking assay developed previously (Boudreau and Wolf, 2005) to compare AMPAR subunit surface expression in the NAc after withdrawal from repeated cocaine or after withdrawal plus cocaine or saline challenge. To help interpret these results, we conducted immunoprecipitation studies to characterize AMPAR subunit composition in the NAc. Finally, in tissue from the same rats used to monitor AMPAR trafficking, we examined the phosphorylation state of extracellular signal-regulated protein kinase (ERK), p38 mitogen-activated protein kinase (p38 MAPK), and c-Jun N-terminal kinase (JNK). Although best known as regulators of gene expression, MAPK have more recently been implicated in AMPAR trafficking (Zhu et al., 2002, 2005; Huang et al., 2004; Krapivinsky et al., 2004; Brown et al., 2005). MAPK also play critical roles in addiction-related plasticity (Lu et al., 2006; Girault et al., 2007).
Materials and Methods
Animals.
Male Sprague Dawley rats weighing 250–275 g (Harlan Laboratories, Indianapolis, IN) were housed in groups of three with food and water available ad libitum. A 12 h light/dark cycle was used with the lights on at 7:00 A.M. All saline or cocaine injections and behavioral testing were performed between 11:00 A.M. and 4:00 P.M. All procedures were approved by the Institutional Animal Care and Use Committee of Rosalind Franklin University of Medicine and Science.
Repeated cocaine or saline treatment and behavioral analysis.
Rats were assigned to saline and cocaine treatment groups after 10 d in the colony, including 7 d of handling. Twenty-four hours before the first cocaine or saline injection, animals were habituated to the behavioral testing procedure by placement in photocell cages (one animal/cage; San Diego Instruments, San Diego, CA) for 20 min. They received a mock injection (a syringe without the needle was touched to the abdomen) and then remained for 2 h in the photocell cages. On the first day of treatment (day 1), animals were habituated to photocell cages for 20 min before injection of cocaine (15 mg/kg, i.p.; provided by the National Institute on Drug Abuse) or saline (1 ml/kg, i.p.). Locomotor activity (total beam breaks) was measured for 2 h. For the next 5 d, animals received cocaine (30 mg/kg, i.p.) or saline (1 ml/kg, i.p.) in home cages. On the last day of treatment (day 7), animals returned to photocell cages for 20 min of habituation, cocaine (15 mg/kg, i.p.) or saline (1 ml/kg, i.p.) injections, and 2 h of locomotor activity measurement. Sensitization was assessed as described below. All rats were then returned to home cages for 14 d. On day 14, some saline- and cocaine-pretreated rats were taken from home cages and killed for cross-linking analysis without any drug challenge, generating the withdrawal-only groups. Other saline and cocaine rats were returned to activity cages on withdrawal day 14 and given a challenge injection of either saline (1 ml/kg, i.p.) or cocaine (15 mg/kg, i.p.) according to the protocol described for day 7. These rats were killed 24 h later, generating withdrawal-plus-challenge groups. The overall experimental design is depicted schematically in Figure 1A.
Figure 1.

Repeated cocaine injections produce behavioral sensitization and conditioned locomotion. A, Schematic depiction of experimental design. d1, Day 1. B, Locomotor activity data for cocaine-sensitized and -nonsensitized animals on the first day (Day 1) and last day (Day 7) of repeated cocaine injections; sum of five independent trials (see Materials and Methods for criteria for sensitization); n = 37 sensitized; n = 49 nonsensitized. Rats shown in B were further divided such that some underwent 14 d of withdrawal before biochemical analysis, whereas others received a challenge injection (cocaine or saline) on day 14 of withdrawal and were killed 24 h later. This generated a total of six repeated cocaine groups: SENS-WD, NON-WD, SENS-COC, SENS-SAL, NON-COC, and NON-SAL; n = 9–20 per group. C, Locomotor activity, on the first and last day of repeated saline injections, of SAL-WD or SAL-SAL rats before biochemical analysis; sum of five independent trials; n = 16–30 per group. D, Locomotor activity of sensitized and nonsensitized rats on the first day of cocaine treatment (Day 1, SENS; Day 1, NON) and after cocaine challenge on withdrawal day 14 (WD 14, SENS-COC; WD 14, NON-COC). E, Locomotor activity after saline challenge after 14 d of withdrawal in sensitized (WD 14, SENS-SAL), nonsensitized (WD 14, NON-SAL), and saline-treated rats (WD 14, SAL-SAL). All data are expressed as mean ± SEM total beam breaks. *p < 0.05; **p < 0.01; B, Day 1, sensitized versus Day 7, sensitized; D, Day 1, SENS versus WD 14, SENS-COC; E, WD 14, SAL-SAL versus WD 14, SENS-SAL and WD 14, NON-SAL.
Criteria for sensitization.
Criteria were based on the coefficient of variance (CV) of the day 7/day 1 beam break ratio in the saline group (CV = SD/mean). The CV provides a measure of variability within the saline group. A cocaine rat was considered sensitized if its increase in activity over the course of cocaine treatment (day 7/day 1 beam break ratio) exceeded the CV of the saline group (e.g., a cocaine rat with day 7/day 1 = 1.57 would have a 57% increase in activity and would just meet criteria for sensitization if the CV for the saline group was 0.56). Beam breaks during the first 30 min after injection were used to determine the day 7/day 1 beam break ratio.
Surface receptor cross-linking with bis(sulfosuccinimidyl)suberate.
Surface and intracellular glutamate receptor 1 (GluR1)–GluR3 levels were determined with a protein cross-linking assay (Boudreau and Wolf, 2005). After withdrawal only or withdrawal plus challenge, rats were decapitated, brains were removed rapidly, a 2 mm coronal section containing the NAc was obtained using a brain matrix, and the NAc (core and shell) was dissected on an ice-cold platform. Bilateral pieces of NAc tissue from each rat were then chopped into 400 μm slices using a McIllwain tissue chopper (Vibratome, St. Louis, MO). Slices were added to Eppendorf tubes containing ice-cold artificial CSF spiked with 2 mm bis(sulfosuccinimidyl)suberate (BS3; Pierce Biotechnology, Rockford, IL). Incubation with gentle agitation proceeded for 15 min at 4°C. Cross-linking was terminated by quenching the reaction with 100 mm glycine (10 min at 4°C). The slices were pelleted by brief centrifugation, and the supernatant was discarded. Pellets were resuspended in ice-cold lysis buffer containing protease and phosphatase inhibitors [25 mm HEPES, pH 7.4, 500 mm NaCl, 2 mm EDTA, 1 mm DTT, 1 mm phenylmethyl sulfonyl fluoride (PMSF), 20 mm NaF, 1 mm sodium orthovanadate, 10 mm sodium pyrophosphate, 1 μm microcystin-LF, 1 μm okadaic acid, 1× protease inhibitor mixture (EMD Biosciences, San Diego, CA), and 0.1% Nonidet P-40 (v/v)] and homogenized rapidly by sonicating for 5 s. A brief centrifugation was performed, and the supernatant fraction was used for further studies. Total protein concentration of the supernatant was determined by the Lowry method (Lowry et al., 1951). Samples were aliquoted (∼15 aliquots per rat) and stored at −80°C for future analysis.
Western blotting.
Samples (20–30 μg of total protein/lysate) were loaded and electrophoresed on 4–15% Tris-HCl (Bio-Rad, Hercules, CA) or 3–8% Tris acetate (Invitrogen, Carlsbad, CA) gradient gels under reducing conditions, and proteins were transferred onto polyvinylidene fluoride (PVDF) membranes for immunoblotting. Membranes were washed in double-distilled H2O (ddH2O) and blocked with either 1% goat serum/5% nonfat dry milk or 3% bovine serum albumin in TBS-Tween 20 (TBS-T), pH 7.4, for 1 h at room temperature. Membranes were then incubated overnight at 4°C with antibodies to AMPAR subunits (GluR1, immunogen sequence: SHSSGMPLGATGL, C terminus, 1:500; GluR2, immunogen sequence: AMLVALIEFCYKSRAE, C terminus, 1:2000; GluR3, immunogen sequence: GFTDIVLERVMHGGANITGFQIVNNENPMVQQFIQRWVRLDEREFPEAKNAPLKYTSALTHDAILVIAEAFRYLRRQRVDVSRRGSAGDCLANPAVPWSQGIDIERALKMVQVQGMTGNIQFDTYGRRTNYTIDVYEMKVSGSRKAGYWNEYERFVPFSDQQISNDSSSSENRTIVVTTILESPYVMYKKNHEQLEGNERYEGYCVD, N terminus, 1:500; all Millipore, Billerica, MA). Other membranes were incubated overnight with phospho-specific antibodies recognizing activated forms of ERK, p38 MAP kinase (p38), or JNK and then stripped (62.5 mm Tris-HCl, pH 6.7, 100 mm β-mercaptoethanol, and 2% SDS) before probing with phosphorylation-independent antibodies to ERK, p38, or JNK [pERK1/2, 1:10,000; total ERK1/2, 1:20,000 (Millipore); p-p38, 1:10,000; total p38, 1:10,000; p-JNK, 1:5000; total JNK, 1:5000 (Cell Signaling, Danvers, MA)]. Membranes were washed extensively with TBS-T solution, incubated for 60 min with HRP-conjugated anti-rabbit or anti-mouse IgG (1:10,000; Millipore), and washed extensively again in TBS-T. Membranes were then rinsed with ddH2O, immersed in chemiluminescence (ECL) detecting substrate (GE Healthcare, Piscataway, NJ) for 30 s to 5 min (depending on the antibody), and exposed to HyperFilm ECL film. The diffuse densities of surface (S) and intracellular (I) bands in each lane were determined using TotalLab (Nonlinear Dynamics, Newcastle, UK). Total protein in each lane was determined by staining membranes with Ponceau S (Sigma-Aldrich, St. Louis, MO). A potential concern is that cross-linking might interfere with immunodetection of the surface band, preventing accurate determination of the S/I ratio. We ruled this out by comparing identical amounts of cross-linked and non-cross-linked tissue probed with antibodies to GluR1, GluR2, or GluR3. For each subunit, the sum of the density of surface and intracellular bands in the cross-linked tissue was equal to the density of the single subunit band in the non-cross-linked tissue (data not shown). This demonstrates that all subunits in the tissue were detected after cross-linking.
Coimmunoprecipitation.
Two micrograms of GluR1 antibody, GluR2 antibody, or rabbit IgG (Millipore) were bound to 10 μg of protein A/G Plus-agarose beads (Pierce Biotechnology) by end-over-end mixing for 4 h at 4°C. After washing away the unbound antibody, 100 μl of NAc whole-cell lysate prepared in RIPA (radioimmunoprecipitation) assay buffer [50 mm Tris-HCl, pH 7.4, 1% NP-40, 0.25% Na-deoxycholate, 150 mm NaCl, 1 mm EDTA, 1 mm PMSF, 1× protease inhibitor mixture (EMD Biosciences), 1 mm Na3VO4, and 1 mm NaF] was added for an overnight incubation at 4°C. The samples were then centrifuged, the supernatant (unbound fraction) was removed, and the beads were washed three times in ice-cold TBS-Triton [150 mm NaCl, 50 mm Tris-HCl, pH 7.5, and 0.1% (v/v) Triton X-100]. The beads (bound fraction) were then resuspended in reducing sample treatment buffer (STB) and gently heated for 30 min at 37°C. A second round of immunoprecipitation was performed by adding the supernatant to a separate tube of antibody-conjugated protein A/G beads. Two rounds of immunoprecipitation resulted in a pull-down of >95% of the target proteins. After completion of the second round, supernatants were collected and mixed with reducing STB followed by heating for 30 min at 37°C. The A/G beads from the second round were washed three times in ice-cold TBS-Triton, resuspended in reducing STB, and gently heated for 30 min at 37°C. The two bound fractions were not used for determination of the extent of coimmunoprecipitation because confounding factors, such as incomplete recovery of proteins from the A/G resin, prevent quantitative analysis of these fractions (Wenthold et al., 1996). Instead, proteins in the unbound fractions were separated by 4–15% discontinuous SDS-PAGE and transblotted to PVDF membranes for immunoblotting.
Data analysis.
Two-way ANOVA with time as the repeated measure was used to compare locomotor activity counts on days 1 and 7 of behavioral trials. Individual time points were compared between days using a post hoc Tukey test. For Western blots, measurements of S, I, and S + I were normalized to total protein in the lane, determined with Ponceau S staining (above), to control for variation in loading. These values and S/I (which is independent of protein loading) were normalized to saline control values. Similarly, phospho-MAPK/total MAPK, phospho-MAPK/total lane protein, and total MAPK/total lane protein in cocaine rats were normalized to saline control values. Spearman rank order was used for correlational analysis of proteins of interest. For immunoprecipitation studies, we determined the amount of GluR1 or GluR2 in the unbound fraction after immunoprecipitation with anti-GluR1, anti-GluR2, or control IgG and expressed the results as a percentage of the IgG unbound fraction. For example, if the amount of GluR2 in the unbound fraction after immunoprecipitation with anti-GluR1 was ∼40% of the GluR2 in the unbound fraction after immunoprecipitation with control IgG, we concluded that ∼60% of GluR2 had been associated with GluR1. Differences between groups were determined using ANOVA followed by a post hoc Tukey test. Significance was set at p < 0.05.
Results
Assessment of behavioral sensitization
Experimental design is shown in Figure 1A. First, all rats in the study received seven daily injections of saline or cocaine. Behavioral results from injection day 1, injection day 7, and withdrawal day 14 are shown in Figure 1B–E. As expected from previous studies using this regimen (Pierce et al., 1996; Churchill et al., 1999; Boudreau and Wolf, 2005), approximately one-half of cocaine-treated rats developed behavioral sensitization (Fig. 1B), based on the ratio of locomotor activity counts on the last and first days of cocaine treatment (day 7/day 1; for more details, see Materials and Methods). Some of the saline-treated rats, cocaine-sensitized rats, and cocaine-nonsensitized rats were killed for biochemical analysis after 14 d of withdrawal (SAL-WD, SENS-WD, and NON-WD groups, respectively). Other rats were challenged with saline or cocaine on day 14 of withdrawal to generate five additional experimental groups (SAL-SAL, SENS-COC, SENS-SAL, NON-COC, and NON-SAL). Rats in the SAL-WD and SAL-SAL groups exhibited similar activity levels on day 1 and day 7, indicating no significant behavioral difference between these two control groups (Fig. 1C).
The behavioral response of repeated cocaine and saline groups to a challenge injection of cocaine on withdrawal day 14 is shown in Figure 1D. The same rats that were classified as sensitized on day 7 also expressed sensitization on withdrawal day 14. The behavioral response to a challenge injection of saline on withdrawal day 14 is shown in Figure 1E. Both SENS-SAL and NON-SAL rats exhibited significantly higher activity counts than SAL-SAL rats, indicating that all cocaine-treated rats associated the activity box and injection process with prior cocaine injections and therefore expressed conditioned locomotion. It is not surprising that this was observed for nonsensitized as well as sensitized rats, because all cocaine-treated rats, regardless of whether they ultimately sensitize or not, respond to each cocaine injection in the test environment with enhanced locomotor activity and therefore learn similar associations between cocaine and the test environment. There was no significant correlation between the magnitude of behavioral sensitization (day 7/day 1 or withdrawal day 14/day 1 ratios) and conditioned locomotion for individual rats (data not shown), consistent with our previous report (Hotsenpiller and Wolf, 2002).
GluR1 and GluR2 subunits redistribute to the cell surface during cocaine withdrawal but internalize after cocaine challenge
A protein cross-linking assay (Boudreau and Wolf, 2005) was used to compare the distribution of the AMPAR subunits GluR1–3 in saline- and cocaine-treated rats. Briefly, NAc tissue was removed and cross-linked with BS3, a membrane-impermeant protein cross-linking agent. BS3 selectively cross-links cell surface (S) proteins, forming high-molecular-weight aggregates. Intracellular (I) proteins are not modified and thus retain their normal molecular weight. This enables S and I pools of a particular protein to be distinguished by SDS-PAGE and Western blotting. A measure of total receptor subunit protein is obtained by summing S + I.
Results for GluR1 are shown in Figure 2. Rats treated repeatedly with cocaine or saline and killed after 14 d of withdrawal (without challenge) are shown on the left side of the x-axis break in Figure 2. SENS-WD rats had higher GluR1 S/I and S values than SAL-WD or NON-WD rats, indicating redistribution of GluR1 from intracellular to cell surface compartments in the NAc of sensitized rats (Fig. 2A,B). This is not surprising, because both shorter (7 d) and longer (21 d) periods of withdrawal from the same cocaine regimen were associated with a significant elevation in the GluR1 S/I ratio in the NAc of cocaine-sensitized rats (Boudreau and Wolf, 2005, 2006). It should be noted that the GluR1 S/I ratio was not elevated in cocaine-sensitized rats killed after 1 d of withdrawal, a time point when locomotor sensitization was evident (Boudreau and Wolf, 2005). Thus, AMPAR upregulation is not a requirement for locomotor sensitization (see Discussion).
Figure 2.
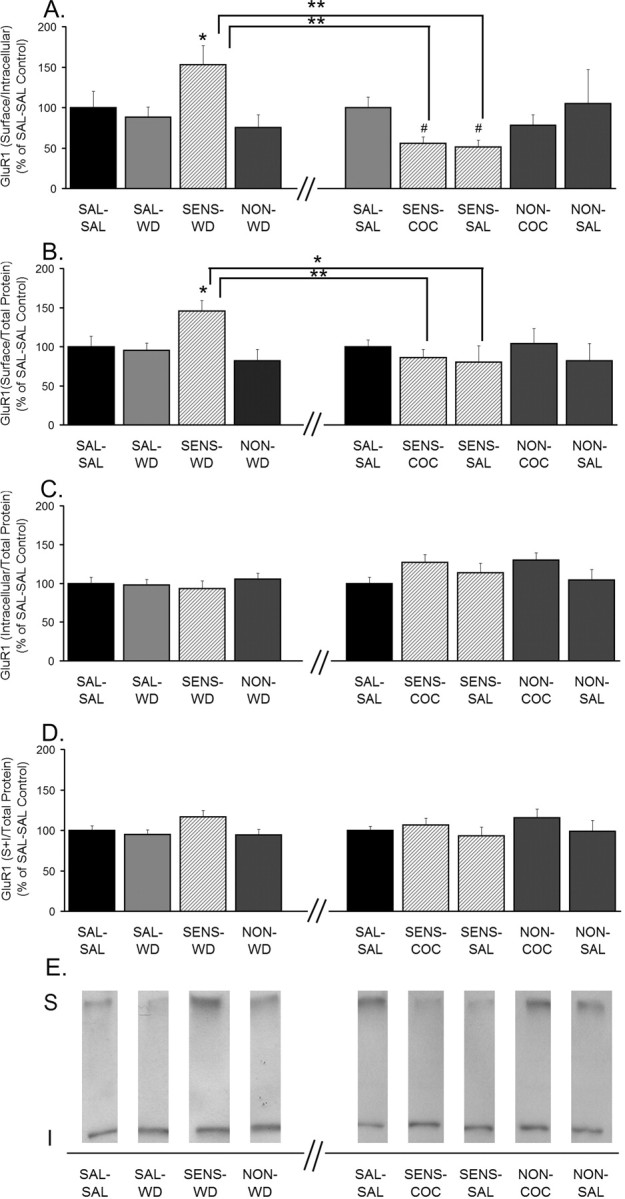
GluR1 S levels and S/I ratios are increased in sensitized rats after 14 d of withdrawal but decreased 24 h after a cocaine or saline challenge. A, GluR1 S/I ratio. B, GluR1 S levels normalized to total protein in the lane (S/total protein). C, GluR1 I levels normalized to total protein in the lane (I/total protein). D, GluR1 total protein levels normalized to total protein in the lane [(S + I)/total protein]. Data (mean ± SEM) are normalized to SAL-SAL controls and represent the sum of four independent experiments (2 withdrawal only and 2 withdrawal plus challenge). Data to the left of the x-axis break represent values from withdrawal-only groups. Data to the right of the x-axis break represent values from withdrawal-plus-challenge groups. SAL-SAL (n = 12–15; each group), SAL-WD (n = 14–16), SENS-WD (n = 14–16), NON-WD (n = 16–18), SENS-COC (n = 12), SENS-SAL (n = 7–9), NON-COC (n = 12–14), and NON-SAL (n = 11–13) are shown. Significant differences between withdrawal and withdrawal plus challenge are indicated by brackets: *p < 0.05; **p < 0.01. Comparisons among withdrawal groups or withdrawal-plus-challenge groups: *p < 0.05, significantly different from saline control groups (SAL-SAL and SAL-WD) and NON-WD group; #p < 0.05, significantly different from SAL-SAL group. E, Representative immunoblots.
GluR1 analysis from rats given a challenge injection on withdrawal day 14 and killed 24 h later is shown on the right side of the x-axis break in Figure 2. Sensitized rats received a saline or cocaine challenge (SENS-SAL and SENS-COC, respectively), nonsensitized rats received a saline or cocaine challenge (NON-SAL and NON-COC, respectively), and saline-treated rats received a saline challenge (SAL-SAL). Two SAL-SAL groups were run as part of the experiment depicted in Figure 2. One SAL-SAL group was run and analyzed with the withdrawal-only groups (left side of axis break), and one SAL-SAL group was run and analyzed with the challenge groups (right side of axis break). This enabled SAL-SAL rats to serve as an internal control. Accordingly, all withdrawal and challenge groups are normalized to their respective SAL-SAL control group.
SENS-COC rats had significantly decreased S/I and S values for GluR1 compared with SENS-WD rats (Fig. 2A,B). GluR1 S/I values in SENS-COC rats were also significantly decreased compared with SAL-SAL rats (Fig. 2A). This indicates that cocaine challenge not only reversed the increase in GluR1 surface expression that occurred during cocaine withdrawal, but brought the S/I ratio below control levels. In saline-treated rats, there were no differences between S, I, and S/I values between SAL-WD and SAL-SAL groups, indicating that saline challenge on withdrawal day 14 had no effect on GluR1 distribution. Interestingly, however, SENS-SAL rats had GluR1 S/I ratios significantly lower than both the SENS-WD and SAL-SAL groups. The SENS-SAL and SENS-WD groups were subjected to identical cocaine treatment and withdrawal, with the exception of the saline challenge on withdrawal day 14. Therefore, we conclude that the saline challenge was responsible for producing GluR1 internalization in the SENS-SAL group. We speculate that this is associated with expression of conditioned locomotion in this group. However, this raises the question of why saline challenge did not produce GluR1 internalization in the NON-SAL group (Fig. 2A), because these rats also exhibited conditioned locomotion (Fig. 1E). The SENS-SAL group differed from the NON-SAL group in that AMPAR surface expression increased during withdrawal in the former group only. Thus, on withdrawal day 14, before the saline challenge, the SENS-SAL group was starting from a higher level of AMPAR surface expression than the NON-SAL group. Perhaps the new surface-expressed receptors in sensitized rats have properties that make them more prone to internalize in response to saline challenge. Alternatively, there may be some internalization occurring in both groups, but because AMPAR surface expression starts from a higher level in the SENS-SAL group, the decrease in the S/I ratio in response to saline challenge is detectable with our assay, whereas the decrease is below the limit of detection for the NON-SAL group. Possible mechanisms by which saline challenge alters AMPAR distribution are addressed in Discussion.
Although S and S/I values increased significantly for SENS-WD rats, there were no significant changes in I or S + I, raising the question of where the additional surface receptors come from. Three additional analyses of these data indicated that small changes in I and S + I, although they did not reach statistical significance, together contributed to the observed increases in S and S/I values. First, there was a modest (∼20%) increase in S + I for GluR1 in sensitized rats. Although it did not reach statistical significance when all experimental groups were compared by ANOVA (Fig. 2D, left of axis break), S + I was significantly higher when sensitized rats and saline controls were compared with a t test (p < 0.05), consistent with a previous report using this same cocaine regimen (Churchill et al., 1999). Next, we used Spearman rank order to test whether the increase in GluR1 surface expression for individual cocaine-sensitized rats was paralleled by a decrease in GluR1 intracellular levels. This analysis revealed a trend toward an inverse relationship between S and I values for GluR1 (r = −0.320; p = 0.39), indicating that increased S and S/I values may be attributable, at least in part, to a shift of GluR1 from I to S compartments. Finally, we examined relationships between GluR1 parameters after separating S values for cocaine-sensitized rats into quartiles. In the upper quartile of rats, defined based on highest S values, I levels were decreased by 25%, whereas GluR1 total protein expression (S + I) was increased 35%. These results indicate that both a shift from intracellular compartments (decreased I) and an increase in GluR1 total protein (increased S + I) contributed to the observed increase in surface GluR1 levels in sensitized rats. We speculate that a similar explanation (small changes in I or S + I for individual rats both contributed, although neither reached statistical significance in between-group analyses) accounts for lack of significant changes in I or S + I in conjunction with decreased GluR1 surface expression after cocaine challenge.
Other aliquots of tissue from each rat were subjected to SDS-PAGE and Western blotting using antibodies to GluR2 or GluR3 subunits. For GluR2, we observed results similar to those obtained for GluR1. SENS-WD rats had higher GluR2 S/I and S values than SAL-WD rats, indicating redistribution of GluR2-containing AMPARs from intracellular to cell surface compartments (Fig. 3A,B). SENS-COC and SENS-SAL rats had significantly decreased GluR2 S/I and S values compared with SENS-WD rats (Fig. 3A,B), indicating that either challenge produced GluR2 internalization in sensitized rats. However, saline challenge did not alter GluR2 distribution in saline-treated rats, because SAL-SAL and SAL-WD groups did not differ. When samples from the same rats were immunoblotted for GluR3, we observed no differences between any of the groups for any GluR3 measure (S/I, S, I, or S + I) (Fig. 4).
Figure 3.
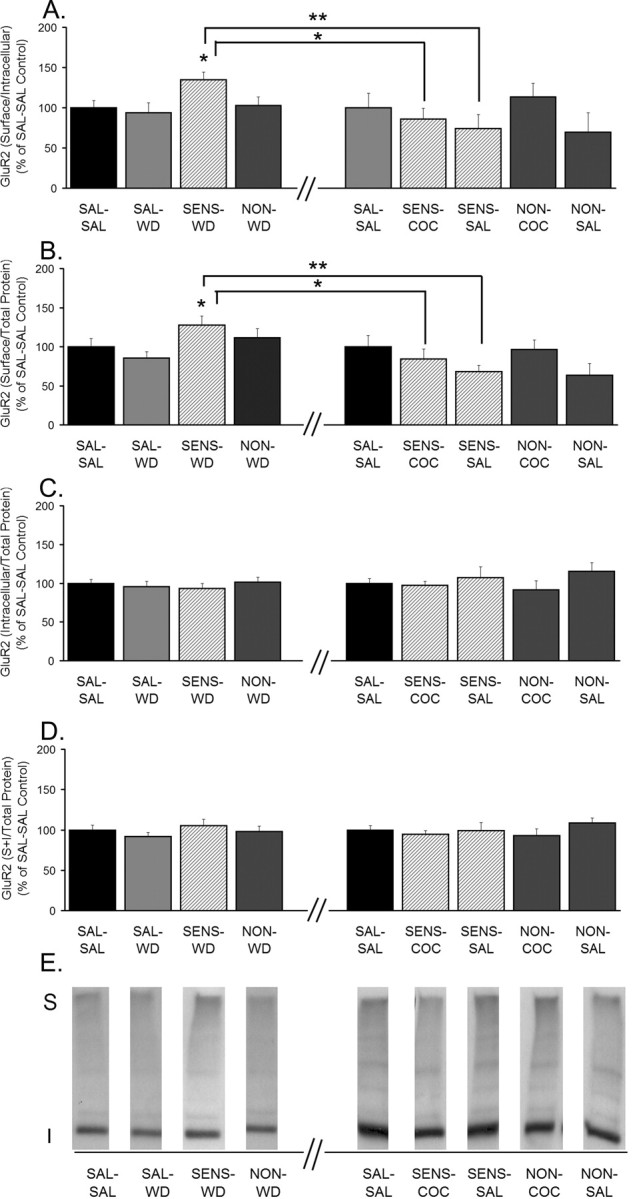
GluR2 S levels and S/I ratios are increased in sensitized rats after 14 d of withdrawal but decreased 24 h after a cocaine or saline challenge. A, GluR2 S/I ratio. B, GluR2 S levels normalized to total protein in the lane (S/total protein). C, GluR2 I levels normalized to total protein in the lane (I/total protein). D, GluR2 total protein levels normalized to total protein in the lane [(S + I)/total protein]. Data (mean ± SEM) are normalized to SAL-SAL controls and represent the sum of four independent experiments (2 withdrawal only and 2 withdrawal plus challenge). Data to the left of the x-axis break represent values from withdrawal-only groups. Data to the right of the x-axis break represent values from withdrawal-plus-challenge groups. SAL-SAL (n = 12–15; each group), SAL-WD (n = 14–16), SENS-WD (n = 14–16), NON-WD (n = 16–18), SENS-COC (n = 12), SENS-SAL (n = 7–9), NON-COC (n = 12–14), and NON-SAL (n = 11–13) are shown. Significant differences between withdrawal and withdrawal plus challenge are indicated by brackets: *p < 0.05; **p < 0.01. Comparisons among withdrawal groups: *p < 0.05, significantly different from saline control groups (SAL-SAL and SAL-WD). E, Representative immunoblots.
Figure 4.
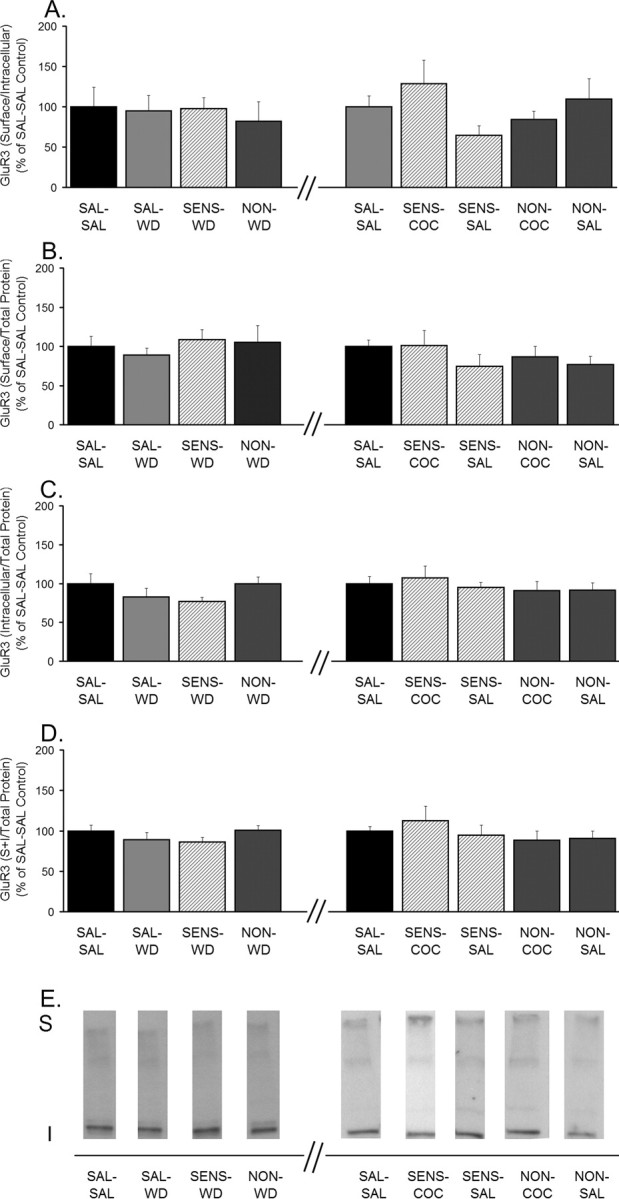
Distribution of GluR3 is unchanged after 14 d of withdrawal and after withdrawal plus challenge. A, GluR3 S/I ratio. B, GluR3 S levels normalized to total protein in the lane (S/total protein). C, GluR3 I levels normalized to total protein in the lane (I/total protein). D, GluR3 total protein levels normalized to total protein in the lane [(S + I)/total protein]. Data (mean ± SEM) are normalized to SAL-SAL controls and represent the sum of four independent experiments (2 withdrawal only and 2 withdrawal plus challenge). Data to the left of the x-axis break represent values from withdrawal-only groups. Data to the right of the x-axis break represent values from withdrawal-plus-challenge groups. SAL-SAL (n = 12–15; each group), SAL-WD (n = 14–16), SENS-WD (n = 14–16), NON-WD (n = 16–18), SENS-COC (n = 12), SENS-SAL (n = 7–9), NON-COC (n = 12–14), and NON-SAL (n = 11–13) are shown. ANOVA revealed no significant differences. E, Representative immunoblots.
As was the case for GluR1, redistribution of GluR2 in the experimental groups shown in Figure 3, A and B, occurred in the absence of significant changes in I or S + I values (Fig. 3C,D). It is likely that the explanation for this is similar to that presented above for GluR1, although in the case of GluR2 there was no trend toward an increase in S + I, either when analyzed by ANOVA or by t test comparing SAL-WD and SENS-WD rats (data not shown). Unfortunately, analysis of the relationship between S and I values for GluR2 is complicated by the presence of GluR2 in both GluR1/2- and GluR2/3-containing AMPARs (see below). Our results suggest that these populations respond differently in cocaine-sensitized rats: GluR1/2 receptors redistribute (Figs. 2, 3), whereas GluR3-containing receptors do not (Fig. 4).
ERK, JNK, and p38 activation state during withdrawal and after challenge injections
ERK, p38 MAPK, and JNK have been implicated in AMPAR trafficking during synaptic plasticity in the hippocampus. ERK activation may mediate synaptic insertion of AMPARs during LTP (Zhu et al., 2002), whereas JNK activation is implicated in AMPAR synaptic removal during depotentiation (Zhu et al., 2005). p38 activation is implicated in AMPAR removal during some forms of LTD (Zhu et al., 2002; Huang et al., 2004) (but see Brown et al., 2005), whereas decreased p38 activity is associated with AMPAR insertion during LTP (Krapivinsky et al., 2004).
To determine whether these MAPKs are involved in AMPAR redistribution after cocaine treatment, their phosphorylation state was determined in aliquots of NAc tissue from the same rats used to measure AMPAR distribution. As in previous figures, rats that were treated repeatedly with cocaine or saline and killed after 14 d of withdrawal are shown on the left side of the axis break, whereas rats challenged with saline or cocaine after 14 d of withdrawal and killed 24 h later are shown on the right side of the axis break (Figs. 5–7). SENS-WD rats exhibited significantly higher ERK2 phosphorylation (pERK2/total ERK2 and pERK2/total protein) than SAL-WD rats (Fig. 5A,B). This increase in ERK2 phosphorylation occurred in the absence of changes in total ERK2 protein (Fig. 5C). In SENS-COC or SENS-SAL rats, levels of ERK2 phosphorylation were not significantly different from SAL-SAL controls, indicating that a single cocaine or saline challenge reversed the increase in ERK2 phosphorylation that had developed during withdrawal (Fig. 5A,B). ERK2 phosphorylation did not correlate with AMPAR S/I ratios for individual rats in SENS-WD, SENS-COC, or SENS-SAL groups, although there was a positive correlation in saline controls (data not shown). Thus, although ERK2 phosphorylation parallels AMPAR S/I ratios in the NAc of sensitized rats, the relationship is likely indirect and different from the relationship that exists in control rats. No differences in ERK1 phosphorylation or total protein were observed between any experimental groups (data not shown). In the only other study to examine ERK phosphorylation in the NAc during withdrawal from repeated cocaine injections, ERK1 and ERK2 were quantified together and measured on day 7 of withdrawal (Mattson et al., 2005). No differences between saline and cocaine groups were apparent after withdrawal only, but cocaine rats showed greater ERK phosphorylation 20 min after cocaine challenge. This is difficult to compare with our study, in which ERK1 and ERK2 were quantified separately either after 14 d of withdrawal or 24 h after cocaine challenge.
Figure 5.

ERK2 phosphorylation is increased after 14 d of withdrawal but not 24 h after a cocaine or saline challenge. A, Phospho-ERK2 normalized to total ERK2 protein (pERK2/total ERK2). B, Phospho-ERK2 normalized to total protein in the lane (pERK2/total protein). C, Total ERK2 levels normalized to total protein in the lane (ERK2/total protein). Data (mean ± SEM) are normalized to SAL-SAL controls and represent the sum of four independent experiments (2 withdrawal only and 2 withdrawal plus challenge). Data to the left of the x-axis break represent values from withdrawal-only groups. Data to the right of the x-axis break represent values from withdrawal-plus-challenge groups. SAL-SAL (n = 12–15; each group), SAL-WD (n = 14–16), SENS-WD (n = 14–16), NON-WD (n = 16–18), SENS-COC (n = 12), SENS-SAL (n = 7–9), NON-COC (n = 12–14), and NON-SAL (n = 11–13) are shown. Significant differences between withdrawal and withdrawal plus challenge are indicated by brackets: *p < 0.05. Comparisons among withdrawal groups: *p < 0.05, significantly different from saline control groups (SAL-SAL and SAL-WD). D, Representative immunoblots.
Figure 6.

JNK p54 phosphorylation is increased in sensitized rats after 14 d of withdrawal, whereas total protein levels of JNK p54 are increased 24 h after a cocaine challenge. A, Phospho-p54 normalized to total p54 protein (p-p54/total p54). B, Phospho-p54 normalized to total protein in the lane (p-p54/total protein). C, Total p54 levels normalized to total protein in the lane (p54/total protein). Data (mean ± SEM) are normalized to SAL-SAL controls and represent the sum of four independent experiments (2 withdrawal only and 2 withdrawal plus challenge). Data to the left of the x-axis break represent values from withdrawal-only groups. Data to the right of the x-axis break represent values from withdrawal-plus-challenge groups. SAL-SAL (n = 12–15; each group), SAL-WD (n = 14–16), SENS-WD (n = 14–16), NON-WD (n = 16–18), SENS-COC (n = 12), SENS-SAL (n = 7–9), NON-COC (n = 12–14), and NON-SAL (n = 11–13) are shown. Significant differences between withdrawal and withdrawal plus challenge are indicated by brackets: *p < 0.05; **p < 0.01. Comparisons among withdrawal or withdrawal-plus-challenge groups: **p < 0.01, significantly different from saline control groups (SAL-SAL and SAL-WD) and NON-WD group; #p < 0.05, significantly different from SAL-SAL group. D, Representative immunoblots.
Figure 7.

JNK p46 phosphorylation is increased in sensitized rats after 14 d of withdrawal, whereas total protein levels of JNK p46 are increased 24 h after a cocaine challenge. A, Phospho-p46 normalized to total p46 protein (p-p46/total p46). B, Phospho-p46 normalized to total protein in the lane (p-p46/total protein). C, Total p46 levels normalized to total protein in the lane (total p46/total protein). Data (mean ± SEM) are normalized to SAL-SAL controls and represent the sum of four independent experiments (2 withdrawal only and 2 withdrawal plus challenge). Data to the left of the x-axis break represent values from withdrawal-only groups. Data to the right of the x-axis break represent values from withdrawal-plus-challenge groups. SAL-SAL (n = 12–15; each group), SAL-WD (n = 14–16), SENS-WD (n = 14–16), NON-WD (n = 16–18), SENS-COC (n = 12), SENS-SAL (n = 7–9), NON-COC (n = 12–14), and NON-SAL (n = 11–13) are shown. Significant differences between withdrawal and withdrawal plus challenge are indicated by brackets: **p < 0.01. Comparisons among withdrawal-only groups: *p < 0.05, significantly different from saline control groups (SAL-SAL and SAL-WD) and NON-WD group. Comparisons among withdrawal-plus-challenge groups: #p < 0.05, relative to SAL-SAL and SENS-SAL groups; ##p < 0.01, relative to SAL-SAL, SENS-SAL, NON-COC, and NON-SAL groups. D, Representative immunoblots.
JNK proteins, also known as stress-activated protein kinases (SAPKs), are the products of three genes, JNK1/SAPKγ, JNK2/SAPKα, and JNK3/SAPKβ. Transcripts from each gene undergo alternative splicing, resulting in proteins with molecular weights of ∼55 kDa (p54) and ∼46 kDa (p46) (Davis, 2000). In the caudate–putamen of the adult mouse, JNK3 protein is the most abundant (Lee et al., 1999). Results for p54 and p46 are shown in Figures 6 and 7, respectively. We observed significant increases in phosphorylation of both p54 and p46 (phospho-p54/total p54 and phospho-p46/total p46) in SENS-WD rats compared with SAL-WD rats (Figs. 6A, 7A). The increases in these ratios appeared to reflect small increases in the numerator (phospho-p54 and phospho-p46 levels) (Figs. 6B, 7B) and small decreases in the denominator (p54 and p46 protein levels) (Figs. 6C, 7C). In SENS-COC rats, a pronounced decrease in the ratios of phospho-p54/total p54 and phospho-p46/total p46 was observed compared with SENS-WD rats (Figs. 6A, 7A). This decrease in the ratio was attributable to a robust increase in total levels of p54 and p46 after cocaine challenge (Figs. 6C, 7C). Thus, when phospho-p54 and phospho-p46 were normalized to total protein in the lane (Figs. 6B, 7B), only a small change in phospho-p54 and no change in phospho-p46 were observed in the SENS-COC group. These data are difficult to interpret, because we do not know the relationship between regulation of JNK protein levels and JNK phosphorylation. As discussed below, analysis of JNK phosphorylation for individual rats in the SENS-COC group provided more interpretable information. Phospho-p54/total p54 was also decreased in SENS-SAL rats compared with the SENS-WD group, but the ratio did not decrease below control levels, and it was not associated with a significant change in total p54 protein (Fig. 6A–C).
Because S/I ratios for both GluR1 and GluR2 were significantly decreased by cocaine and saline challenge in cocaine-sensitized rats and JNK phosphorylation is implicated in AMPAR synaptic removal (Zhu et al., 2005), we used Spearman rank order to test for correlations between GluR1 and GluR2 S/I ratios and JNK measures for individual rats in the SENS-COC and SENS-SAL groups, as well as the SENS-WD group. This analysis revealed a significant inverse relationship between the GluR1 S/I ratios and p54 phosphorylation (Fig. 8A) and a trend toward a similar relationship between GluR2 S/I ratios and p54 phosphorylation (Fig. 8C) in the SENS-COC group. Tests comparing GluR1 and GluR2 S/I ratios to p46 parameters in this same group yielded similar results. GluR2 S/I ratios had a significant inverse relationship to p46 phosphorylation (Fig. 8D), whereas GluR1 S/I ratios tended toward the same relationship (Fig. 8B). These findings are not necessarily at odds with results shown in Figures 6 and 7, indicative of increased total JNK and no change in phospho-JNK/total protein after cocaine challenge, because these data do not rule out increased JNK phosphorylation in cellular compartments key for AMPAR redistribution. Additional tests were conducted to determine whether the same inverse relationship between AMPAR S/I ratios and JNK phosphorylation existed in the SENS-WD group, in which GluR1/2 surface expression was increased. We found no significant relationships between the magnitude of AMPAR S/I ratios and JNK phosphorylation (data not shown). Finally, no significant relationships between GluR1 or GluR2 S/I ratios and p54 or p46 parameters (phospho-p54 or phospho-p46/total p54 or p46; phospho-p54 or phospho-p46/total protein; total p54 or p46/total protein) were found in SENS-SAL rats (data not shown).
Figure 8.

GluR1 and GluR2 S/I ratios are inversely proportional to JNK p54 and p46 phosphorylation in cocaine-sensitized rats 24 h after a cocaine challenge. A, Relationship between phospho-p54 normalized to total protein in the lane (p-p54/total protein) and the GluR1 S/I ratio after cocaine challenge in sensitized rats. B, Relationship between phospho-p46 normalized to total protein in the lane (p-p46/total protein) and the GluR1 S/I ratio after cocaine challenge in sensitized rats. C, Relationship between p-p54/total protein and the GluR2 S/I ratio after cocaine challenge in sensitized rats. D, Relationship between p-p46/total protein and the GluR2 S/I ratio after cocaine challenge in sensitized rats. r is the Spearman rank-order correlation coefficient. We could not measure both parameters in some rats, because of technical problems with one of the blots, accounting for a lower sample number in some of these analyses than in behavioral analyses.
The final MAPK examined was p38. We observed no significant differences in the phosphorylation or total levels of p38 between SAL-WD, SENS-WD, and NON-WD rats (Fig. 9A–C). However, a significant increase in p38 phosphorylation (phospho-p38/total protein) was observed in SENS-SAL rats compared with SAL-SAL and SENS-WD rats. Interestingly, there was no significant increase in p38 phosphorylation in SENS-COC rats (Fig. 9B). Total protein levels of p38 were also increased in the SENS-SAL group compared with the SENS-WD group, although the SENS-SAL group did not differ significantly from SAL-SAL controls (Fig. 9C). Analysis of correlations with Spearman rank order revealed a near significant inverse relationship between p38 phosphorylation and GluR1 S/I ratios in the SENS-SAL group, indicating that the higher the p38 phosphorylation is, the lower the GluR1 surface expression is (r = −0.90; p = 0.08; data not shown). This result is of particular interest, because p38 is the only MAPK kinase examined that displayed a significant effect specific to cocaine-sensitized rats that received a saline challenge injection.
Figure 9.

p38 phosphorylation is increased only after saline challenge in cocaine-sensitized rats. A, Phospho-p38 normalized to total p38 protein (p-p38/total p38). B, Phospho-p38 normalized to total protein in the lane (p-p38/total protein). C, Total p38 levels normalized to total protein in the lane (p38/total protein). Data (mean ± SEM) are normalized to SAL-SAL controls and represent the sum of four independent experiments (2 withdrawal only and 2 withdrawal plus challenge). Data to the left of the x-axis break represent values from withdrawal-only groups. Data to the right of the x-axis break represent values from withdrawal-plus-challenge groups. SAL-SAL (n = 12–15; each group), SAL-WD (n = 14–16), SENS-WD (n = 14–16), NON-WD (n = 16–18), SENS-COC (n = 12), SENS-SAL (n = 7–9), NON-COC (n = 12–14), and NON-SAL (n = 11–13) are shown. Significant differences between withdrawal and withdrawal plus challenge are indicated by brackets: *p < 0.05; **p < 0.01. Significant differences among withdrawal-plus-challenge groups: #p < 0.05, relative to the SAL-SAL group. D, Representative immunoblots.
Correlations between S/I ratios for AMPAR subunits during withdrawal and after challenge injections
Results from cross-linking experiments indicated that GluR1 and GluR2 subunits both redistribute to the cell surface during cocaine withdrawal and redistribute to intracellular compartments after cocaine challenge. The simplest explanation for these results is that GluR1/2-containing AMPARs are responding to cocaine. This possibility is supported by positive correlations between S/I ratios for GluR1 and GluR2 in cocaine-treated rats subjected to withdrawal only (Fig. 10A) or withdrawal plus cocaine challenge (Fig. 10B). All cocaine-treated rats were included in these analyses, regardless of whether they sensitized. We also tested the correlation between S/I ratios for GluR1 and GluR2 after separating rats in Figure 10, A and B, into sensitized and nonsensitized cohorts. For rats subjected to withdrawal but no challenge (Fig. 10A), the significant positive correlation between GluR1 and GluR2 S/I ratios remained for NON-WD rats (Fig. 10C) but was no longer significant for SENS-WD rats (Fig. 10D). For rats subjected to withdrawal plus cocaine challenge, a positive correlation between GluR1 and GluR2 S/I ratios was obtained for both sensitized rats (r = 0.78; p < 0.01) and nonsensitized rats (r = 0.79; p < 0.01). There was also a significant positive correlation between GluR1 and GluR2 S/I ratios for saline-treated rats (SAL-WD and SAL-SAL groups were combined for this analysis; r = 0.45; p < 0.01).
Figure 10.

GluR1 and GluR2 S/I ratios are positively correlated in all cocaine rats subjected to withdrawal, but the relationship is lost when sensitized rats subjected to withdrawal are analyzed separately. A, GluR1 S/I ratios versus GluR2 S/I ratios in all COC-WD rats. B, GluR1 S/I ratio versus GluR2 S/I ratio in all COC-COC rats. C, GluR1 S/I ratios versus GluR2 S/I ratios in NON-WD rats. D, GluR1 S/I ratios versus GluR2 S/I ratios in SENS-WD rats. r is the Spearman rank-order correlation coefficient. For some rats, S/I ratio data were only obtained for one subunit (GluR1 or GluR2), accounting for a lower sample number in some of these analyses than in behavioral analyses.
One possible explanation for loss of the correlation between GluR1 and GluR2 S/I ratios in the SENS-WD group is related to selective changes in GluR1/2- versus GluR2/3-containing AMPARs in the NAc. Because GluR2 is contained in both GluR1/2- and GluR2/3-type AMPARs, the GluR2 S/I ratio is actually a mixed measure of the distribution of these two receptor populations. In rats that do not undergo AMPAR redistribution during withdrawal (SAL-WD or NON-WD), there is apparently a correlation between GluR1 and GluR2 regardless of the mixed GluR2 signal, perhaps because GluR1/2 and GluR2/3 receptors are similarly distributed between S and I pools. Selective redistribution of GluR1/2 receptors in sensitized rats would alter the relationship between GluR1 distribution and the portion of the GluR2 signal contributed by GluR2/3 receptors.
In our previous study, conducted after 21 d of withdrawal, we reported a significant correlation for cocaine-treated rats between S/I ratios obtained with GluR1 antibody and antibody recognizing both GluR2 and GluR3 subunits (Boudreau and Wolf, 2005). This is not necessarily at odds with the present study (which found no correlation between GluR1 and GluR2 S/I ratios in sensitized rats), because the correlation reported by Boudreau and Wolf (2005) could have reflected a relationship between GluR1 and GluR3. To examine this possibility, we compared S/I ratios between GluR1 and GluR3 in cocaine-sensitized, cocaine-nonsensitized, and saline-treated rats on withdrawal day 21 (tissue from Boudreau and Wolf, 2005) and on withdrawal day 14 (tissue from the present study). Spearman rank-order analysis of tissue from both withdrawal times revealed a significant positive relationship between GluR1 and GluR3 S/I ratios in cocaine-sensitized but not saline-treated or nonsensitized rats (Fig. 11A–F). These results suggest a sensitization-specific increase in association between GluR1 and GluR3 subunits that persists during late withdrawal.
Figure 11.

GluR1 and GluR3 S/I ratios are positively correlated in sensitized rats, but not nonsensitized or saline-treated rats, at both 14 and 21 d of withdrawal. A, GluR1 S/I ratios versus GluR3 S/I ratios in saline-treated rats after 14 d of withdrawal (SAL, 14d). B, GluR1 S/I ratios versus GluR3 S/I ratios in nonsensitized rats after 14 d of withdrawal (NON, 14d). C, GluR1 S/I ratios versus GluR3 S/I ratios in sensitized rats after 14 d of withdrawal (SENS, 14d). D, GluR1 S/I ratios versus GluR3 S/I ratios in saline-treated rats after 21 d of withdrawal (SAL, 21d). E, GluR1 S/I ratios versus GluR3 S/I ratios in nonsensitized rats after 21 d of withdrawal (NON, 21d). F, GluR1 S/I ratios versus GluR3 S/I ratios in sensitized rats after 21 d of withdrawal (SENS, 21d). r is the Spearman rank-order correlation coefficient. For some rats, S/I ratio data were only obtained for one subunit (GluR1 or GluR3), accounting for a lower sample number in some of these analyses than in behavioral analyses. Samples from withdrawal day 21 were from rats generated as part of a previous study (Boudreau and Wolf, 2005).
AMPAR subunit composition
As described above, cross-linking results led us to hypothesize that a major effect in the NAc of sensitized rats was increased surface expression of GluR1/2-containing receptors. Other results in sensitized rats (tendency toward increased total protein levels of GluR1 but not GluR2 or GluR3; loss of correlation between GluR1 and GluR2 S/I ratios; and increased association between GluR1 and GluR3) might suggest an increase in GluR2-lacking receptors in the NAc of sensitized rats. As a first step toward evaluating both of these hypotheses, we conducted immunoprecipitation studies to examine the subunit composition of AMPARs in the NAc of drug-naive rats. Tissue was solubilized and immunoprecipitated with GluR1 or GluR2 antibody. The unbound fraction that remained after immunoprecipitation was immunoblotted for GluR1–3. Table 1 shows that our immunoprecipitation protocol pulled down essentially all of the target protein. For example, after immunoprecipitation with GluR1 antibody, <5% of GluR1 was found in the unbound fraction. Immunoblotting for GluR2 and GluR3 revealed that ∼40% of the GluR2 immunoreactivity and ∼90% of the GluR3 immunoreactivity was found in the unbound fraction, indicating that a substantial portion of the GluR2 and very little of the GluR3 is in physical association with GluR1. After immunoprecipitation of GluR2, ∼5% of the GluR1 immunoreactivity and ∼5% of the GluR3 immunoreactivity was found in the unbound fraction, indicating that nearly all of both GluR1 and GluR3 are in association with GluR2 (Table 1). Together, these data suggest that most AMPARs in the NAc of naive rats are either GluR1/2 or GluR2/3, whereas <10% are homomeric GluR1 or GluR1/3.
Table 1.
Coimmunoprecipitation of AMPA receptor subunits in NAc tissue from naive adult rats
| IB | IP |
|
|---|---|---|
| GluR1 | GluR2 | |
| GluR1 | 2, 3, 3 | 5, 6, 6, 6 |
| GluR2 | 39, 42, 42, 43 | 0, 1, 2, 2 |
| GluR3 | 81, 85, 94, 101, 103 | 5, 6, 6 |
IB, Immunoblot; IP, immunoprecipitation. Values are percentage immunoreactivity in unbound fraction.
To specifically examine whether there was an increase in the abundance of GluR2-lacking AMPARs in the NAc of sensitized rats, we conducted a final study in which NAc tissue was immunoprecipitated with GluR2 antibody, leaving GluR2-lacking receptors in the unbound fraction. This was confirmed by showing that <2% of GluR2 immunoreactivity was detected when the unbound fraction was immunoblotted with GluR2 antibody (data not shown). By immunoblotting the unbound fraction with GluR1 antibody, we determined the percentage of total AMPARs that contained GluR1 but not GluR2 (that is, either homomeric GluR1 or GluR1/3) for three experimental groups: saline-treated, cocaine-sensitized rats, and nonsensitized rats. To obtain the tissue for this analysis, three to four representative rats from each group were selected, based on day 7 and day 1 activity counts, from larger experimental groups run specifically for these studies (repeated saline, n = 6; repeated cocaine, n = 9). Tissue from naive rats was processed in parallel. We found that GluR1-containing, GluR2-lacking AMPARs represented <10% of the total population in all groups, confirming results in Table 1. However, although our method is not adequate for establishing group differences in this range of values, it is interesting that there was a tendency toward increased abundance of these receptors in cocaine-sensitized rats (5, 11, and 14% for individual cocaine-sensitized rats) compared with saline-treated controls (3, 3, 4, and 5% for individual saline-treated rats) and nonsensitized rats (3, 4, and 6% for individual nonsensitized rats), supporting the idea that sensitization may be accompanied by a small increase in NAc levels of AMPARs that contain GluR1 but lack GluR2.
Discussion
Withdrawal and cocaine challenge have opposite effects on AMPAR trafficking
We have shown that AMPARs in NAc neurons redistribute to the cell surface during cocaine withdrawal in sensitized but not nonsensitized rats. Thus, AMPAR subunit S/I ratios were increased after withdrawal for 7 d (Boudreau and Wolf, 2006), 14 d (present results), and 21 d (Boudreau and Wolf, 2005), but not 1 d (Boudreau and Wolf, 2005). However, when sensitized rats were challenged with saline or cocaine, the AMPAR S/I ratio decreased, indicating a reduction in cell surface expression. These results confirm that discrepancies in the literature discussed in the Introduction are attributable to the effect of cocaine challenge. A preliminary study reached the same conclusion using electrophysiological approaches (Kourrich et al., 2006).
The increased AMPAR S/I ratio that occurs during withdrawal could reflect either increased AMPAR insertion into the membrane or a decrease in the rate of AMPAR removal. We favor the former explanation because the increased AMPAR S/I ratio is accompanied by ERK activation, which is associated with AMPAR insertion in the hippocampus (Zhu et al., 2002), and is also accompanied by activation of other signaling pathways implicated in AMPAR insertion (Boudreau and Wolf, unpublished results). The decreased AMPAR S/I ratio after cocaine challenge is likely to reflect AMPAR internalization, as discussed in detail below.
AMPAR subunit composition
In sensitized rats, both GluR1 and GluR2 S/I ratios increased during withdrawal. After cocaine challenge, both decreased significantly compared with withdrawal levels. The GluR1 S/I ratio was also significantly decreased compared with saline controls. Similar results were found after saline challenge. The GluR3 S/I ratio did not change significantly during withdrawal or challenge. These results suggest that GluR1/2-containing AMPARs redistribute in sensitized rats.
Supporting this, we conducted immunoprecipitation studies in NAc tissue from naive rats and found that most AMPARs were GluR1/2 or GluR2/3, whereas <10% were homomeric GluR1 or GluR1/3. These results are similar to those obtained in hippocampal tissue by Wenthold et al. (1996), although our results are not as quantitative for several methodological reasons. Nevertheless, they provide a useful estimate of the relative abundance of AMPAR populations in the NAc.
We also estimated the prevalence of GluR2-lacking receptors in sensitized, nonsensitized, and saline control rats after 14 d of withdrawal, based on observations suggesting that they may contribute to some cocaine effects (see Results). Although they represented <10% of the population in all groups, their prevalence may increase slightly in sensitized rats. Thus, although the major AMPAR adaptations during cocaine withdrawal and challenge reflect redistribution of GluR1/2-containing AMPARs, additional investigation of minor shifts in subunit composition is warranted. Interestingly, a very robust increase in GluR2-lacking receptors occurred in the NAc in association with “incubation” of cocaine craving during withdrawal from cocaine self-administration (Conrad et al., 2006).
Functional significance of AMPAR redistribution
Increased AMPAR surface expression in the NAc of sensitized rats is not responsible for locomotor sensitization, because rats expressed sensitization before the increase in AMPAR surface expression was observed (Boudreau and Wolf, 2005). Instead, we speculated that increased AMPAR surface expression is important for sensitization of incentive-motivational effects (Boudreau and Wolf, 2005). This would explain the observation that prior exposure to sensitizing regimens enhances the ability of intra-NAc AMPA to reinstate drug-seeking behavior (Suto et al., 2004). Under physiological conditions, drug seeking is not elicited by AMPA injection, but rather by stress, a priming injection of cocaine, or cocaine-conditioned cues. These stimuli trigger drug seeking in part by activating limbic and cortical glutamate projections that terminate in the NAc (Kalivas and McFarland, 2003). This may occur more effectively in cocaine-sensitized rats as a result of increased AMPAR surface expression on NAc neurons.
The functional significance of AMPAR internalization in response to cocaine challenge is less clear. Brebner et al. (2005) blocked the expression of amphetamine sensitization with intra-NAc injection of a peptide that prevents AMPAR internalization and concluded that LTD-like effects are necessary for the behavioral response. An alternative explanation is that after AMPARs have been activated, internalization and subsequent recycling to the surface is necessary for overcoming desensitization and enabling a prolonged response sufficient for motor activation. Either theory is consistent with the ability of intra-NAc injection of an AMPAR antagonist to block expression of cocaine sensitization (Pierce et al., 1996). It is difficult to compare Brebner et al. (2005) to the present results, because we find that withdrawal from repeated amphetamine, unlike cocaine, is not associated with increased AMPAR surface expression (Nelson et al., 2006). Consistent with this, Li and Kauer (2004) observed no change in LTP in NAc slices from rats treated with repeated amphetamine and withdrawn for 8–10 d. However, Li and Kauer (2004) used a robust LTP protocol, whereas a study showing enhanced LTP after repeated cocaine used a minimal tetanus protocol to probe for changes in NAc cell responsiveness (Yao et al., 2004).
Cellular mechanisms underlying AMPAR redistribution
We speculated previously about mechanisms that trigger increased AMPAR surface expression during cocaine withdrawal (Boudreau and Wolf, 2005). The strongest hypothesis is that decreased glutamate transmission onto NAc neurons during cocaine withdrawal (Goldstein and Volkow, 2002; Baker et al., 2003) combined with decreased intrinsic excitability of NAc neurons (Zhang et al., 1998, 2002; Hu et al., 2004) leads to a compensatory increase in postsynaptic AMPARs via synaptic scaling, a form of homeostatic plasticity (Turrigiano and Nelson, 2004).
We hypothesize that cocaine challenge produces AMPAR internalization by acutely increasing glutamate levels in the NAc. As in other cell types, glutamate produces rapid AMPAR internalization in cultured NAc neurons (Mangiavacchi and Wolf, 2004b). In vivo, challenge with 15 mg/kg cocaine increases glutamate levels in the NAc of sensitized rats, but not nonsensitized or control rats (Pierce et al., 1996; Reid and Berger, 1996; Bell et al., 2000), reflecting activation of glutamate inputs originating in prefrontal cortex (Park et al., 2002). A selective rise in glutamate in the NAc of sensitized rats would explain our observation that cocaine challenge produces AMPAR internalization only in sensitized rats. Cocaine challenge also increases extracellular dopamine (DA) levels, but this is unlikely to mediate AMPAR internalization, because DA agonists increase AMPAR surface expression in cultured NAc neurons (Mangiavacchi and Wolf, 2004a).
Saline challenge decreased the GluR1 S/I ratio in cocaine-sensitized rats to approximately the same extent as cocaine challenge. Saline challenge also elicited conditioned locomotion. We hypothesize that the two are related. Exposure to cocaine-related cues may activate glutamate transmission in the NAc, although the ability to study this is constrained by limitations of the microdialysis method (Hotsenpiller et al., 2001). Furthermore, AMPAR blockade attenuates conditioned locomotion (Cervo and Samanin, 1996; Mead et al., 1999; Hotsenpiller et al., 2001). Thus, exposure to cocaine-related cues and cocaine challenge may have in common the ability to increase extracellular glutamate levels in the NAc and thus trigger AMPAR internalization.
MAPK phosphorylation correlates with AMPAR redistribution
Our experiments, the first to examine MAPK involvement in AMPAR trafficking in striatal neurons, showed that sensitized rats withdrawn for 14 d exhibited increased ERK phosphorylation in parallel with increased AMPAR S/I ratios. ERK phosphorylation has been linked to AMPAR synaptic insertion during hippocampal LTP (Zhu et al., 2002). However, LTP is unlikely to be involved in AMPAR redistribution during cocaine withdrawal. Redistribution during withdrawal occurs gradually and may be triggered by decreased excitatory drive to NAc neurons (see above), whereas LTP occurs rapidly and is triggered by increased afferent activity. Thus, our results, while falling short of demonstrating a causal link between ERK activation and AMPAR trafficking during cocaine withdrawal, raise the possibility that ERK contributes to both rapid (LTP) and slowly induced (cocaine withdrawal) increases in AMPAR surface expression. After cocaine challenge, AMPAR internalization is accompanied by normalization of ERK phosphorylation. Thus, ERK activation parallels AMPAR surface expression during withdrawal and after challenge. It is well established that ERK phosphorylation in NAc neurons occurs after psychostimulant administration, is an important regulator of transcription, and is required for several behavioral adaptations resulting from repeated psychostimulant exposure (Lu et al., 2006; Girault et al., 2007). Our results extend this by suggesting a nongenomic contribution of ERK to addiction-related plasticity.
Less is known about p38 and JNK in addiction. p38 MAPK is not activated by acute cocaine (Valjent et al., 2000; Zhang et al., 2004), but is implicated in amphetamine-conditioned place preference (Gerdjikov et al., 2004) and mediation of glutamate and PKA signaling in the striatum (Vincent et al., 1998; Choe and McGinty, 2000, 2001). JNK has not been previously linked to psychostimulant actions (Valjent et al., 2000; Gerdjikov et al., 2004; Zhang et al., 2004). Like ERK, JNK phosphorylation increased in the SENS-WD group. In the SENS-COC group, JNK results were complex, but we were intrigued to discover a significant inverse relationship between GluR1 and GluR2 S/I ratios and the phosphorylation of JNK proteins, p54 and p46, indicating that the greater the phosphorylation of JNK proteins is, the lower the AMPAR surface expression is. In the SENS-SAL group, we found a significant increase in p38 phosphorylation as well as a near-significant inverse relationship between p38 phosphorylation and GluR1 S/I ratios. Thus, whereas JNK phosphorylation may be related to AMPAR internalization after cocaine challenge, p38 phosphorylation may be related to AMPAR internalization after saline challenge. This, combined with the ability of intra-NAc injection of a p38 inhibitor to prevent establishment of conditioned place preference for amphetamine (Gerdjikov et al., 2004), may suggest a role for p38 in psychostimulant-conditioned responses.
Conclusions
GluR1/2-containing AMPARs redistributed to the surface of NAc neurons during withdrawal from repeated cocaine and internalized after cocaine or saline challenge. ERK phosphorylation paralleled AMPAR surface expression. Results for JNK were complex, but some findings suggested that phosphorylation of JNK and p38 may be involved in AMPAR internalization after cocaine or saline challenge, respectively.
Note added in proof.
While this manuscript was under review, complementary electrophysiological findings, cited here in abstract form, were published (Kourrich et al., 2007).
Footnotes
This work was supported by United States Public Health Service Grants DA09621, DA015835, and DA00453 (M.E.W.). A.C.B. was supported by predoctoral National Research Service Award DA019762. We thank Dr. Robert Wenthold for helpful discussions and Drs. Chris Nelson and Carrie Ferrario for comments on this manuscript.
References
- Baker DA, McFarland K, Lake RW, Shen H, Tang XC, Toda S, Kalivas PW. Neuroadaptations in cystine-glutamate exchange underlie cocaine relapse. Nat Neurosci. 2003;6:743–749. doi: 10.1038/nn1069. [DOI] [PubMed] [Google Scholar]
- Bell K, Duffy P, Kalivas PW. Context-specific enhancement of glutamate transmission by cocaine. Neuropsychopharmacology. 2000;23:335–344. doi: 10.1016/S0893-133X(00)00100-7. [DOI] [PubMed] [Google Scholar]
- Boudreau AC, Wolf ME. Behavioral sensitization to cocaine is associated with increased AMPA receptor surface expression in the nucleus accumbens. J Neurosci. 2005;25:9144–9151. doi: 10.1523/JNEUROSCI.2252-05.2005. [DOI] [PMC free article] [PubMed] [Google Scholar]
- Boudreau AC, Wolf ME. Dysregulation of signal transduction accompanies AMPA receptor trafficking in the nucleus accumbens during behavioral sensitization to cocaine. Soc Neurosci Abstr. 2006;32:394–7. [Google Scholar]
- Brebner K, Wong TP, Liu L, Liu Y, Campsall P, Gray S, Phelps L, Phillips AG, Wang YT. Nucleus accumbens long-term depression and the expression of behavioral sensitization. Science. 2005;310:1340–1343. doi: 10.1126/science.1116894. [DOI] [PubMed] [Google Scholar]
- Brown TC, Tran IC, Backos DS, Esteban JA. NMDA receptor-dependent activation of the small GTPase Rab5 drives the removal of synaptic AMPA receptors during hippocampal LTD. Neuron. 2005;45:81–94. doi: 10.1016/j.neuron.2004.12.023. [DOI] [PubMed] [Google Scholar]
- Cervo L, Samanin R. Effects of dopaminergic and glutamatergic receptor antagonists on the establishment and expression of conditioned locomotion to cocaine in rats. Brain Res. 1996;731:31–38. doi: 10.1016/0006-8993(96)00455-6. [DOI] [PubMed] [Google Scholar]
- Choe ES, McGinty JF. N-methyl-d-aspartate receptors and p38 mitogen-activated protein kinase are required for cAMP-dependent cyclase response element binding protein and Elk-1 phosphorylation in the striatum. Neurosci. 2000;101:607–617. doi: 10.1016/s0306-4522(00)00379-1. [DOI] [PubMed] [Google Scholar]
- Choe ES, McGinty FJ. Cyclic AMP and mitogen-activated protein kinases are required for glutamate-dependent cyclic AMP response element binding protein and Elk-1 phosphorylation in the dorsal striatum in vivo. J Neurochem. 2001;76:401–412. doi: 10.1046/j.1471-4159.2001.00051.x. [DOI] [PubMed] [Google Scholar]
- Churchill L, Swanson CJ, Urbina M, Kalivas PW. Repeated cocaine alters glutamate receptor subunit levels in the nucleus accumbens and ventral tegmental area of rats that develop behavioral sensitization. J Neurochem. 1999;72:2397–2403. doi: 10.1046/j.1471-4159.1999.0722397.x. [DOI] [PubMed] [Google Scholar]
- Conrad K, Marinelli M, Wolf ME. AMPA and dopamine receptor trafficking in the nucleus accumbens in rats that display a time-dependent increase in cocaine-seeking behavior. Soc Neurosci Abstr. 2006;32:394–8. [Google Scholar]
- Davis RJ. Signal transduction by the JNK group of MAP kinases. Cell. 2000;103:239–252. doi: 10.1016/s0092-8674(00)00116-1. [DOI] [PubMed] [Google Scholar]
- Gerdjikov TV, Ross GM, Beninger RJ. Place preference induced by nucleus accumbens amphetamine is impaired by antagonists of ERK or p38 MAP kinases in rats. Behav Neurosci. 2004;118:740–750. doi: 10.1037/0735-7044.118.4.740. [DOI] [PubMed] [Google Scholar]
- Girault JA, Valjent E, Caboche J, Herve D. ERK2: a logical AND gate critical for drug-induced plasticity. Curr Opin Pharmacol. 2007;7:77–85. doi: 10.1016/j.coph.2006.08.012. [DOI] [PubMed] [Google Scholar]
- Goldstein RZ, Volkow ND. Drug addiction and its underlying neurobiological basis: neuroimaging evidence for the involvement of the frontal cortex. Am J Psychiatry. 2002;159:1642–1652. doi: 10.1176/appi.ajp.159.10.1642. [DOI] [PMC free article] [PubMed] [Google Scholar]
- Hotsenpiller G, Wolf ME. Conditioned locomotion is not correlated with behavioral sensitization to cocaine: an intra-laboratory multi-sample analysis. Neuropsychopharmacology. 2002;27:924–929. doi: 10.1016/S0893-133X(02)00370-6. [DOI] [PubMed] [Google Scholar]
- Hotsenpiller G, Giorgetti M, Wolf ME. Alterations in behavior and glutamate transmission following presentation of stimuli previously associated with cocaine exposure. Eur J Neurosci. 2001;14:1843–1855. doi: 10.1046/j.0953-816x.2001.01804.x. [DOI] [PubMed] [Google Scholar]
- Hu XT, Basu S, White FJ. Repeated cocaine administration suppresses HVA-Ca2+ potentials and enhances activity of K+ channels in rat nucleus accumbens neurons. J Neurophysiol. 2004;92:1597–1607. doi: 10.1152/jn.00217.2004. [DOI] [PubMed] [Google Scholar]
- Huang CC, You JL, Wu MY, Hsu KS. Rap1-induced p38 mitogen-activated protein kinase activation facilitates AMPA receptor trafficking via the GDI.Rab5 complex. Potential role in (S)-3,5-dihydroxyphenylglycene-induced long-term depression. J Biol Chem. 2004;279:12286–12292. doi: 10.1074/jbc.M312868200. [DOI] [PubMed] [Google Scholar]
- Kalivas PW, McFarland K. Brain circuitry and the reinstatement of cocaine seeking behavior. Psychopharmacology (Berl) 2003;168:44–56. doi: 10.1007/s00213-003-1393-2. [DOI] [PubMed] [Google Scholar]
- Krapivinsky G, Medina I, Krapivinsky L, Gapon S, Clapham DE. SynGAP-MUPP1-CaMKII synaptic complexes regulate p38 MAP kinase activity and NMDA receptor-dependent synaptic AMPA receptor potentiation. Neuron. 2004;43:563–574. doi: 10.1016/j.neuron.2004.08.003. [DOI] [PubMed] [Google Scholar]
- Kourrich S, Klug JR, Rothwell M, Thomas MJ. Bidirectional synaptic plasticity in the nucleus accumbens: control by in vivo cocaine. Soc Neurosci Abstr. 2006;32:394–3. doi: 10.1523/JNEUROSCI.1859-07.2007. [DOI] [PMC free article] [PubMed] [Google Scholar]
- Kourrich S, Rothwell PE, Klug JR, Thomas MJ. Cocaine experience controls bidirectional synaptic plasticity in the nucleus accumbens. J Neurosci. 2007;27:7921–7928. doi: 10.1523/JNEUROSCI.1859-07.2007. [DOI] [PMC free article] [PubMed] [Google Scholar]
- Lee J-K, Park J, Lee Y-D, Lee SH, Han P-Y. Distinct localization of SAPK isoforms in neurons of adult mouse brain implies multiple signaling modes of SAPK pathway. Mol Brain Res. 1999;70:116–124. doi: 10.1016/s0169-328x(99)00136-9. [DOI] [PubMed] [Google Scholar]
- Li Y, Kauer JA. Repeated exposure to amphetamine disrupts dopaminergic modulation of excitatory synaptic plasticity and neurotransmission in nucleus accumbens. Synapse. 2004;51:1–10. doi: 10.1002/syn.10270. [DOI] [PubMed] [Google Scholar]
- Lowry OH, Rosebrough NJ, Farr AL, Randall RJ. Protein measurement with the folin phenol reagent. J Biol Chem. 1951;193:265–275. [PubMed] [Google Scholar]
- Lu L, Koya E, Zhai H, Hope BT, Shaham Y. Role of ERK in cocaine addiction. Trends Neurosci. 2006;29:695–703. doi: 10.1016/j.tins.2006.10.005. [DOI] [PubMed] [Google Scholar]
- Malinow R, Malenka RC. AMPA receptor trafficking and synaptic plasticity. Annu Rev Neurosci. 2002;25:103–126. doi: 10.1146/annurev.neuro.25.112701.142758. [DOI] [PubMed] [Google Scholar]
- Mangiavacchi S, Wolf ME. D1 dopamine receptor stimulation increases the rate of AMPA receptor insertion onto the surface of cultured nucleus accumbens neurons through a pathway dependent on protein kinase A. J Neurochem. 2004a;88:1261–1271. doi: 10.1046/j.1471-4159.2003.02248.x. [DOI] [PubMed] [Google Scholar]
- Mangiavacchi S, Wolf ME. Stimulation of N-methyl-d-aspartate receptors, AMPA receptors or metabotropic glutamate receptors leads to rapid internalization of AMPA receptors in cultured nucleus accumbens neurons. Eur J Neurosci. 2004b;20:649–657. doi: 10.1111/j.1460-9568.2004.03511.x. [DOI] [PubMed] [Google Scholar]
- Mattson BJ, Bossert JM, Simmons DE, Nozaki N, Nagarkar D, Kreuter JD, Hope BT. Cocaine-induced CREB phosphorylation in nucleus accumbens of cocaine-sensitized rats is enabled by sustained activation of extracellular signal-regulated kinase, but not protein kinase A. J Neurochem. 2005;95:1481–1494. doi: 10.1111/j.1471-4159.2005.03500.x. [DOI] [PubMed] [Google Scholar]
- Mead AN, Vasilaki A, Spyraki C, Duka T, Stephens DN. AMPA-receptor involvement in c-fos expression in the medial prefrontal cortex and amygdala dissociates neural substrates of conditioned activity and conditioned reward. Eur J Neurosci. 1999;11:4089–4098. doi: 10.1046/j.1460-9568.1999.00828.x. [DOI] [PubMed] [Google Scholar]
- Nelson CL, Milovanovic M, Wolf ME. Characterization of glutamate receptor trafficking and signal transduction in the nucleus accumbens following repeated amphetamine administration. Soc Neurosci Abstr. 2006;32:394–6. [Google Scholar]
- Park W-K, Bari AA, Jey AR, Anderson SM, Spealman RD, Rowlett JK, Pierce RC. Cocaine administered into the medial prefrontal cortex reinstates cocaine-seeking behavior by increasing AMPA receptor-mediated glutamate transmission in the nucleus accumbens. J Neurosci. 2002;22:2916–2925. doi: 10.1523/JNEUROSCI.22-07-02916.2002. [DOI] [PMC free article] [PubMed] [Google Scholar]
- Pierce RC, Bell K, Duffy P, Kalivas PW. Repeated cocaine augments excitatory amino acid transmission in the nucleus accumbens only in rats having developed behavioral sensitization. J Neurosci. 1996;16:1550–1560. doi: 10.1523/JNEUROSCI.16-04-01550.1996. [DOI] [PMC free article] [PubMed] [Google Scholar]
- Reid MS, Berger SP. Evidence for sensitization of cocaine-induced nucleus accumbens glutamate release. NeuroReport. 1996;7:1325–1329. doi: 10.1097/00001756-199605170-00022. [DOI] [PubMed] [Google Scholar]
- Suto N, Tanabe LM, Austin JD, Creekmore E, Pham CT, Vezina P. Previous exposure to psychostimulants enhances the reinstatement of cocaine seeking by nucleus accumbens AMPA. Neuropsychopharmacology. 2004;29:2149–2159. doi: 10.1038/sj.npp.1300533. [DOI] [PubMed] [Google Scholar]
- Thomas MJ, Beurrier C, Bonci A, Malenka RC. Long-term depression in the nucleus accumbens: a neural correlate of behavioral sensitization to cocaine. Nat Neurosci. 2001;4:1217–1223. doi: 10.1038/nn757. [DOI] [PubMed] [Google Scholar]
- Turrigiano GG, Nelson SB. Homeostatic plasticity in the developing nervous system. Nat Rev Neurosci. 2004;5:97–107. doi: 10.1038/nrn1327. [DOI] [PubMed] [Google Scholar]
- Valjent E, Corvol J-C, Pagès C, Besson M-J, Maldonado R, Caboche J. Involvement of the extracellular signal-regulated kinase cascade for cocaine-rewarding properties. J Neurosci. 2000;20:8701–8709. doi: 10.1523/JNEUROSCI.20-23-08701.2000. [DOI] [PMC free article] [PubMed] [Google Scholar]
- Vincent SR, Sebben M, Dumuis A, Bockaert J. Neurotransmitter regulation of MAP kinase signaling in striatal neurons in primary culture. Synapse. 1998;29:29–36. doi: 10.1002/(SICI)1098-2396(199805)29:1<29::AID-SYN3>3.0.CO;2-D. [DOI] [PubMed] [Google Scholar]
- Wenthold RJ, Petralia RS, Blahos J, Niedzielski AS. Evidence for multiple AMPA receptor complexes in hippocampal CA1/CA2 neurons. J Neurosci. 1996;16:1982–1989. doi: 10.1523/JNEUROSCI.16-06-01982.1996. [DOI] [PMC free article] [PubMed] [Google Scholar]
- Yao WD, Gainetdinov RR, Arbuckle MI, Sotnikova TD, Cyr M, Beaulieu JM, Torres GE, Grant SGN, Caron MG. Identification of PSD-95 as a regulator of dopamine-mediated synaptic and behavioral plasticity. Neuron. 2004;41:625–638. doi: 10.1016/s0896-6273(04)00048-0. [DOI] [PubMed] [Google Scholar]
- Zhang L, Lou D, Jiao H, Zhang D, Wang X, Xia Y, Zhang J, Xu M. Cocaine induced intracellular signaling and gene expression are oppositely regulated by the dopamine D1 and D3 receptors. J Neurosci. 2004;24:3344–3354. doi: 10.1523/JNEUROSCI.0060-04.2004. [DOI] [PMC free article] [PubMed] [Google Scholar]
- Zhang X-F, Hu X-T, White FJ. Whole-cell plasticity in cocaine withdrawal: reduced sodium currents in nucleus accumbens neurons. J Neurosci. 1998;18:488–498. doi: 10.1523/JNEUROSCI.18-01-00488.1998. [DOI] [PMC free article] [PubMed] [Google Scholar]
- Zhang XF, Cooper DC, White FJ. Repeated cocaine treatment decreases whole-cell calcium current in rat nucleus accumbens neurons. J Pharmacol Exp Ther. 2002;301:1119–1125. doi: 10.1124/jpet.301.3.1119. [DOI] [PubMed] [Google Scholar]
- Zhu JJ, Qin Y, Zhao M, van Aiest L, Malinow R. Ras and Rap control AMPA receptor trafficking during synaptic plasticity. Cell. 2002;110:443–455. doi: 10.1016/s0092-8674(02)00897-8. [DOI] [PubMed] [Google Scholar]
- Zhu Y, Pak D, Qin Y, McCormack SG, Kim MJ, Baumgart JP, Velamoor V, Auberson YP, Osten P, van Aeslst L, Sheng M, Zhu JJ. Rap2-JNK removes synaptic AMPA receptors during depotentiation. Neuron. 2005;46:905–916. doi: 10.1016/j.neuron.2005.04.037. [DOI] [PubMed] [Google Scholar]