Abstract
-weighted functional MR images suffer from signal loss artifacts caused by the magnetic susceptibility differences between air cavities and brain tissues. We propose a novel spectral-spatial pulse design that is slice-selective and capable of mitigating the signal loss. The two-dimensional spectral-spatial pulses create precompensatory phase variations that counteract through-plane dephasing, relying on the assumption that resonance frequency offset and through-plane field gradient are spatially correlated. The pulses can be precomputed prior to functional MRI experiments and used repeatedly for different slices in different subjects. Experiments with human subjects showed that the pulses were effective in slice selection and loss mitigation at different brain regions.
2 Introduction
Blood-oxygenation-level-dependent (BOLD), -weighted functional MR images suffer from artifacts originating from the magnetic susceptibility differences between brain tissue and air cavities, such as the frontal sinuses and middle ears. The susceptibility differences cause inhomogeneity of the magnetic field within the human head. One manifestation of field inhomogeneity in images is signal loss at brain regions proximal to the air cavities, including the orbital frontal and inferior temporal lobes. It hampers functional studies of many brain regions of interest in psychiatry and cognitive neuroscience.
The major cause of signal loss is axial-direction dephasing of magnetic spins through imaging planes positioned above air cavities. During the long echo time (TE) needed for contrast to accumulate, an inhomogeneous field causes through-plane spins to dephase with respect to each other. MR signals from those spins cancel at data readout, causing attenuation in voxel intensities. In the literature, several categories of techniques have been proposed to counteract through-plane dephasing. They include (1) optimization of slice selection [1–3] and data acquisition [4–7] methods; (2) phase compensation using extra z-gradient lobes [8–11]; (3) intraoral [12, 13] and external [14] localized shimming; and (4) through-plane phase precompensatory slice selection [15–18].
Among all the techniques, Ref. [18] argued that the three-dimensional tailored RF (3DTRF) method in category (4) was comparatively advantageous, because of considerations in protocol flexibility, functional MRI (fMRI) signal-to-noise ratio (SNR) and temporal resolution, and the fact that it did not require additional shimming hardware. Based on the original version by Stenger et al. [17], Ref. [18] proposed advances to the 3DTRF method, with which effective slice selection (down to 5 mm thick) and phase precompensation have been demonstrated, using pulses shorter than the original by multiple folds.
However, the advanced 3DTRF method [18] still has several shortcomings. First, because of limited in-plane excitation selectivity, it is difficult to use the 3DTRF pulses to simultaneously recover multiple regions of signal loss, which typically appear in slices close to both the air-filled middle ears and sinuses. Also, it does not perform well at places where the magnetic field is severely distorted. For these reasons, it remains challenging to image the most inferior brain regions using 3DTRF pulses. In addition, iterative computation of 3DTRF pulses is time-consuming, and it must be performed online (during the experiment) using frequency offset maps just acquired from the subject. These performance limitations and computational cost hinder usage of the method in routine fMRI studies.
Generalizing the 3DTRF method for parallel excitation [19–21] is potentially a way to break through the limitations encountered at the inferior brain. Thanks to localized transmit coil sensitivity patterns, parallel excitation provides enhanced in-plane excitation selectivity compared to using a single transmit coil. It can potentially reduce the length of 3DTRF pulses and relax the performance limitations. Nevertheless, multiple-coil generalization of the 3DTRF pulse design increases its complexity significantly. The pulse computation time will further increase by multiple folds, thereby making implementation of the method even more challenging.
Therefore, a new excitation strategy is motivated for simultaneous slice selection and through-plane phase precompensation. Ideally, the new strategy will be effective over the entire brain, including the most inferior regions with complicated, high-magnitude field distortion patterns. Second, it will be desirable if the pulses can be computed offline (prior to the experiment) and retrieved for deployment during the experiment. In that case, long computational times will no longer be a concern. Third, it will be convenient if the same set of pulses can be repeatedly used for different slices in different subjects.
To meet these goals, we investigate a new pulse design method based on a novel phase precompensation concept. It does not prescribe precompensatory phase based on information of where dephasing occurs spatially. Instead, it does so based on the assumption that resonance frequency offset well predicts through-plane dephasing, which we will validate with a simple analysis. Unlike tailored RF pulse methods [15–18] that use spatially selective pulses, the new method uses two-dimensional (2D) spectral-spatial (SPSP) selective pulses [22]. Due to their special SPSP excitation patterns, those pulses are computed numerically using an iterative conjugate gradient (CG) algorithm.
This paper first describes the basic principles of through-plane phase precompensatory slice selection using SPSP pulses, the iterative pulse design, and the pulse computation and deployment process. Afterwards, we prove the concept via imaging the excitation pattern on a homogeneous phantom, and demonstrating signal loss mitigation in a single slice of a representative subject. We finally evaluate applying the pulses at multiple brain regions in multiple subjects. Results show that one single SPSP pulse, when properly modulated, was capable of slice selection with significantly mitigated signal loss at different brain regions in different subjects. However, further investigation is needed to prove that the SPSP pulses actually benefit activation statistics in functional studies.
3 Theory
3.1 Principle of phase precompensation
To explore using SPSP selective excitation for slice selection with through-plane phase precompensation, consider 2D gradient-echo (GRE) imaging of axial slices of the human head. Let us define TD as the time duration from the end of RF pulse to the acquisition of k-space origin. Note that TD is different from TE, usually defined as the duration between the times when magnetization flips down and when k-space origin is acquired. When imaging at slice location zj in the presence of an inhomogeneous main field with offsets ΔB(x, y, z), the through-plane dephasing that occurs during TD can be modeled with the first-order through-plane phase variation:
| (1) |
where γ is the gyromagnetic ratio, and gz,zj (x, y) = dΔB(x, y, zj)/dz denotes through-plane magnetic field gradient evaluated at zj. For contrast in BOLD fMRI, TD is relatively long (because of long TE), and therefore this phase variation is rapid where the through-plane field gradient is large. Voxel intensities that originate from integration of spin signals in those regions are lost due to phase cancellation at data readout.
One way to mitigate the signal loss is to precompensate the through-plane phase variation within the slice selection volumes. In lieu of the conventional slice-selective sinc pulse, we can use a multi-dimensional RF pulse to selectively excite a slice volume, d, with negative of the phase pattern in Eq. (1) embedded:
| (2) |
where p(z − zj) is the slice profile centered at zj. Ideally, the created phase pattern cancels out the through-plane dephasing during TD, and therefore through-plane spins align when the center of acquisition k-space is sampled at TE. Three-dimensional (3D) spatially selective excitation of Eq. (2) was investigated in the advanced 3DTRF method [18], and successful signal loss mitigation was demonstrated. However, as discussed above, the method’s performance limitations and computational cost hinder its use in routine fMRI studies.
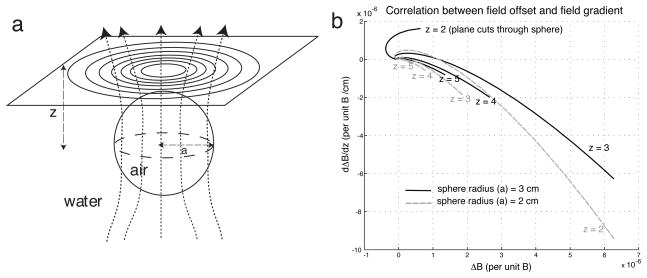
Alternatively, phase precompensation can be accomplished with a different approach that relies on the following fundamental assumption: At each axial slice location zj, there is strong spatial correlation between field offset ΔB(x, y, zj) and through-plane field gradient gz,zj (x, y). To validate this assumption, we analyze an experimental setup that emulates the field distortion in the human head caused by an air cavity. Consider applying a uniform magnetic field along the axial (+z) direction to a spherical volume of air (radius = a) immersed in an infinite water tank (Fig. 1a). Because water and air have different magnetic susceptibilities, the field is distorted near the water-air interface. The 3D field offset pattern (ΔB) can be expressed analytically in spherical coordinates [23], which can in turn be transformed into Cartesian coordinates. The z-direction field gradient can thereby be obtained via differentiating the formula with respect to z (see Appendix).
Fig. 1.
Magnetic field analysis suggests spatial correlation between field offset and z-direction field gradient in the human head. a: Field distortion caused by air-filled sphere (radius = a cm) immersed in water, emulating the distortion in the human head due to an air cavity. b: Plots of z-direction field gradient (dΔB/dz) against field offset (ΔB) on axial planes at different distances from sphere origin, based on formulas given in Appendix. For a given sphere radius, the quantities are roughly linearly correlated, with proportionality constant that slightly varies with the plane-to-sphere distance (z). Similar correlational relationship between field offset and gradient can also be observed with different sphere radii (gray dashed plots in (b)). Note that on planes that cut through the sphere (e.g., z = 2 when a = 3), only the field offset and gradient within the water region is analyzed. (z: cm)
The formulas can be used to evaluate the field offset and gradient external to the sphere on any axial plane (Fig. 1a). For a given sphere radius (e.g., a = 3 cm), when we plot the field gradient against offset over a plane above the sphere (e.g., z = 4 cm), we observe that the two quantities exhibit a roughly linear correlation (Fig. 1b): the field gradient is roughly proportional to the field offset, such that its magnitude is large at spatial locations where the field offset is large. Similar correlation can also be observed on other axial planes above the sphere. Although the approximate proportionality constants between offset and z-direction gradient slightly vary with z, they are comparable to each other. Using the same setup, similar observations can be made with different sphere radii (Fig. 1b, gray), and potentially could be made with air cavities with other configurations as well.
This simple analysis shows that the spatial correlation assumption aforementioned is reasonable in the human head. It suggests that field offset, and therefore resonance frequency offset, can be regarded as a coarse predictor of z-direction field gradient. Using this assumption, we express the field gradient in Eq. (1) as a function of general resonance frequency offset variable, f, instead of x, y. In particular, since the correlations are roughly linear as shown in our field analysis, we write
| (3) |
with αj being the proportionality constant between frequency offset and through-plane field gradient for slice location zj. Generally, αj is a negative quantity that varies with slice location. Now, we define a desired SPSP pattern via substituting gz,zj (x, y) in Eq. (1) with Eq. (3). Equation (2) becomes
| (4) |
An SPSP pulse with this excitation response is potentially efficacious for simultaneous slice selection and phase precompensation at zj. However, to make the SPSP pattern realizable by an SPSP pulse, we need to introduce a z-dimension shift (zshift) to the phase pattern:
| (5) |
such that the phase variations along f (with rates being γTDαj(z − zj − zshift)) are always non-positive within the slice (for z ∈ [zj − W/2, zj + W/2], where W is the slice thickness). A good choice of zshift is − W/2. It leads to zero phase variation along f at z = zj − W/2, and the phase variation along f at z = zj + W/2 is kept to the slowest possible, which helps reduce the length of the final pulse design.
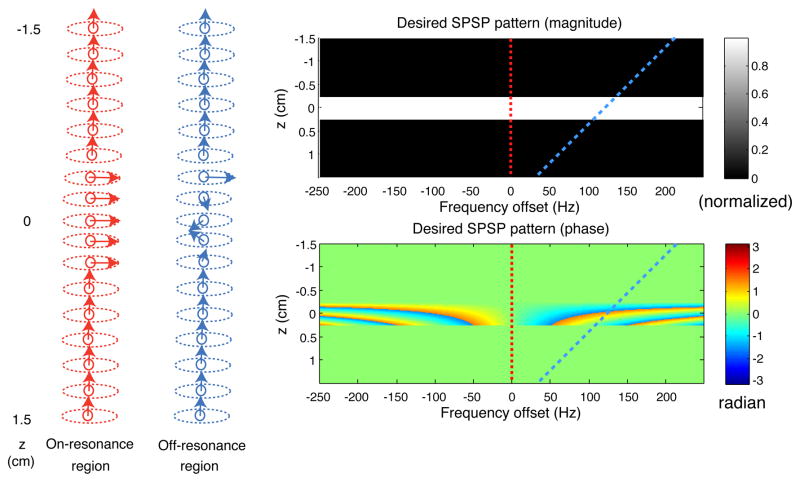
Fig. 2 shows the SPSP pattern depicted in Eq. (5) (with zshift = −W/2 and other parameter values provided in the Materials and Methods section). It is spatially selective for exciting a rectangular slice profile; and spectrally selective for creating z-direction phase variations with rates proportional to frequency offset. Depending on its z location and frequency offset, magnetization either stays unaffected, or flips down to the transverse plane with various phase values, without regard to its in-plane location. In a brain region where there is no main field distortion (spins are on-resonance), slice selection is achieved as indicated by the red dashed lines in Fig. 2. Spins through the imaging plane flip down with the same phase, and therefore contribute constructively to voxel intensities. Meanwhile, in a region where the field is distorted (spins are off-resonance), slice selection is achieved as indicated by the blue dashed lines on the desired magnitude and phase patterns. The spins through the slice volume, which are at different frequency offsets, flip down with different phase values, as can be read off from the blue dashed line on the desired phase pattern. Phase precompensation is accomplished if these phase values match the negative of those caused by through-plane dephasing. In essence, we attempt to create precompensatory phase based not on the prior knowledge of where dephasing occurs (as in the 3DTRF method), but instead on the assumption that dephasing can be reliably predicted by frequency offset, as supported by our field analysis (Fig. 1b).
Fig. 2.
Illustration of the basic principles of slice selection and phase precompensation using 2D SPSP selective excitation. In an on-resonance brain region, slice selection is accomplished as indicated by the red dashed lines. In an off-resonance brain region, the slice volume is excited with through-plane phase values, as indicated by the blue dashed lines. If that phase variation matches the negative of that caused by dephasing, signal loss mitigation can be achieved.
3.2 Iterative SPSP pulse design
Selective excitation of SPSP patterns is facilitated by the SPSP k-space concept under small-tip-angle approximation of the Bloch equation [22]. In the small-tip regime, transverse-plane excitation pattern (m), as a function of space (x, y, z) and frequency offset (f), approximately equals the Fourier integral of a trajectory in the SPSP k-space, weighted by complex RF pulse b(t), t ∈ [0, T]:
| (6) |
where r = (x, y, z, f), and kspsp(t) = (k(t), kf (t)) is the SPSP k-space variable, in which k(t) is given by the backward integral of the gradient waveforms [24] and kf (t) = 2π(t − T).
Discretizing Eq. (6) to Nr SPSP locations and Nt time points, we write
| (7) |
where m = (m(r0), …, m(rNr−1)), b = (b0, …, bNt−1), and the elements of the Nr × Nt system matrix A are
| (8) |
with Δt being the temporal sampling interval of the pulse. We design the SPSP pulse samples that approximately excite the 2D desired pattern dspsp(r) in Eq. (5) (now r = (z, f)) by solving the following minimization problem:
| (9) |
where dspsp = (dspsp(r0), …, dspsp(rNr−1)), W is a diagonal matrix containing spatial weights that define a region of interest (ROI), and R(b) denotes a general regularization term that penalizes RF power. This setup is an extension of the analogous iterative design method of spatially selective pulses [25].
The designed SPSP pulse (b̂) will be useful only if its resulting excitation pattern, approximated by Ab̂, closely resembles dspsp (within the ROI defined in W). The k-space trajectory used in the system matrix is a critical design component that affects how well the desired pattern is attained. We choose to adopt the oscillatory z gradient waveform used in conventional SPSP pulse design [22]. Determination of the right oscillation parameters involves balancing several design objectives, while keeping the trajectory as short as possible. We will discuss those considerations in detail in the Materials and Methods Section.
3.3 Pulse computation and deployment
A set of SPSP pulses, iteratively designed with an array of α values, can be computed offline and stored. In the actual functional experiment, one SPSP pulse is selected for each slice location, with the objective of producing focused through-plane spins at all in-plane locations. Pulse selection can be based on the field maps acquired online. The slice thickness of the field maps must be small enough to resolve the frequency offset values through the fMRI voxels. How α values can be chosen automatically based on the acquired thin-slice field maps is currently under investigation. Alternatively, the choices could be based on field maps from prior brain scans, or even just theoretical prediction and empirical experimentation. With these options, online field map acquisition could be abandoned.
4 Materials and Methods
This section describes details of the SPSP pulse design implementation and our phantom and human experiments.
4.1 Pulse design implementation
4.1.1 Desired pattern specification
Desired SPSP patterns are specified via sampling Eq. (5) at Cartesian grid locations in f-z space. There are several considerations in choosing the sampling grid. First, in the z dimension, sampling has to cover the entire z range over which MR signals can arise. This implies that zeros have to be padded to all of the out-of-slice spatial locations. In the f dimension, the sampling range should contain the range of frequency offsets present in the entire subject head. Sampling intervals in both f and z have to be small enough that the slice profile and phase variations along either dimension are adequately represented according to the Nyquist criterion.
For all the pulses designed for the phantom and human experiments, the sampling range was 500 Hz (f) × 20 cm (z), with matrix size 300 (f) × 1200 (z). TD was defined as TE minus half of the pulse length. The other common parameters were as follows: the desired slice profile was rectangular with width = 5 mm, flip angle = 30 degrees, and zshift = −2.5 mm. A range of α values were used in our designs, as discussed below. Figure 2 shows the desired pattern for α = −2 × 10⁻⁴ G/cm/Hz. For illustration purposes, the flip angle (30 degrees) was normalized to 1, and only the central 3 cm in z was shown (beyond which zeros were assigned).
4.1.2 Trajectory specification
There are several criteria in choosing the parameters of the oscillatory trajectory in f-z space. First, the kz coverage has to be wide enough that the slice profile specifications are met and the z-dimension phase variations in the desired pattern can be rendered. This consideration sets a lower limit on the area of each lobe in the oscillatory gradient. Second, the kf coverage has to be wide enough that the f -dimension phase variations in the desired pattern can be created. It sets a lower limit on the pulse duration. Lastly, the gradient oscillation frequency has to be sufficiently high that kf is sampled densely enough. It assures that the f -dimension excitation aliasing does not too severely affect the excitation fidelity in the ROI in f-z space. In our designs, the trajectories were produced by oscillatory z gradient waveforms composed of trapezoids. The trapezoids complied with the maximum gradient and slew rate constraints, which were 4 G/cm and 15000 G/cm/s, respectively.
4.1.3 Iterative pulse design
SPSP pulses were designed via solving Eq. (9) using CG [26], with sufficient number of iterations for full convergence (100). To speed up computation, the forward and backward projections in the CG routine were handled using non-uniform fast Fourier transformation (NUFFT) [27], which used a table-based, min-max interpolator (with Kaiser-Bessel scaling) using 8 neighbors and an upsampling factor of 2 in both the spatial and spectral dimensions. In our designs, the ROI (W) covered the entire f-z region over which the desired pattern was specified. No regularization was applied to the cost function (i.e., R(b) = 0). After iterative design, a hamming window (function of kz) was applied to suppress ripples in the slice profile caused by Gibbs phenomenon.
4.1.4 Precomputation of a SPSP pulse set
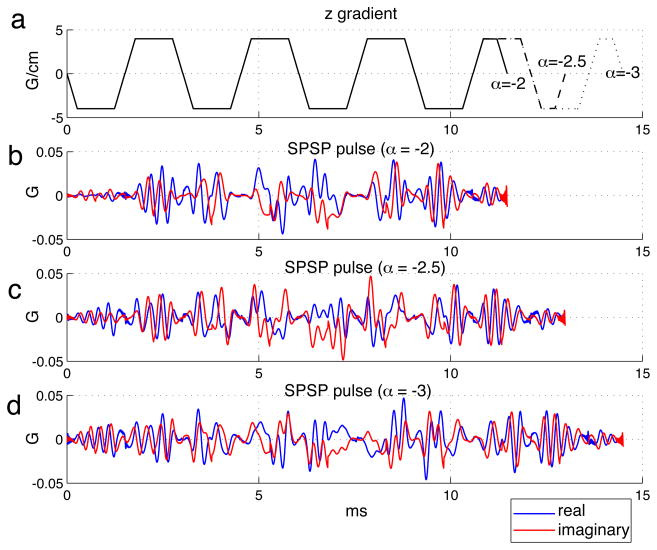
Because methods of automatically determining α based on field maps required further research, we resorted to manual selection of pulses from a precomputed set in our phantom and human demonstrations. The set contained 11 SPSP pulses that were designed using α values ranging from −1 × 10⁻⁴ to −3.5 × 10⁻⁴ G/cm/Hz, at −0.25 × 10⁻⁴ G/cm/Hz intervals. For increasing α magnitudes, we used trajectories with increasing oscillation periods (2.5 to 3 ms) and number of cycles (6 to 10). The choices were made in an ad hoc fashion based on Bloch simulations. The resulting pulse lengths ranged from 8.35 to 16.02 ms, depending on the trajectory oscillation parameters. The iterative pulse designs, implemented with Matlab (The Mathworks, Inc., Natick, MA, USA) on a 3.4-GHz Pentium workstation with 2 GB memory, took about 100 s for completion. After computation, the SPSP pulses were stored as waveform files, ready to be deployed in the experiments. Figure 3 shows three SPSP pulses in our pulse set, accompanied by their oscillatory z gradient waveforms. They were designed for different α values (−2, −2.5, −3, in 10−4 G/cm/Hz), which required different pulse lengths for their individual desired patterns. The RF waveforms varied substantially as a function of α.
Fig. 3.
Three SPSP pulses in our precomputed pulse set (b-d), accompanied by their oscillatory z gradient waveforms (a). They were designed for different α values (in units of 10−4 G/cm/Hz), which required different pulse lengths for their individual desired patterns.
4.2 Experimental setup
To evaluate SPSP pulse designs, we conducted experiments using a GE 3 T Signa (Excite II) MRI scanner (GE Healthcare, Waukesha, WI, USA), with a head coil for both transmission and reception. Phantom experiments were performed on a spherical homogeneous water phantom. In the human experiment, five healthy volunteers participated with approval by the Institutional Review Board of the University of Michigan, after providing informed consent. High-order shimming was performed prior to all the experiments. For each SPSP pulse, the z gradient waveform was shifted forward in time by 150 μs to compensate for the delay between the RF and gradient channels. In all sequences, TE was defined as the duration from middle of the RF pulse to the sampling time of the center of acquisition k-space. Images were reconstructed using conjugate phase (CP) [28] or the iterative method described in Refs. [26, 29]. Both of the reconstruction methods compensated for off-resonance-induced phase error during readout. Note, though, that the methods assumed a single frequency offset value per voxel and ignored intra-voxel field variations.
4.2.1 Imaging the SPSP pattern
First we attempted to image the SPSP excitation patterns in the phantom to verify that the pulses actually excited selectively as desired. We used a pulse sequence commonly found in the SPSP pulse design literature [22,30,31]. The SPSP pulse was played out with the RF magnitude and phase channels. The oscillatory z gradient was applied to one of the transverse-plane gradient channels (Gy), with a constant gradient applied to the other (Gx) for simulating a frequency offset axis. Afterwards, a slice-selective 180-degree pulse, in between crushers, was applied in the third dimension (z). It was followed by a spiral-out readout that acquired the image.
The sequence’s parameter values were as follows: Gx = −0.00575 G/cm, mapping the x-dimension FOV of 20 cm to a spectral FOV of 500 Hz. The oscillatory gradient waveform, played on Gy, was scaled to have maximum amplitude at 0.6 G/cm (4 G/cm in original design). It mapped the y-dimension FOV of 20 cm to a slice-select-direction FOV of 3 cm. As a result, the SPSP pattern was “magnified” along the slice-select direction so that the through-plane phase variations could be clearly observed. Acquisition matrix size = 128 × 128, number of spiral interleaves = 8, TE = 20 ms, TR = 1 s, and thickness of slice excited by the 180 pulse was 15 mm.
4.2.2 Demonstration of phase precompensation in a single slice
Next, we aimed to demonstrate the SPSP phase precompensation concept in a single slice in the head of a representative subject. We obtained baseline loss-plagued images through the isocenter, using a GRE sequence incorporated with a conventional sinc pulse. The sinc pulse was 3.2 ms long, Hanning-windowed, and selective for a 5-mm slice with flip angle of 30 degrees. TE = 30 ms. TR = 1 s. Fat saturation was applied.
For low and high image resolutions, we used either 1 or 16 spiral-in-out [6] interleaves, with corresponding matrix size of either 64 × 64 or 256 × 256, for a FOV diameter of 24 cm. The low-resolution parameters were typical for routine fMRI studies. On the other hand, using the high-resolution parameters, the high number of spiral interleaves minimized phase error during readout caused by field inhomogeneity, whereas the fine in-plane resolution reduced the effect of in-plane dephasing. As a result, through-plane dephasing was isolated as the dominant cause of signal loss in the high-resolution images.
After acquiring images with the standard sinc pulse, we tried finding one SPSP pulse from our precomputed pulse set to excite the same slice volume at isocenter with signal loss mitigation. The sinc pulse in the GRE sequence was replaced by the chosen SPSP pulse, with all other sequence components and parameters unchanged. The flip angles of the sinc and spsp pulses were both 30 degrees. The low- and high-resolution images acquired with the SPSP pulse were compared with those acquired using the sinc pulse.
For analysis purposes, we also estimated field maps of contiguous 1-mm axial slices around the isocenter, using two sets of GRE images acquired with a slight TE difference of 1 ms [32].
4.2.3 Multi-slice phase precompensation in multiple subjects
Using the same spiral GRE sequence with low-resolution acquisition parameters (except that FOV diameter = 22 cm), we tested applying the sinc and SPSP pulses at different brain locations in multiple subjects. Flip angles of the sinc and SPSP pulses were matched at 60 degrees. All GRE images were reconstructed using the iterative algorithm. For each subject, we graphically prescribed 13 axial slices for whole brain coverage. The slice locations were approximately matched across subjects with respect to brain structures. As in the previous demonstration at isocenter, the slices were 5 mm thick. They were separated by 5-mm gaps.
To excite a slice at position z = zj away from the isocenter, we programmed the pulse sequence to modulate the synthesizer frequency with a scaled copy of the slice-select gradient waveform (Gz(t)) [30, 31]:
| (10) |
On our GE scanner, it could be conveniently achieved via playing the z-gradient waveform, scaled based on the desired slice location, to the OMEGA channel of the scanner’s RF generator. For ease of implementation, in each run of the spiral GRE sequence, one common SPSP pulse (one α value) was used for all slice locations. It was hand-picked for each subject based on loss mitigation effectiveness in try-out runs. With more sophisticated sequence programming, it is certainly feasible to deploy different SPSP pulses for different slice locations.
In addition to GRE images acquired with the sinc and SPSP pulses, we also acquired spin-echo (SE) images for the same FOV and slice locations. The reference SE images, which had no signal loss artifacts, served as the standard to which the GRE images were compared. They were acquired with matrix size 256 × 256 with 16 spiral-out interleaves, reconstructed with CP, and subsequently downsampled to 64 × 64 for matching the resolution of the GRE images. They were also used for manual definition of a brain ROI in which signal loss was quantified.
To quantify signal loss, we first normalized the SE and GRE images with their individual average voxel intensities within the brain ROI. Percentages of signal loss, in the normalized images acquired either with sinc or SPSP pulse, were computed for each voxel relatively to the normalized SE images. Numbers of within-ROI voxels that had signal loss of at least 25%, 50% and 75% were counted.
4.2.4 Functional study
For preliminary investigation of the impact of SPSP pulses on BOLD fMRI activation statistics, we ran a breath-holding task [13] on our subjects, using either sinc or SPSP pulse. The breath-holding task is known to produce activations throughout the brain, including the loss-plagued inferior brain regions. Imaging setup (slice prescriptions, sequence parameters, RF pulses) was identical to the previous single-time-point experiment, except that the sequence was now repeated for multiple time frames. During a scan, the subject was visually cued to alternately breathe normally or to hold breath in 15-second blocks. There were totally 8.5 cycles, resulting in 255 time frames in 4.25 minutes. Activation maps were generated statistically under the generalized linear model (GLM) of BOLD signals. In the analysis, signal average and drift (linear and quadratic) components were regressed out, and two sine and cosine functions were used to extract the BOLD activations. For each voxel, the regression coefficients for the sine and cosine functions were analyzed with F-test. The F-statistics were thresholded for activation maps.
5 Results
5.1 Imaging the SPSP pattern
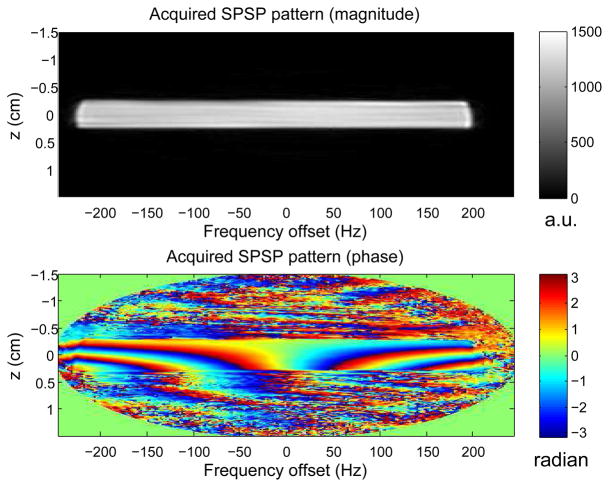
The acquired SPSP excitation patterns in the water phantom closely matched the desired patterns with which the SPSP pulses were designed. As an example, Fig. 4 shows the pattern excited by the SPSP pulse (Fig. 3b) computed using the desired pattern with α = −2 × 10⁻⁴ G/cm/Hz (Fig. 2). Fidelity of the acquired patterns, in both magnitude and phase, suggested that the SPSP pulses were indeed properly designed and deployed by the scanner hardware.
Fig. 4.
SPSP pattern excited by the pulse shown in Fig. 3b. It closely resembles its desired pattern with α = −2 × 10⁻⁴ G/cm/Hz (Fig. 2).
5.2 Demonstration of phase precompensation in a single slice
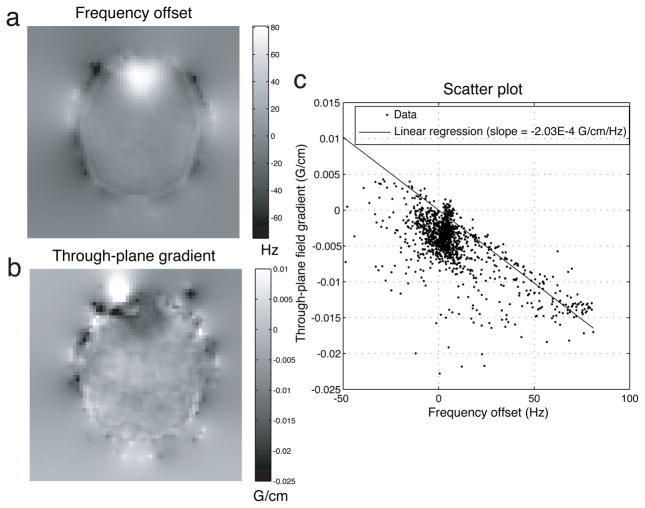
Figure 5a shows the smoothed field map of an axial 1-mm slice through the inferior brain of the subject. The field at the anterior brain region, superior to the frontal sinuses, was highly distorted. With field maps of contiguous 1-mm slices, we estimated the through-plane field gradient map (Fig. 5b) via through-plane linear regression. The field gradient map showed significant through-plane dephasing at the anterior region. Spatial correlation between the field and field gradient maps within the brain region was exhibited with a scatter plot (Fig. 5c). We performed 1-norm linear regression and obtained a linear fit (with no intercepts) to the data on the scatter plot. The slope of the regression line was −2.03 × 10⁻⁴ G/cm/Hz. This measure could potentially be helpful for the SPSP pulse selection process in practice. Outliers away from the major data cluster corresponded to the few voxels at which the correlation assumption was invalid.
Fig. 5.
a: Field map of a 1-mm axial inferior brain slice in a representative subject. b: Through-plane field gradient map derived from contiguous field maps. c: Scatter plot of voxels within the brain region exhibited strong spatial correlation between the quantities. In practice, the slope of the 1-norm linear regression line through the origin could potentially help select a SPSP pulse with appropriate α value.
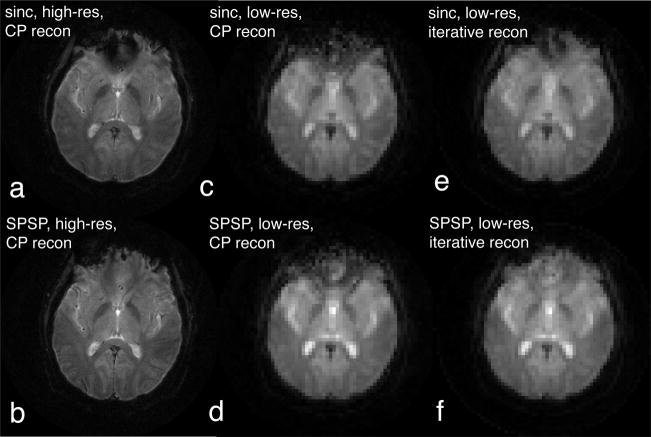
At that same slice location, we tested slice selection with our sinc and SPSP pulses. Amongst the eleven SPSP pulses we precomputed, we found that the 11.48-ms pulse designed with α = −2 × 10⁻⁴ G/cm/Hz (Fig. 3b) was the most effective in signal loss mitigation. It is noteworthy that this α value empirically chosen almost matched the regression line slope in the scatter plot (Fig. 5c). Figures 6a,b show the high-resolution images acquired with the sinc and SPSP pulses, respectively. Although these images were reconstructed using CP that accounted for frequency offsets, they were still susceptible to signal loss caused by through-plane dephasing. The almost complete signal recovery suggested that the SPSP pulse was highly effective in counteracting the dephasing.
Fig. 6.
Demonstration of phase precompensation at the same slice location as in Fig. 5. a: In the high-resolution (16-interleave, 256×256) image acquired with sinc pulse, signal loss was observed at the anterior brain region superior to the frontal sinuses. b: SPSP pulse (α = −2 × 10⁻⁴ G/cm/Hz) almost led to complete signal recovery. c: Low-resolution (single-interleave, 64×64) image reconstructed with non-iterative CP was plagued by field-inhomogeneity-induced signal loss and distortion artifacts. d: The SPSP pulse mitigated the signal loss. e,f: The low-resolution images in c and d could be improved if iterative reconstruction was used instead of CP, showing the efficacy of the SPSP pulse even more clearly.
Signal loss mitigation could also be demonstrated in low-resolution images (Fig. 6c,d) reconstructed with CP. In Fig. 6c, phase error during readout was corrected partially by CP, but through-plane dephasing still caused substantial signal loss. SPSP excitation was capable of complementing CP in the through-plane direction, resulting in significant loss mitigation (Fig. 6d). As shown in Fig. 6e,f, quality of the low-resolution images could be further boosted if they were reconstructed iteratively based on Refs. [26, 29] instead of CP, revealing the efficacy of the SPSP pulse even more clearly. It is remarkable that the off-resonance artifacts were mostly eliminated (Fig. 6f) when we properly counteracted the two separate artifact mechanisms with SPSP excitation and iterative reconstruction.
5.3 Multi-slice phase precompensation in multiple subjects
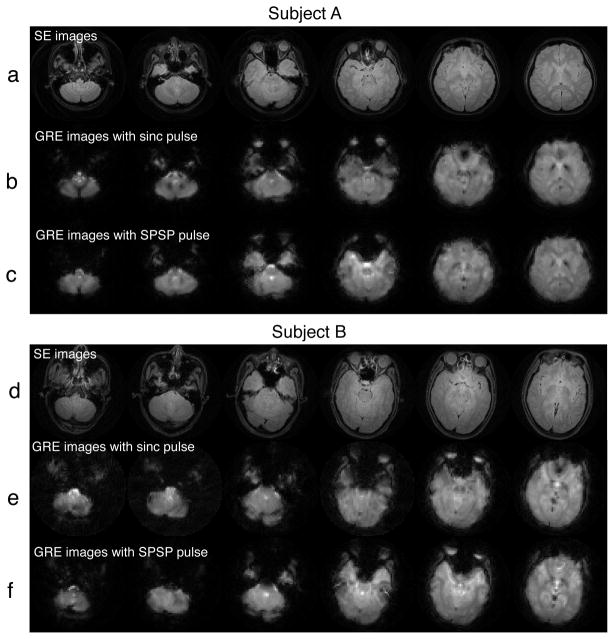
We first acquired coronal SE images with the water phantom, and successfully verified that frequency modulation of the SPSP pulses accurately shifted the slice volume to desired off-isocenter locations (data not shown). Afterwards, we tested the pulses on our five subjects. Fig. 7 shows two sets of SE and iteratively-reconstructed GRE images acquired at six inferior slice locations of Subject A and B. Juxtaposed with SE images, it is clear that the sinc-excited GRE images (Fig. 7b,e) suffered extensive signal loss at different inferior-temporal and orbital-frontal lobe regions. Remarkably, a common SPSP pulse (α = −2 × 10⁴ G/cm/Hz) was globally effective in mitigating signal loss at those regions (Fig. 7c,f). At the same time, regions in the inferior slices that were originally not plagued by signal loss remained mostly unaffected by the SPSP pulses.
Fig. 7.
SE (a,d) and iteratively-reconstructed GRE images acquired at six inferior slice locations of Subject A and B. The GRE images were acquired with either sinc pulse (b,e) or SPSP pulse with α = −2 × 10⁻⁴ G/cm/Hz (c,f). In both subjects, The SPSP pulse was globally effective in mitigating signal loss at the inferior temporal and orbital frontal lobes.
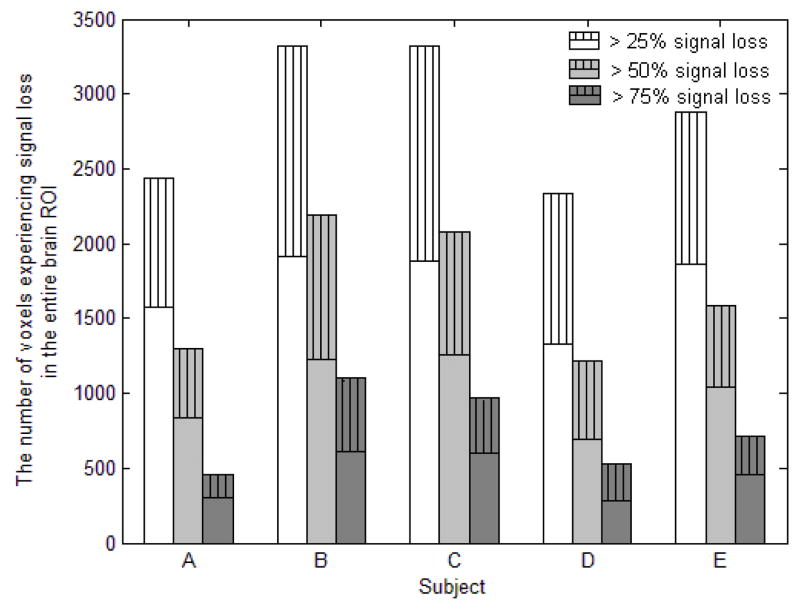
Slice selection and global loss mitigation were robustly achieved in all of our five subjects. Loss mitigation was quantified by counts of signal loss voxels as presented in Fig. 8. For each subject, the three bars represent the number of voxels, counted within the brain ROI, that experienced signal loss of at least 25%, 50%, and 75% compared to the SE reference images. For each bar, the solid portion represents voxels when SPSP pulse was used, and the striped portion represents the additional voxels that were lost when sinc pulse was used. It is clear that there were significant reductions in signal loss, at all levels, when SPSP pulse was used in lieu of the sinc pulse.
Fig. 8.
Amount of signal loss voxels within the brain ROI, acquired with either sinc or SPSP pulse, for each of our five subjects. Number of voxels experiencing at least 25%, 50%, and 75% when SPSP pulse was used are presented as solid bars. The striped bars above represent the additional voxel counts, for each loss level, when sinc pulse was used. It is clear that the SPSP pulse was effective in reducing signal loss at all levels.
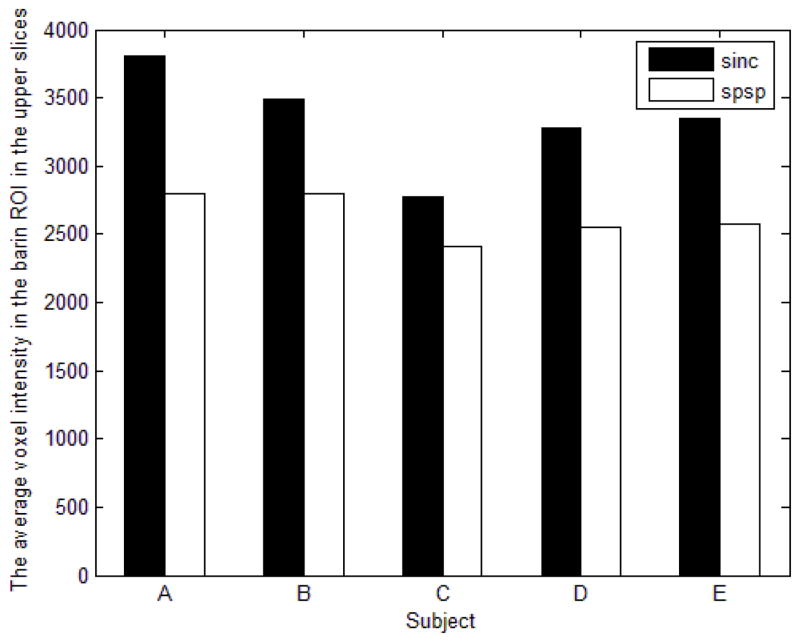
However, despite successful loss mitigation in the six inferior slices, the SPSP pulse commonly caused slight voxel intensity drops at other brain regions. It was especially troubling in the six most superior slices, where the average voxel intensities in the brain ROI were significantly reduced (Fig. 9). This phenomenon was plausibly caused by the mismatch between the chosen α value and the actual correlational relationship in the upper brain, resulting in unwanted through-plane phases being created by the SPSP pulse.
Fig. 9.
Despite signal loss mitigation in inferior slices as shown in Fig. 7, the SPSP pulse led to reduction in average voxel intensity in the six most superior slices of all of our subjects. (a.u.: arbitrary units)
5.4 Functional study
Unfortunately, with data from our breath-holding experiments, we were unable to reliably show that SPSP pulses improved F-statistics in the recovered brain regions compared to the sinc pulse. In fact, in some subjects, we even observed decrease in F-statistics in voxels that originally showed significant activation in the sinc case. Further investigations are needed for proving that SPSP pulses are actually beneficial for boosting functional statistics.
6 Discussion
In this paper, we have explored a novel excitation strategy to achieve through-plane phase precompensatory slice selection in -weighted fMRI. The method relies on the key assumption that at each axial slice location, resonance frequency offset can serve as a good predictor of through-plane dephasing. Specially designed 2D SPSP pulses exploit that spatial correlation to create through-plane phase variation with rates that increase with frequency offset. A set of SPSP pulses, designed for different phase variation rates, can be precomputed offline and repeatedly used for different slices in different subjects. Selection of the appropriate SPSP pulse can be based on field maps, theoretical prediction, or empirical experimentation.
The SPSP phase precompensation concept was proven in phantom and human experiments. First we verified that the pulses properly excited the desired SPSP patterns in a phantom. Afterwards, we demonstrated, in all of our five subjects, that the SPSP pulses were effective in slice selection with mitigated signal loss at different slice locations throughout the brain. With one common SPSP pulse, we observed global loss mitigation at different brain locations, including some of the most inferior regions in the inferior temporal and orbital frontal lobes, where the frequency offsets were very large. Such efficacy, observed globally and at regions with high field offsets, represents a major advancement relative to the 3DTRF pulses [18]. The fact that the SPSP pulses were precomputed offline and repeatedly used for different subjects was also a major advantage, compared to 3DTRF pulses that must be computed online. Precomputation eases the hardware and software requirements for fast online pulse computation.
Indeed, we were surprised to find that one single SPSP pulse with α = −2 × 10⁻⁴ G/cm/Hz was globally effective at multiple brain locations in different subjects. That α value was remarkably consistent with the proportionality constant between field offset and through-plane field gradient obtained from numerical analysis (Fig. 1) and actual field map measurements (Fig. 5). Using one common pulse for all slices greatly simplifies pulse sequence programming, compared to the case when different waveforms are to be deployed for different slice locations. However, it remains unclear whether such global effectiveness would be true under different shimming conditions, in different scanning systems, and in a broad range of subjects. It is also unclear how much improvement could be achieved if one carefully selects SPSP pulses in a slice-by-slice manner. It seems likely, though, that the intensity reduction problem we observed in the superior slices (Fig. 9) could have been avoided, if different pulses were deployed for those locations (e.g., sinc pulses).
As illustrated in those superior slices, a potential problem is that the SPSP phase precompensation scheme may not work as we ideally plan in some brain regions. It can possibly happen in two ways. One possibility is that in some brain regions the field offsets and gradients do correlate linearly, but the applied α value is a mismatch to their proportionality constant. This problem is encountered when bad α choices are made, or when correlational relationships vary significantly in different regions on the same slice (e.g., in the inferior brain), so that no single α can accommodate all the regions. In this situation, through-plane dephasing will be insufficiently or overly precompensated, and spins originally in phase will inappropriately pick up through-plane phases. In our human experiments, the chosen SPSP pulse with α = −2 × 10⁻⁴ G/cm/Hz was plausibly a mismatch for the superior slice locations, resulting in intensity reduction caused by unwanted through-plane phases created by the pulse.
Another possible scenario, in which SPSP phase precompensation may fail, is when the field offset and gradient values correlate non-linearly, or in the worst case, simply are uncorrelated. As a result, the fundamental assumption is invalid, and no α values will be capable of phase precompensation and delivering loss-mitigated images. This scenario can be encountered in the most inferior slices, where the field varies rapidly due to multiple air cavities and gets further complicated by high-order shimming.
Despite evidence for robust signal loss mitigation, it is critical to investigate the impact of SPSP pulses on BOLD fMRI activation statistics before introducing them into routine functional experiments. Unfortunately, with the data from our breath-holding experiments, we were unable to reliably show that SPSP pulses improved F-statistics in the recovered brain regions compared to the sinc pulse. Further investigations are needed for proving that SPSP pulses are actually beneficial for boosting functional statistics. It hinges on the key questions of how the SPSP excitation patterns affect BOLD contrast, and whether they alter the BOLD sensitivity to brain activations.
7 Conclusion
Our novel spectral-spatial pulse design is effective for slice selection with significant mitigation in signal loss in T2*-weighted fMRI. It has high potential for routine use in fMRI experiments.
Acknowledgments
NIH Grants R01DA015410, R01NS058576
8 Appendix
Due to the magnetic susceptibility difference between water and air, a uniform magnetic field applied to an air-filled spherical volume immersed in an infinite tank of water is distorted near the water-air interface. The field pattern external to the sphere, expressed in spherical coordinates [23], can be transformed into Cartesian coordinates:
| (11) |
where ΔB(x, y, z) is the spatial pattern of magnetic field offset relative to that inside the sphere (which is uniform), B0 is the applied field strength, a is the radius of the sphere, and Δχ = χa − χw is the susceptibility difference between air and water. This formula can be differentiated with respect to z to obtain the z-direction field gradient:
| (12) |
With Eqs. (11) and (12), the relationship between field offset and gradient over space can be investigated.
References
- 1.Merboldt KD, Finsterbusch J, Frahm J. Reducing inhomogeneity artifacts in functional MRI of human brain activation-thin sections vs gradient compensation. J Magn Reson. 2000;145:184–191. doi: 10.1006/jmre.2000.2105. [DOI] [PubMed] [Google Scholar]
- 2.Yoo SS, Guttmann CR, Panych LP. Multiresolution data acquisition and detection in functional MRI. Neuroimage. 2001;14(6):1476–1485. doi: 10.1006/nimg.2001.0945. [DOI] [PubMed] [Google Scholar]
- 3.Chen NK, Dickey CC, Yoo SS, Guttmann CR, Panych LP. Selection of voxel size and slice orientation for fMRI in the presence of susceptibility field gradients: application to imaging of the amygdala. Neuroimage. 2003;19(3):817–825. doi: 10.1016/s1053-8119(03)00091-0. [DOI] [PubMed] [Google Scholar]
- 4.Deichmann R, Gottfried JA, Hutton C, Turner R. Optimized EPI for fMRI studies of the orbitofrontal cortex. Neuroimage. 2003;19:430–441. doi: 10.1016/s1053-8119(03)00073-9. [DOI] [PubMed] [Google Scholar]
- 5.De Panfilis C, Schwarzbauer C. Positive or negative blips? The effect of phase encoding scheme on susceptibility-induced signal losses in EPI. Neuroimage. 2005;25(1):112–121. doi: 10.1016/j.neuroimage.2004.11.014. [DOI] [PubMed] [Google Scholar]
- 6.Glover GH, Law CS. Spiral-in/out BOLD fMRI for increased SNR and reduced susceptibility artifacts. Magn Reson Med. 2001;46(3):515–522. doi: 10.1002/mrm.1222. [DOI] [PubMed] [Google Scholar]
- 7.Li TQ, Takahashi A, Wang Y, Mathews V, Glover GH. Dual-echo spiral in/in acquisition method for reducing magnetic susceptibility artifacts in blood-oxygen-level-dependent functional magnetic resonance imaging. Magn Reson Med. 2006;55(2):325–34. doi: 10.1002/mrm.20783. [DOI] [PubMed] [Google Scholar]
- 8.Glover GH. 3D z-shim method for reduction of susceptibility effects in BOLD fMRI. Magn Reson Med. 1999;42:290–299. doi: 10.1002/(sici)1522-2594(199908)42:2<290::aid-mrm11>3.0.co;2-n. [DOI] [PubMed] [Google Scholar]
- 9.Song AW. Single-shot EPI with signal recovery from the susceptibility-induced losses. Magn Reson Med. 2001;46:407–411. doi: 10.1002/mrm.1205. [DOI] [PubMed] [Google Scholar]
- 10.Heberlein KA, Hu X. Simultaneous acquisition of gradient-echo and asymmetric spin-echo for single-shot z-shim: Z-SAGA. Magn Reson Med. 2004;51(1):212–216. doi: 10.1002/mrm.10680. [DOI] [PubMed] [Google Scholar]
- 11.Du YP, Dalwani M, Wylie K, Claus E, Tregellas JR. Reducing susceptibility artifacts in fMRI using volume-selective z-shim compensation. Magn Reson Med. 2007;57(2):396–404. doi: 10.1002/mrm.21150. [DOI] [PubMed] [Google Scholar]
- 12.Wilson JL, Jenkinson M, Jezzard P. Optimization of static field homogeneity in human brain using diamagnetic passive shims. Magn Reson Med. 2002;48(5):906–914. doi: 10.1002/mrm.10298. [DOI] [PubMed] [Google Scholar]
- 13.Hsu JJ, Glover GH. Mitigation of susceptibility-induced signal loss in neuroimaging using localized shim coils. Magn Reson Med. 2005;53(2):243–248. doi: 10.1002/mrm.20365. [DOI] [PubMed] [Google Scholar]
- 14.Wong EC, Mazaheri Y. Shimming of the inferior frontal cortex using an external local shim coil. Proceedings of the 12th Annual Meeting of ISMRM; Kyoto. 2004. p. 520. [Google Scholar]
- 15.Glover GH, Lai S. Reduction of susceptibility effects in BOLD fMRI using tailored RF pulses. Proceedings of the 5th Annual Meeting of ISMRM; 1997. [Google Scholar]
- 16.Chen N, Wyrwicz A. Removal of intravoxel dephasing artifact in gradient-echo images using a field-map based RF refocusing technique. Magn Reson Med. 1999;42:807–812. doi: 10.1002/(sici)1522-2594(199910)42:4<807::aid-mrm25>3.0.co;2-8. [DOI] [PubMed] [Google Scholar]
- 17.Stenger VA, Boada FE, Noll DC. Three-dimensional tailored RF pulses for the reduction of susceptibility artifacts in -weighted functional MRI. Magn Reson Med. 2000;44:525–531. doi: 10.1002/1522-2594(200010)44:4<525::aid-mrm5>3.0.co;2-l. [DOI] [PMC free article] [PubMed] [Google Scholar]
- 18.Yip CY, Fessler JA, Noll DC. Advanced three-dimensional tailored RF pulse for signal recovery in -weighted functional MRI. Magn Reson Med. 2006;56(5):1050–9. doi: 10.1002/mrm.21048. [DOI] [PubMed] [Google Scholar]
- 19.Katscher U, Börnert P, Leussler C, van den Brink JS. Transmit SENSE. Magn Reson Med. 2003;49:144–150. doi: 10.1002/mrm.10353. [DOI] [PubMed] [Google Scholar]
- 20.Zhu Y. Parallel excitation with an array of transmit coils. Magn Reson Med. 2004;51:775–784. doi: 10.1002/mrm.20011. [DOI] [PubMed] [Google Scholar]
- 21.Grissom WA, Yip CY, Zhang Z, Stenger VA, Fessler JA, Noll DC. A spatial domain method for the design of RF pulses in multi-coil parallel excitation. Magn Reson Med. 2006;56(3):620–9. doi: 10.1002/mrm.20978. [DOI] [PubMed] [Google Scholar]
- 22.Meyer CH, Pauly JM, Macovski A, Nishimura DG. Simultaneous spatial and spectral selective excitation. Magn Reson Med. 1990;15(2):287–304. doi: 10.1002/mrm.1910150211. [DOI] [PubMed] [Google Scholar]
- 23.Haacke EM, Brown RW, Venkatesan R, Thompson MR. Magnetic resonance imaging: physical principles and sequence design. Wiley-Liss; 1999. [Google Scholar]
- 24.Pauly JM, Nishimura DG, Macovski A. A k-space analysis of small-tip-angle excitation. J Magn Reson. 1989;81:43–56. doi: 10.1016/j.jmr.2011.08.008. [DOI] [PubMed] [Google Scholar]
- 25.Yip CY, Fessler JA, Noll DC. Iterative RF pulse design for multi-dimensional, small-tip-angle selective excitation. Magn Reson Med. 2005;54(4):908–917. doi: 10.1002/mrm.20631. [DOI] [PubMed] [Google Scholar]
- 26.Sutton BP, Noll DC, Fessler JA. Fast, iterative image reconstruction for MRI in the presence of field inhomogeneities. IEEE Trans Med Imag. 2003;22(2):178–188. doi: 10.1109/tmi.2002.808360. [DOI] [PubMed] [Google Scholar]
- 27.Fessler JA, Sutton BP. Nonuniform fast Fourier transforms using min-max interpolation. IEEE Trans Signal Proc. 2003;51(2):560–574. [Google Scholar]
- 28.Noll DC, Meyer CH, Pauly JM, Nishimura DG, Macovski A. A homogeneity correction method for magnetic resonance imaging with time-varying gradients. IEEE Trans Med Imag. 1991;10(4):629–637. doi: 10.1109/42.108599. [DOI] [PubMed] [Google Scholar]
- 29.Fessler JA, Lee S, Olafsson VT, Shi HR, Noll DC. Toeplitz-based iterative image reconstruction for MRI with correction for magnetic field inhomogeneity. IEEE Trans Signal Proc. 2005;53(9):3393–3402. [Google Scholar]
- 30.Block W, Pauly J, Kerr A, Nishimura D. Consistent fat suppression with compensated spectral-spatial pulses. Magn Reson Med. 1997;38(2):198–206. doi: 10.1002/mrm.1910380207. [DOI] [PubMed] [Google Scholar]
- 31.Zur Y. Design of improved spectral-spatial pulses for routine clinical use. Magn Reson Med. 2000;43(3):410–420. doi: 10.1002/(sici)1522-2594(200003)43:3<410::aid-mrm13>3.0.co;2-3. [DOI] [PubMed] [Google Scholar]
- 32.Schneider E, Glover GH. Rapid in vivo proton shimming. Magn Reson Med. 1991;18:335–347. doi: 10.1002/mrm.1910180208. [DOI] [PubMed] [Google Scholar]


