Abstract
Direct detection of the rapid scan EPR signal with quadrature detection and without automatic frequency control provides both the absorption and dispersion components of the signal. The use of a cross-loop resonator results in similar signal-to-noise in the two channels. The dispersion signal can be converted to an equivalent absorption signal by means of Kramers-Kronig relations. The converted signal is added to the directly-measured absorption signal. Since the noise in the two channels is not correlated, this procedure increases the signal-to-noise ratio of the resultant absorption signal by up to a factor of √2. The utility of this method was demonstrated for 2D spectral-spatial imaging of a phantom containing 3 tubes of LiPc with different oxygen concentrations and therefore different linewidths.
Keywords: cross-loop resonator, dispersion, imaging, Kramers-Kronig relation, rapid-scan EPR
1. Introduction
Rapid scan EPR imaging combines the efficiency of pulse EPR and the simplicity of continuous wave (CW) excitation and detection [1]. It can be used to image samples with larger spectral widths than are accessible by pulsed EPR. It has been shown that the signal-to-noise ratio (SNR) of rapid scan spectra decreases linearly with magnetic gradient amplitude, unlike the quadratic dependence on gradient for CW spectra [2]. The weak dependence on gradient is highly advantageous for imaging.
Dispersion (Disp) and absorption (Abs) EPR signals are equivalent manifestation of electron paramagnetic resonance. These are the real and imaginary parts of the complex magnetic suseptibility. Despite their equivalence, relatively few experiments use the Disp signal [3–7]. One reason is that most CW EPR spectrometers use automatic frequency control, AFC, to lock the source frequency to the resonator frequency. Locking the frequency reduces signal distortion that results from frequency shifts due to changes in the resonator temperature, sample properties or position. Frequency locking is especially critical for in-vivo EPR studies, where an animal is breathing, its heart is beating, and the animal is moving [8]. The AFC must readjust the source frequency fast enough to follow these physiological processes. The Disp signal is the result of EPR-related changes of resonator frequency, so AFC stabilization suppresses it. Another problem with the Disp signal is that it is often nosier than the absorption signal, because the quadrature detection channel is more sensitive to phase noise. This problem can be alleviated by using a loop-gap resonator, in reflection mode, with a high filling factor and low resonator Q [4, 5] or by using of a bimodal resonator in transmission mode [9, 10]. With a loop gap resonator, noise in the dispersion signal is substantially reduced relative to a higher-Q resonator [4]. With a bimodal resonator, phase noise can be essentially eliminated, made lower than thermal and other system noise, for power levels normally encountered. Our 250 MHz rapid scan EPR spectrometer uses a cross-loop resonator [11], which has the advantage that the signal is isolated from the phase noise of the source [9]. Because of this isolation, the signal-to-noise of the dispersion and absorption channels are essentially identical at non-saturating power levels.
One advantage of the Disp signal is that it is not as easily power saturated as the Abs signal. Disp commonly is measured to investigate paramagnetic species with very long relaxation times, since Disp of such samples can be measured with significantly better signal-to-noise ratio [5, 6] than Abs. In the saturating non-linear regime the information contained in the Disp signal is different from that in the Abs signal absorption, which is exploited in saturation transfer EPR (STEPR). For example, the STEPR first harmonic out-of phase Disp is sensitive to slow motion of spin-labeled bio-molecules [3, 5].
In this paper the equivalence of information in the Abs and Disp signals in the non-saturating regime is exploited. With quadrature detection the in-phase and out-of-phase signals can be measured simultaneously. The phase is set such that the in-phase signal is the absorption and the out-of-phase signal is dispersion. The Abs and Disp signals are inter-convertible by means of Kramers-Kronig relations, KKR:
| (1) |
where Disp is the dispersion signal, is angular frequency, P designates the principal value of the integral, and AbsD is the absorption signal calculated from the dispersion signal. Addition of AbsD to the directly-measured Abs signal increases the SNR, by a factor of √2, provided that the noise in the two channels is uncorrelated. If the SNR in the Abs channel was adequate, combining the Abs and Disp signals could permit decreasing the number of scans, and the data acquisition time, by a factor of 2. Decreasing the time required for image acquisition would be a great advantage for in vivo imaging [12].
The feasibility of combining the Abs and Disp rapid scan signals is demonstrated in this paper. Engineering and data processing problems that had to be addressed in order to make Disp to Abs conversion efficient are: (i) dispersion phase noise, (ii) non-orthogonality of the quadrature detection channels, (iii) development of a computationally efficient conversion method, and (iv) baseline correction for the dispersion signal.
2. Experimental
2.1 Sample preparation
As a phantom to test the proposed method for imaging, an assembly of three tubes containing LiPc crystals and filled with N2/O2 gas mixtures at different proportions was used. The measured full widths at half height of the EPR signals in the tubes were 148, 49, and 169 mG, respectively. The sample preparation details are described elsewhere [13].
2.2 Spectroscopy
Rapid scan spectra were recorded on a 250 MHz spectrometer [2, 9] using a crossed-loop resonator, CLR, with 40db isolation between the two coils. Both resonators were carefully tuned to the same frequency and the frequency of the source was adjusted to match the resonator frequency. Spectra were collected with triangular scans and a constant scan rate of 21 kG/s [2]. The magnetic field gradient was varied from 70 mG/cm to 10 G/cm and sweep widths were varied to provide a set 18 of projections evenly spaced at angles between −85° and 85° in the spectral-spatial plane. The previously described rapid scan background removal procedure was used on both the Abs and Disp signals [14]. The rapid scan spectra were deconvolved to obtain the equivalent slow scan spectra [2].
3. Instrumental Consideration
3.1 AFC
As discussed in the introduction, AFC may distort or even completely eliminate the Disp signal. Rapid Scan EPR without AFC is facilitated by the fact that it takes 3–5 orders of magnitude less time for each rapid scan sweep than for a conventional CW spectrum. This means that since the resonator frequency does not change significantly on the time scale of hundreds of µsec and for a cross loop resonator critical coupling is not necessary, AFC is not needed. The spectra shown in this paper were recorded without AFC.
3.2 Phase noise
If a reflection resonator is used, the Disp signal is nosier than the Abs spectrum [4–6], because of phase noise. Variation of the source frequency changes the matching between the resonator and the source through a transmission line. It results in back-reflection of a portion of the source power. Random frequency variation produces reflections with random intensity, which is noise. Although phase noise affects both absorption and dispersion signals, the former is less contaminated because the quadrature component of the reflected power is larger than the in-phase component. Even the best RF source has some phase noise. The difference in noise between two quadrature channels increases as the resonator Q, increases.
The goal of this paper is to combine two quadrature signals by KKR to improve SNR (see Eq. (1)). In the optimum case where the SNR of the Abs and Disp signals is equal, the improvement in SNR is √2. To determine how the improvement in SNR varies with the SNR in the two signals, consider signals with amplitudes A1 and A2 contaminated with white Gaussian noise with standard deviations n1 and n2. For the first signal SNR1 = A1/n1 and for the second SNR2 = A2/n2. Summation of the two signals gives a new one with:
| (2) |
where λ is the weighting factor for the second signal. The λ that maximizes SNRλ is given by Eq. (3).
| (3) |
For the specific case discussed in this paper Abs and AbsD have equal intensities so and Eq. (2) simplifies to:
| (4) |
If the first signal has a higher noise level than the second, λ≥1. Improvement in SNR with respect to the least noisy signal can be expressed as the ratio:
| (5) |
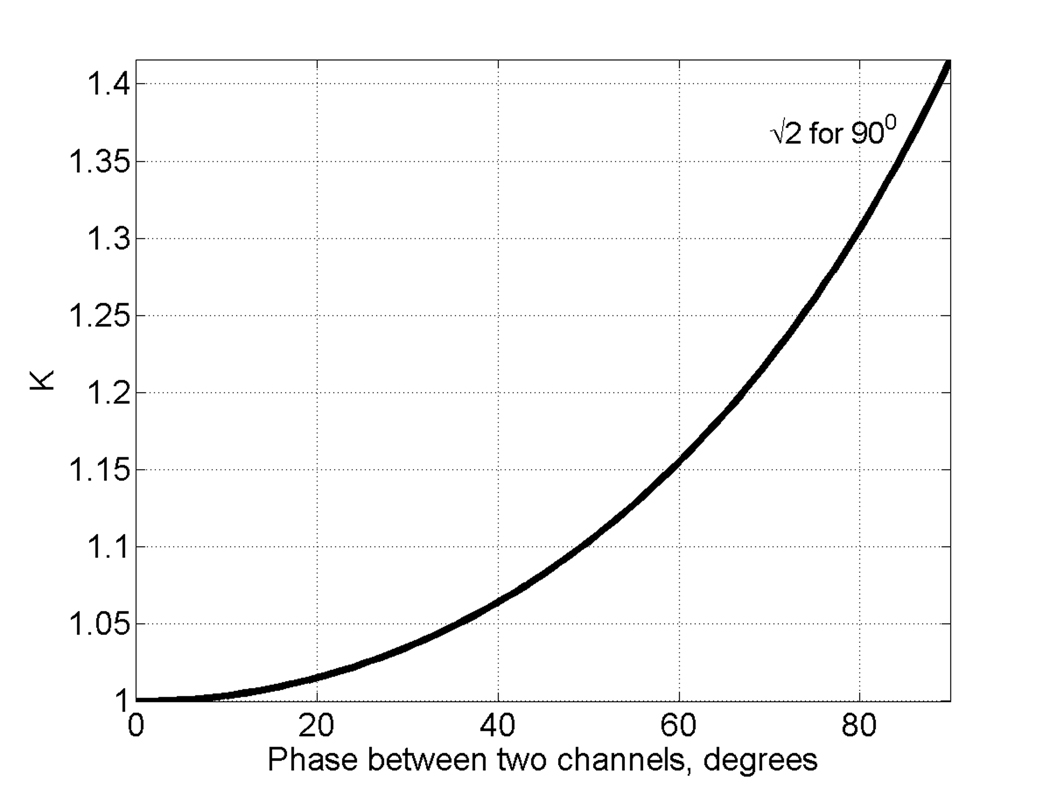
Since the KKR does not change SNR, the parameter K gives an estimate of the improvement in SNR that can be obtained by combining dispersion and absorption EPR signals. It varies from √2 (the best case) to 1 (the worst case) depending on the difference in noise levels for the two signals.
Because of the use of the CLR the source phase noise had minimal impact on the SNR of either the Abs or Disp channels [10] so SNR1 ~ SNR2 and λ = 1 was used in the data analysis.
3.3 Non-orthogonality of quadrature channels
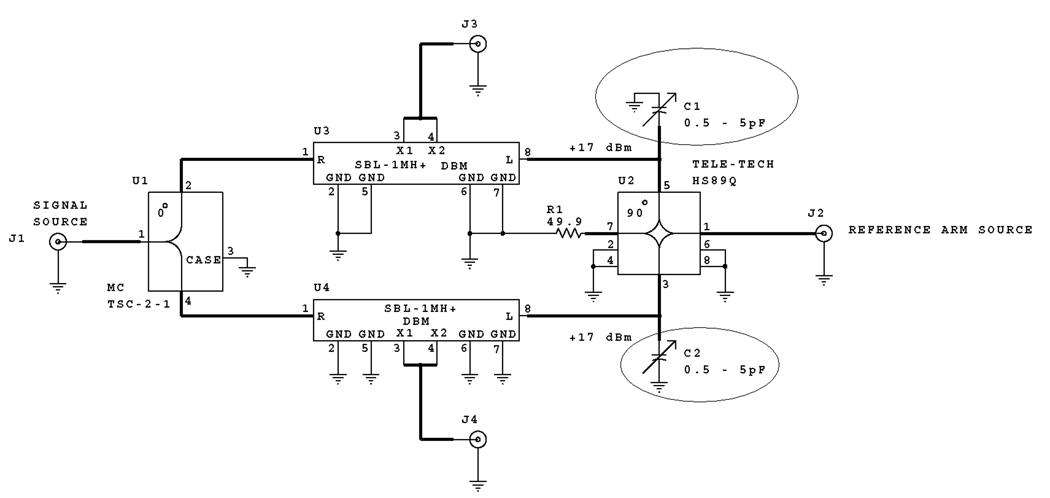
If the two quadrature detection channels are exactly orthogonal, Abs and AbsD have equal amplitudes, even if the phase is not set to have pure Abs and Disp in the two channels. Initially, Abs and AbsD signals measured with our locally designed and built 250MHz spectrometer [15] had different amplitudes. Careful analysis of the electrical circuit responsible for phase-sensitive detection (see Fig.1) revealed that the 90° splitter (right hand side of Fig. 1) caused the problem. It split the reference signal into two parts that were not strictly orthogonal. This meant that if a pure absorption signal was detected in channel 1, channel 2 would have a dispersion signal with an admixture of absorption. It is still possible to convert this mixture into a pure absorption signal that would coincide with the one in channel 1. However, the efficiency of the procedure would suffer. Noise in the two channels would be partially coherent, so the improvement factor K would be less than √2. Figure 2 demonstrates the dependence of K on the phase difference between the two channels. To solve the non-orthogonality problem, two trimmer capacitors, C1 and C2 (marked with arrows in Fig. 1), were added to the circuit and adjusted to restore orthogonality.
Fig. 1.
Schematic for the phase sensitive detection circuit. The trimmer capacitors that were added to make two quadrature channels orthogonal are circled.
Fig. 2.
SNR improvement factor K as a function of the phase difference between the two channels.
4. Data processing
4.1 Numerical Kramers-Kronig transformation
Kramers-Kronig transformation (see Eq.(1)) can be done by either numerical integration in the time domain or by successive double Fourier transformation [16]. The disadvantages of numerical time-domain integration are the problem with a pole at ω' = ω and relatively long computation time. The Fourier transformation approach as described in ref. [17] was used in this paper because it is simpler and faster although it may not be as accurate as numerical integration. Both simulations and experiments showed that AbsD calculated from Disp was in good agreement with experimental Abs spectra.
4.2 Base line correction for dispersion
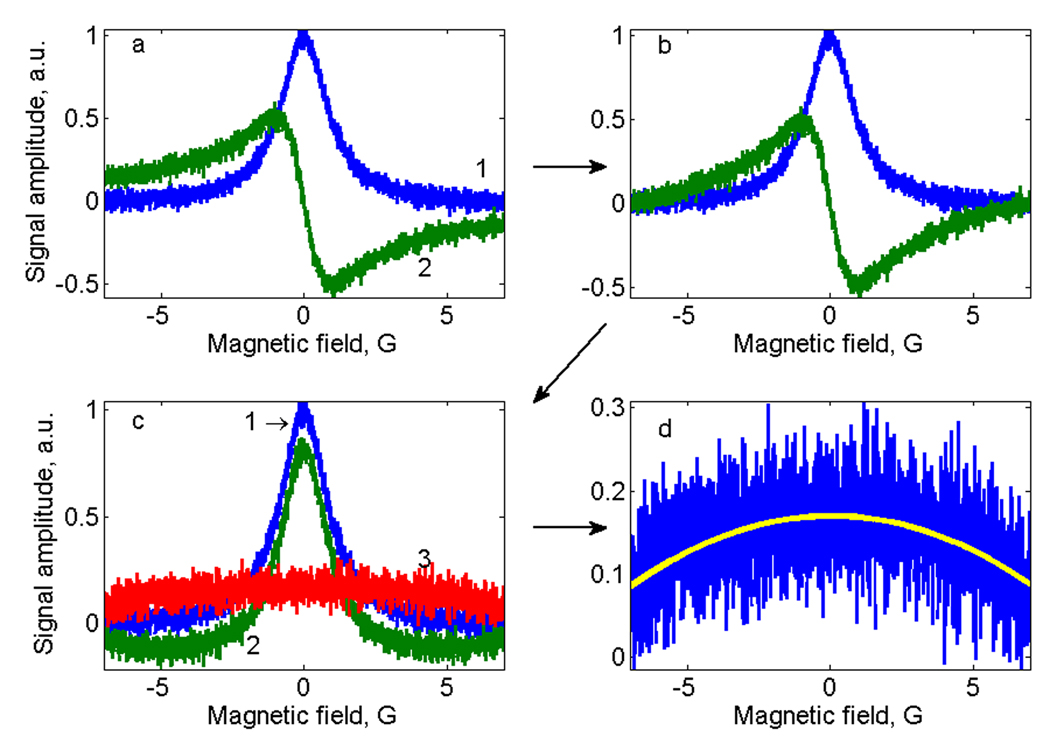
The Disp signal approaches the baseline more slowly than the Abs signals (see Fig.3a), which causes the following problems for conversion of Disp to AbsD using KKR: (i) conversion of a truncated Disp may result in distortions, (ii) Fourier transformation of a function with abrupt, step-like behavior at the edges of the Disp signal results in high frequency oscillations, and (iii) baseline correction for Disp is a difficult task. In principle, the first two problems can be solved by filtering, extrapolation, and other post-processing techniques. The third one is more challenging. It is often the case that an experimental EPR spectrum contains a sloping baseline. Based on the assumption that the absorption signal is zero at the beginning and end of the scan, the baseline is calculated as a sloping line between the first and last points. Typically, this method can’t be used to correct the Disp signal. Even if the scan is wide enough that there is baseline at both extremes of the Abs signal, there may not be baseline at the extremes of the Disp signal. A truncated Disp signal starts and ends with unknown values, which can look like a baseline slope. This background component would be converted by KKR together with the dispersion signal to become a background signal with a different shape for an absorption signal (AbsD). A possible but not practical solution to this problem could be increasing the magnetic field sweep, which would increase the experimental time.
Fig. 3.
Algorithm for baseline correction for the dispersion signal. A ramp is subtracted from the Dispersion signal (a, trace 2) so that it starts and end with zero (b). After KKR transformation the baseline for the AbsD signal is distorted (c, trace 2). The difference signal Abs-AbsD (c, trace 3) is the baseline distortion (d) which is fitted with 2nd order polynomial curve that is subtracted from the AbsD signal.
An algorithm (illustrated in Fig. 3) was developed that solves this problem without requiring a change in data acquisition parameters. It is based on analysis of the discrepancy between Abs and AbsD. In the first step (Fig.3b) a sloping line is subtracted from the dispersion signal so that it starts and ends at zero. Although this 'tilts' the signal, it solves the problem with Fourier transformation of a signal with abrupt changes. The KKR transformation is then applied to the modified dispersion signal to obtain absorption signal AbsD’, which contains a background component that is the KKR transform of the slope (Fig.3c). The difference between Abs and AbsD', shown is Fig.3d, is the background signal plus noise. It can be accurately fitted with a 2nd order polynomial curve that is then subtracted from AbsD' to give AbsD. Abs and AbsD are then summed.
5. Results
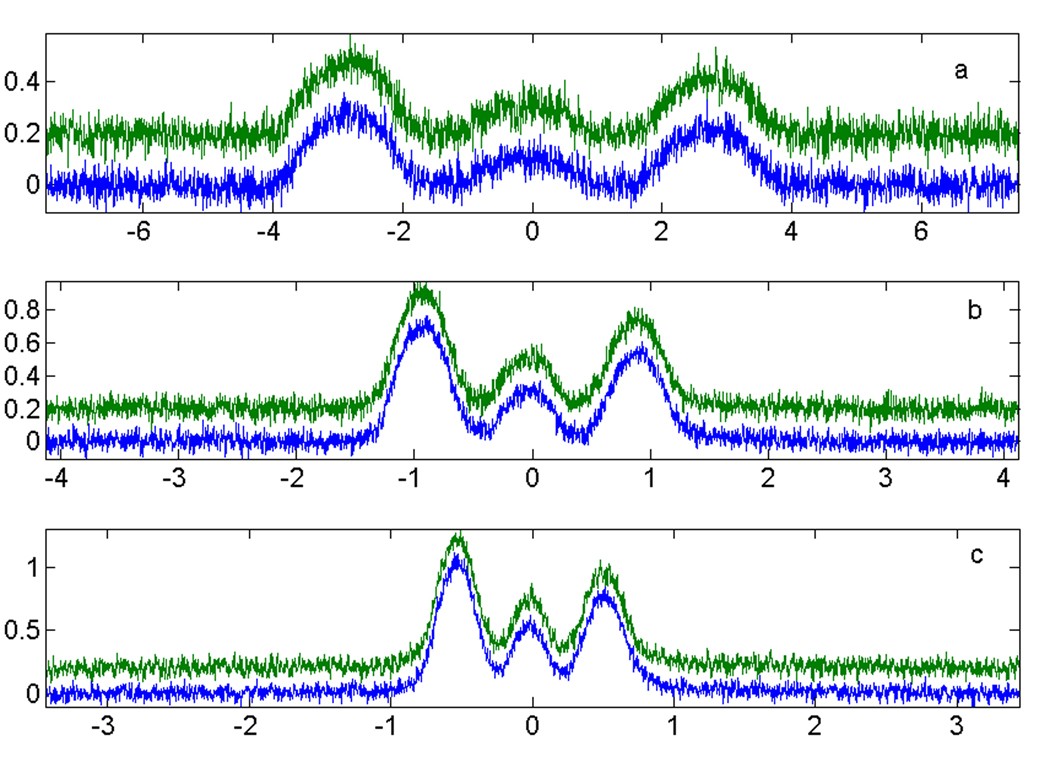
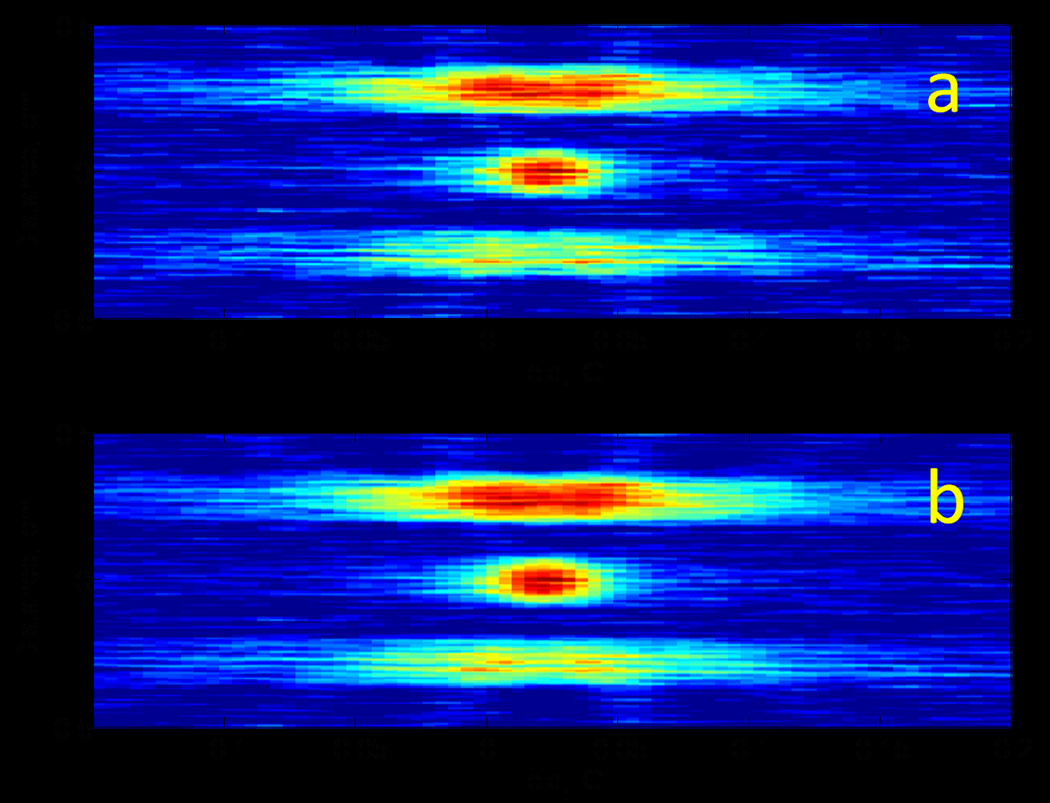
To test the suggested method a rapid scan imaging experiment was done. Eighteen rapid scan spectra were collected in quadrature. The Disp signals were converted to AbsD signals using the method described above. There was good agreement between Abs and AbsD projections as shown in Fig. 4 for three magnetic gradients. 2D spatial-spectral images were reconstructed by filtered backprojection from the Abs projections (Fig. 5a) and projections obtained by summation of the Abs and AbsD projections (Fig. 5b). The positions of the three tubes of the phantom are in good agreement with the known geometry. The SNR is better in the image obtained from the combined projections. Each spectral profile in the 2D images shown in Fig.5 was fitted to a Lorenzian function to determine the amplitude and the linewidth of the signal. The linewidths and signal amplitudes as a function of position in the sample are shown in Fig.6. The standard deviations of the linewidths were calculated for three tubes in the phantom. The values shown in the upper part of the figure demonstrate improvement in accuracy with which EPR linewidths (oxygen concentrations) can be measured if dispersion signals are exploited. The average improvement in Standard Deviation is 35%.
Fig. 4.
Comparison at three magnetic field gradients of Abs (blue, lower traces) with AbsD (green, lower traces) obtained by KKR transformation and the baseline correction as described in Fig. 3.
Fig. 5.
Comparison of (a) image reconstructed from Abs projections and (b) image reconstructed from projections obtained by summations of Abs and AbsD projections.
Fig. 6.
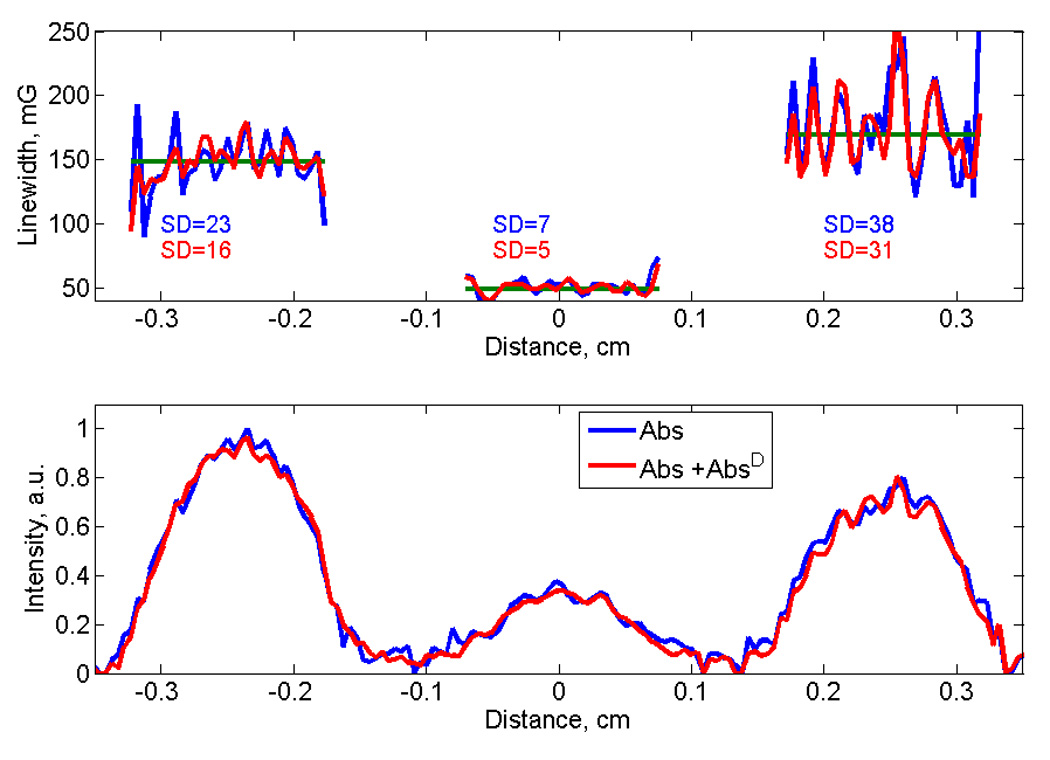
Comparison of linewidths and spatial distribution of signal obtained from the image calculated only from Abs projections (blue) and from the Abs + AbsD projections (red).
6. Discussion
Distortion of the Disp signal by the AFC was avoided in this study by not using the AFC. For in-vivo applications this may not be an option. One possible solution to this problem would be using an AFC that responds to resonator change slowly enough that it does not distort the dispersion component of the EPR signal [4]. This would allow measuring the Disp signal while also locking the source frequency to the resonator frequency. However, this approach would distort the EPR spectra if the AFC is too slow with respect to physiological changes in the sample. The problem of resonator frequency variation might be partially solved by utilization of a transmission resonator instead of a reflection resonator because the requirement that a reflection resonator must be critically coupled makes it more sensitive to frequency mismatch between the resonator and the source. Since the source frequency is much more stable than the resonator frequency, especially for in vivo applications, it has been suggested that an AFC system that corrects the resonator frequency to match the source frequency might be a useful approach. This might be possible for a reflection resonator using a varactor device, but there are substantial engineering problems anticipated with this approach.
Acknowledgements
This work was supported by NIH NIBIB grant EB000557 (GRE and SSE), by Russian Science Support Foundation grants 06-03-32175, 04-03-97514, by the Program “Leading Scientific Schools” NSh 6213.2006.2, by the CRDF grant (BRHE program) (MT), and the Center for EPR Imaging in Vivo Physiology supported by NIH NIBIB P41 EB002034 (Howard Halpern, PI).
Footnotes
Publisher's Disclaimer: This is a PDF file of an unedited manuscript that has been accepted for publication. As a service to our customers we are providing this early version of the manuscript. The manuscript will undergo copyediting, typesetting, and review of the resulting proof before it is published in its final citable form. Please note that during the production process errors may be discovered which could affect the content, and all legal disclaimers that apply to the journal pertain.
References
- 1.Stoner JW, Szymanski D, Eaton SS, Quine RW, Rinard GA, Eaton GR. Direct-Detected Rapid-Scan EPR at 250 MHz. J. Magn. Res. 2004;170:127–135. doi: 10.1016/j.jmr.2004.06.008. [DOI] [PubMed] [Google Scholar]
- 2.Joshi JP, Ballard JR, Rinard GA, Quine RW, Eaton GR. Rapid-Scan EPR with Triangular Scans and Fourier Deconvolution to Recover the Slow-Scan Spectrum. J. Magn. Reson. 2005;175:44–51. doi: 10.1016/j.jmr.2005.03.013. [DOI] [PubMed] [Google Scholar]
- 3.Fajer P, Marsh D. Analysis of Dispersion-Mode Saturation Transfer ESR Spectra. Application Of Model Membranes. J. Magn. Reson. 1983;55:205–215. [Google Scholar]
- 4.Hyde JS, Froncisz W, Kusumi A. Dispersion Electron Spin Resonance with the Loop Gap Resonator. Rev. Sci. Instrum. 1982;53:1934–1937. [Google Scholar]
- 5.Thomas DD, Wendt CH, Froncisz W, Hyde JS. Saturation Transfer EPR Spectroscopy on Spin-Labeled Muscle Fibers Using a Loop-Gap Resonator. Biophys. J. 1983;43:131–135. doi: 10.1016/S0006-3495(83)84332-X. [DOI] [PMC free article] [PubMed] [Google Scholar]
- 6.Rinard GA, Quine RW, Ghim BT, Eaton SS, Eaton GR. Dispersion and Superheterodyne EPR Using a Bimodal Resonator. J. Magn. Reson. A. 1996;122:58–63. [Google Scholar]
- 7.Klug CS, Camenisch TG, Hubbell WL, Hyde JS. Multiquantum EPR Spectroscopy of Spin-Labeled Arrestin K267c at 35 Ghz. Biophys. J. 2005;88:3641–3647. doi: 10.1529/biophysj.104.054924. [DOI] [PMC free article] [PubMed] [Google Scholar]
- 8.Swartz HM, Berliner LJ. Introduction to in Vivo EPR. Biol. Magn. Reson. 2003;18:1–20. [Google Scholar]
- 9.Rinard GA, Quine RW, Eaton GR, Eaton SS. 250 MHz Crossed Loop Resonator for Pulsed Electron Paramagnetic Resonance. Magn. Reson. Engineer. 2002;15:37–46. [Google Scholar]
- 10.Rinard GA, Quine RW, Eaton GR. An L-Band Crossed-Loop (Bimodal) EPR Resonator. J. Magn. Reson. 2000;144:85–88. doi: 10.1006/jmre.2000.2014. [DOI] [PubMed] [Google Scholar]
- 11.Quine RW, Rinard GA, Eaton SS, Eaton GR. A Pulsed and Continuous Wave 250 MHz Electron Paramagnetic Resonance Spectrometer. Magn. Reson. Engineer. 2002;15:59–91. [Google Scholar]
- 12.Berliner LJ. In Vivo Epr (Esr): Theory and Application. New York: Kluwer Academic; 2003. [Google Scholar]
- 13.Tseitlin M, Czechowski T, Eaton SS, Eaton GR. Regularized Optimization (RO) Reconstruction for Oximetric Epr Imaging. J. Magn. Reson. 2008;194:212–221. doi: 10.1016/j.jmr.2008.07.002. [DOI] [PMC free article] [PubMed] [Google Scholar]
- 14.Tseitlin M, Czechowski T, Quine RW, Eaton SS, Eaton GR. Background Removal Procedure for Rapid Scan EPR. J. Magn. Reson. 2009;196:48–53. doi: 10.1016/j.jmr.2008.10.012. [DOI] [PMC free article] [PubMed] [Google Scholar]
- 15.Quine RW, Eaton SS, Eaton GR. Pulsed Saturation Recovery 250 MHz Electron Paramagnetic Resonance Spectrometer. Conc. Magn. Reson. B (Magn. Reson. Engin.) 2005;26B:23–17. doi: 10.1002/cmr.b.21384. [DOI] [PMC free article] [PubMed] [Google Scholar]
- 16.Ohta K, Ishida H. Comparison among Several Numerical Integration Methods for Kramers-Kronig Transformation. Appl. Spectros. 1988;42:952–957. [Google Scholar]
- 17.Aminov LK, Tseitlin MP, Salikhov KM. 1-D EPR Imaging of Conducting and Loss-Dielectric Samples. Appl. Magn. Reson. 1999;16:341–362. [Google Scholar]


