

Abstract
Aberrant methylation of CpG islands in promoter regions of tumor suppressor genes (TSG) has been demonstrated in epithelial origin tumors. However, the methylation profiling of tumor-related gene promoter regions in cutaneous melanoma tumors has not been reported. Seven known or candidate TSGs that are frequently hyper-methylated in carcinomas were assessed by methylation-specific polymerase chain reaction (MSP) in 15 melanoma cell lines and 130 cutaneous melanoma tumors. Four TSGs were frequently hypermethylated in 86 metastatic tumor specimens: retinoic acid receptor-β2 (RAR-β2) (70%), RAS association domain family protein 1A (RASSF1A) (57%), and O6-methylguanine DNA methy-latransferase (MGMT) (34%), and death-associated protein kinase (DAPK) (19%). Hypermethylation of MGMT, RASSF1A, and DAPK was significantly lower in primary melanomas (n = 20) compared to metastatic melanomas. However, hypermethylation of RAR-β2 was 70% in both primary and metastatic melanomas. Cell lines had hypermethylation profiles similar to those of metastatic melanomas. The analysis of these four markers of metastatic tumors demonstrated that 97% had ≥1 gene(s) and 59% had ≥2 genes hypermethylated. The methylation of genes was verified by bisulfite sequencing. The mRNA transcripts could be re-expressed in melanoma cell lines having hypermethylated genes following treatment with 5′-aza 2′-deoxycytidine (5Aza-dC). Analysis of melanoma patients’ plasma (preoperative blood; n = 31) demonstrated circulating hypermethylated MGMT, RAR-β2, and RASSF1A DNA for at least one of the markers in 29% of the patients. Our findings indicate that the incidence of TSG hypermethylation increases during tumor progression. Methylation of TSG may play a significant role in cutaneous melanoma progression.
Keywords: MGMT, RAR-β2, RASSF1A, methylation, melanoma
Introduction
Epigenetic events in the form of hypermethylation of tumor suppressor genes (TSG) promoter region(s) CpG islands can play a role in the development and progression of various cancers (Baylin and Herman, 2000; Esteller et al., 2001; Jones and Baylin, 2002; Sidransky, 2002). The detection of hypermethylated genes in tumors has become important in assessing the mechanisms of known and candidate TSG inactivation. Genes can be transcriptionally silenced when their promoter region(s) CpG islands are hypermethylated (Jones and Baylin, 2002). Recent studies have shown that this is a significant mechanism whereby TSG expression is shut off in cancer cells (Baylin and Herman, 2000; Esteller et al., 2001; Jones and Baylin, 2002; Sidransky, 2002). The hypermethylation status of several known or candidate TSG promoter regions has been profiled for a number of cancers (Jeronimo et al., 2001; Lo et al., 2001; Rosas et al., 2001; Esteller and Herman, 2002; Jones and Baylin, 2002; Pfeifer et al., 2002; Widschwendter and Jones, 2002; Harden et al., 2003; Toyooka et al., 2003). This epigenetic regulation of TSG can provide a selective advantage for cells undergoing transformation or progressing to a more malignant phenotype. In the past, considerable effort was devoted to correlating known or candidate TSG deletions and mutations to phenotypic properties. Recent studies have indicated that inactivation of specific TSGs significantly influences tumor promotion and progression in carcinomas (Jeronimo et al., 2001; Lo et al., 2001; Rosas et al., 2001; Jones and Baylin, 2002; Widschwendter and Jones, 2002; Harden et al., 2003; Toyooka et al., 2003).
Most studies on hypermethylation of gene promoter regions have focused on carcinomas; no major study has addressed hypermethylation of TSG in cutaneous melanomas. The genetic mechanisms involved in melanoma tumor progression are poorly understood. BRAF mutation V599 (Davies et al., 2002) and 9p21 region chromosome deletions (Fujiwara et al., 1999) are the major genetic aberrations frequently (>40%) found so far in sporadic primary or metastatic cutaneous melanomas. The frequency of other tumor-related gene mutations or deletions is less than 25% in melanomas. This suggests that there are potential genetic aberrations that have yet to be identified. We recently reported on the frequent hypermethylation (>40%) of RAS association domain family protein 1A (RASSF1A) in melanoma cell lines and frozen metastatic melanoma specimens (Spugnardi et al., 2003). Although its function remains uncertain, RASSF1A is considered a strong candidate as a TSG.
To date, there has been no major study profiling hypermethylation of known or potential TSGs of cutaneous melanomas. We assessed the hypermethylation status of several known or candidate TSG promoter regions in melanoma cell lines and in frozen and paraffin-embedded melanoma tissues. Several major TSG were frequently hypermethylated in primary tumors and more so in metastatic tumors. Some prominently methylated genes in carcinomas were infrequently methylated in melanomas.
Tumor-related DNA circulates in the serum/plasma of patients with melanoma and other types of tumors (Fujiwara et al., 1999; Johnson and Lo, 2002; Sidransky, 2002; Usadel et al., 2002). Studies in melanoma patients have shown that specific microsatellites with loss of heterozygosity (LOH) on different chromosomes are frequent with disease progression (Fujiwara et al., 1999). Recent studies have shown that hypermethylated tumorrelated DNA can be detected circulating in blood (Sidransky, 2002; Usadel et al., 2002). We examined the feasibility of detecting hypermethylated TSG in the plasma of melanoma patients. Circulating DNA of three hypermethylated genes was demonstrated in the plasma of melanoma patients.
Results
Methylation profiling of melanoma cell lines
Initially, seven known or candidate TSG were assessed for aberrant methylation of CpG promoter regions in melanoma cell lines. Methylation status was analysed using methylation-specific polymerase chain reaction (MSP) and assessed by gel electrophoresis initially to verify specific PCR products (data not shown). The assay was converted for automated CAE analysis that provided a more objective detection system for methylation status, allowing both methylated and unmethylated MSP products to be assessed simultaneously in the same analysis. A comparison of CAE versus gel electrophoresis demonstrated >95% concordance of results. All subsequent tissue analyses were performed by CAE. The frequency of promoter hypermethylation in the genes DAPK, GSTP1, MGMT, p16INK4a, RAR-β2, RASS-F1A, and TIMP-3 was assessed by MSP in 15 established melanoma cell lines. The most frequently hypermethylated gene was RASSF1A followed by RAR-β2 and MGMT (Table 1). Overall, 14 (93%) of the cell lines were hypermethylated for one or more of the seven genes. Eight (53%) cell lines had two or more hypermethylated genes, and two (13%) cell lines had three hypermethylated genes [in MeM already]. Under the conditions used, normal (histopathology tumor negative) frozen lymph nodes (n = 10) and healthy donor PBLs did not show methylation for any gene except DAPK, which was positive in PBLs from two healthy donors.
Table 1.
Methylation of gene promoter CpG islands in melanoma cell lines
| Melanoma cell lines | RAR-β2 | RASSF1A | MGMT | DAPK | GSTP1 | TIMP3 | p16INK4a |
|---|---|---|---|---|---|---|---|
| MA | − | + | − | − | − | − | − |
| MB | − | − | − | − | − | − | − |
| MC | − | + | − | − | − | − | − |
| MD | + | − | + | − | − | − | − |
| ME | + | + | − | − | − | − | − |
| MF | − | + | − | − | − | − | − |
| MG | − | + | − | − | − | − | − |
| MH | + | + | + | − | − | − | − |
| MI | + | + | − | − | − | − | − |
| MJ | + | + | − | − | − | − | − |
| MK | + | + | + | − | − | − | − |
| ML | + | − | − | − | − | − | − |
| MM | + | + | − | − | − | − | − |
| MN | − | + | − | − | − | − | − |
| MO | − | + | + | − | − | − | − |
| Total | 8/15 (53%) | 12/15 (80%) | 4/15 (27%) | 0/15 (0%) | 0/15 (0%) | 0/15 (0%) | 0/15 (0%) |
Methylation profiling of melanoma tumors
We next assessed 53 frozen metastatic melanoma tumor tissues obtained from 44 AJCC stage III/IV melanoma patients (Figure 1, Table 2). Hypermethylation was detected in one or more genes of 51 (96%) tumors, two or more genes of 34 (64%) tumors, and three or more genes of 13 (25%) tumors (Table 3). The four most frequently hypermethylated genes were RAR-β2, RASS-F1A, MGMT, and DAPK, respectively (Table 2). The other three genes were hypermethylated in less than 10% of the tumors.
Figure 1.

Representative examples of paired frozen and paraffin-embedded tumors analysed by CAE for determining methylation status of (a) RAR-β2, (b) MGMT, and (c) RASSF1A. Methylated (M) and unmethylated (U) PCR products from frozen (F1) or paraffin-embedded (P1) tumor specimens were analysed simultaneously and were distinguished by size and fluorescence. Representative examples of tumor histopathology negative patients’ paraffin-embedded lymph nodes (PLN) analysed by CAE for determining methylation status of (d) RAR-β2, (e) MGMT, and (f) RASSF1A
Table 2.
Detection of hypermethylated genes in melanoma tumors
| MGMT | RAR-β2 | RASSF1A | DAPK | |
|---|---|---|---|---|
| Primary tumors | ||||
| Paraffin n=20 | 2 (10) | 14 (70) | 3 (15) | 0 (0) |
| Metastatic tumors | ||||
| Frozen n=53 | 20 (38) | 38 (72) | 31 (58) | 13 (25) |
| Paraffin n=33 | 9 (27) | 22 (67) | 18 (55) | 3 (9) |
| Total n=86 | 29 (34) | 60 (70) | 49 (57) | 16 (19) |
() percentage.
Table 3.
Frequency of hypermethylated genes in melanoma tumors
| Primary tumors | Genesa | Frozen n=0 | Paraffin n=20 | Total |
|---|---|---|---|---|
| N=20 | 0 | N/A | 5 (25) | 5 (25) |
| ≥1 | N/A | 15 (75) | 15 (75) | |
| ≥2 | N/A | 4 (20) | 4 (20) | |
| ≥3 | N/A | 0 (0) | 0 (0) |
| Metastatic tumors | Genesa | Frozen n=53 | Paraffin n=33 | Total |
|---|---|---|---|---|
| N=86 | 0 | 2 (4) | 1 (3) | 3 (3) |
| ≥1 | 51 (96) | 32 (97) | 83 (97) | |
| ≥2 | 34 (64) | 17 (52) | 51 (59) | |
| ≥3 | 13 (25) | 3 (11) | 16 (19) | |
| 4 | 4 (8) | 0 (0) | 4 (5) |
() percentage.
Genes assessed were: RAR-β2, MGMT, DAPK, and RASSF1A.
As molecular assessment of frozen tumor tissues is hampered by availability, size of lesion surgically removed, logistics of tissue procurement, not knowing the level of contamination with hemopoietic cell infiltrates and normal cells, the MSP assay was adapted for analysis of paraffin-embedded tumor tissue. We focused on the four genes most frequently hypermethylated in frozen melanomas: RAR-β2, RASSF1A, MGMT, and DAPK. We initially assessed 11 paired frozen and paraffin-embedded melanomas to verify that the sensitivity of the assay was equivalent for both types of tissues. There was 100% concordance for all four markers between frozen and paraffin-embedded melanomas (data not shown).
Primary melanomas were assessed only from paraffin-embedded tissues as opposed to fresh frozen tissues due to the lesion size, and logistics in procurement for pathology analysis. Paraffin-embedded primary melanomas (n = 20) and metastatic melanomas (n = 33) were assessed (Figure 1, Table 2). The most frequently hypermethylated genes for primary tumors were RAR-β2, RASSF1A, and MGMT, respectively. Surprisingly, RAR-β2 was hypermethylated in 70% of the primary tumors. In all, 15 (75%) tumors had one or more genes methylated, and only four (20%) had two or more genes methylated. Of the metastatic tumors, 32 (97%) had one or more genes methylated, and 17 (52%) had two or more genes methylated (Table 3). Overall, metastatic tumors had a higher frequency of hypermethylated genes. Paraffin-embedded histopathology tumor-negative lymph nodes (n = 12) were negative for hypermethylation of RAR-β2, RASSF1A, and MGMT (Figure 1). Analysis of the combination of metastatic (frozen and paraffin-embedded) melanoma tumors (n = 86) is shown in Table 3. There was no significant association of hypermethylation between any individual genes, nor was gene hypermethylation correlated with disease outcomes. However, RAR-β2 significantly (P = 0.009) correlated with primary tumor Breslow thickness. This correlation is important in that Breslow thickness is a major prognostic factor in early-stage melanoma patients with localized disease.
Gene re-expression by demethylation
The expression of MGMT, RASSF1A, and RAR-β2 was assessed in eight melanoma cell lines by reverse transcriptase–polymerase chain reaction (RT–PCR) (data not shown). No gene transcripts were detected in cell lines exhibiting hypermethylation. Gene expression was detected in the nonmethylated cell lines and in some partially hypermethylated cell lines.
Melanoma cell lines that were hypermethylated were treated with the DNA methylation inhibitor 5Aza-dC to reverse epigenetic transcriptional silencing caused by methylation (16). Melanoma cell lines were treated with 0, 3, and 5 μM of 5Aza-dC for 4 days. Treatment with 5Aza-dC induced significant elevated gene expression in all methylated cell lines, of which mRNA expression was absent or very minimal prior to drug treatment (Figure 2). Melanoma cell lines exhibiting no hypermethylation of the gene promoter region for MGMT and RASSF1A demonstrated significant elevated mRNA levels. For assessment of hypermethylated RAR-β2 in cell lines, cells were treated with 5Aza-dC for 4 days followed by treatment with 1 μM ATRA for 24 h. Methylation was reversed in all treated cell lines and RAR-β2 mRNA expression elevation was detected. Cell lines demonstrating hypermethylation by MSP showed no mRNA expression. For some of the genes in the cell lines, there were moderate to low levels of hypermethylated product produced by MSP with minimal gene expression before drug treatment. Gene expression was significantly elevated in all cell lines after drug treatment. These in in vitro studies are suggestive that hypermethylation of the promoter region of the genes assessed is an active mechanism of silencing gene expression.
Figure 2.
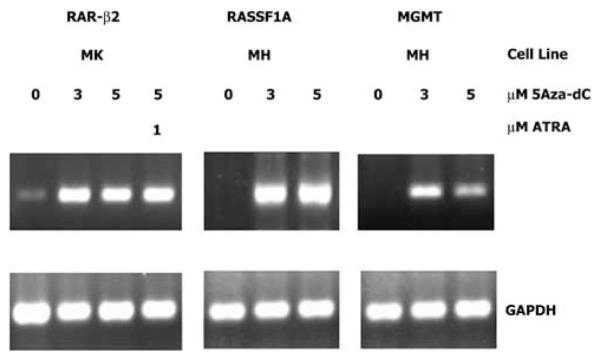
Representative expression and re-expression of RAR-β2, RASSF1A, and MGMT in two melanoma cell lines treated with 5Aza-dC. The cells were treated for 4 days with different concentrations of 5Aza-dC followed by 24 h treatment with ATRA where indicated. Gene expression was analysed by RT–PCR. The housekeeping gene GAPDH was included as an RT–PCR control for all assays
Bisulfite sequencing was carried out on multiple cell lines to confirm the methylation status of MGMT, RASSF1A, and RAR-β2 CpG island promoter regions and confirm the MSP results. Representative examples of sequencing are shown in Figure 3. Sequencing and MSP of individual gene hypermethylation were concordant.
Figure 3.
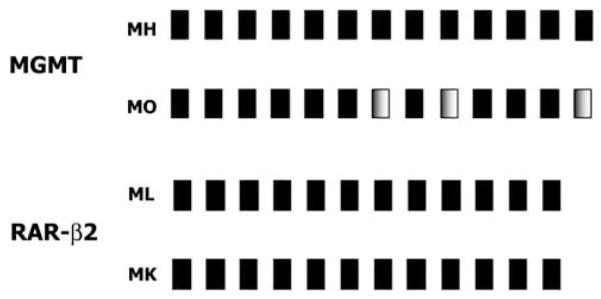
Representative PCR analysis of promoter region CpG island sequence of MGMT and RAR-β2 from bisulfite-treated DNA obtained from melanoma cell lines. Fully methylated CpGs are indicated as solid black boxes and partially methylated CpGs are shown as shaded boxes. All CpGs contained in the MSP products are shown
Analysis of circulating methylated DNA in plasma
We examined the presence of methylated DNA circulating in the plasma of melanoma patients using real-time PCR. A real-time MSP assay was developed for the detection of methylated DNA in the plasma because the level of DNA is significantly lower in the plasma than in the tissues. An assay using a reference gene (MYOD1) and standard curves for individual markers was developed to assess real-time MSP results. The average DNA recovered from normal donor controls was 18.15 ng DNA/500 μl (range 5.31–42.92) and from melanoma patients 29.24 ng DNA/500 μl (range 9.97–166.87). In this study, we assessed RAR-β2, RASSF1A, and MGMT, the three genes most frequently hypermethylated in tumors. A total of 31 AJCC stage III/IV patients in whom we had paired plasma and melanoma tumor tissues comprised the study group. Selection was based on the availability of paired samples. Plasma was obtained from a preoperative blood specimen. The most frequently methylated gene in the plasma was RASS-F1A (n = 6; 19%) followed by MGMT (n = 6; 19%) and RAR-β2 (n = 4; 13%). Of the 31 patients, 29% had at least one gene hypermethylated and 16% of the patients had at least two genes hypermethylated in their plasma. Plasma from 33 healthy normal donors was negative for hypermethylation in all three genes. Analysis of methylation for MYOD1 gene was run on all samples for verification of modified DNA. Concordance of plasma gene hypermethylation status to respective paired tumors was as follows: MGMT (six of 17; 33%); RASSF1A (five of 20; 24%); and RAR-β2 (four of 20; 18%). This suggests that there may be degradation or limited release of these DNA markers. In two patients, hypermethylation of RASSF1A was absent in tumors, but was present in plasma. This may be due to other metastases not surgically excised or subclinical disease. These preliminary studies suggest that hypermethylated genes can be detected in acellular plasma of melanoma patients. Further detailed studies will validate the clinical utility of these DNA markers.
Discussion
Hypermethylation of gene promoter regions silences genes in many types of carcinomas. Profiling studies have shown gene hypermethylation frequency and specific genes for tumors of different histologic origins (Esteller et al., 2001; Maruyama et al., 2001; Pfeifer et al., 2002; Widschwendter and Jones, 2002; Chen et al., 2003; Toyooka et al., 2003). Patterns of gene hypermethylation in primary tumors versus metastases and their association with clinicopathological factors are not well described. However, there is a clear indication that hypermethylation of TSG promoter regions is a significant mechanism by which gene transcription is turned off in cancer cells. Studies of tumor cell lines may not be accurate as to the actual frequency of hypermethylation of gene promoter regions in tumor specimens (Ueki et al., 2000; Smiraglia et al., 2001; Paz et al., 2003). Hypermethylation of specific genes in cell lines may represent clonal selection during culture adaptation and passaging. Our major finding is that hypermethylation of promoter regions of known and candidate TSGs in melanomas is quite frequent. Hypermethylation of a gene can be potentially used as a surrogate of altered gene expression patterns to characterize phenotypic behavior.
At least one of seven genes was hypermethylated in 93% of cell lines, a frequency that suggests a relation between hypermethylation and melanoma progression. This study demonstrated that several frequently methylated TSGs in carcinomas were also found in primary and metastatic cutaneous melanomas. Interestingly, among the three genes most commonly hypermethylated in cell lines, two were slightly more hypermethylated and one was relatively hypomethylated in metastatic tumors. Recent studies have reviewed the comparison of cell lines and tumors and have come up with different conclusions (Ueki et al., 2000; Smiraglia et al., 2001; Paz et al., 2003). However, one has to be careful in comparing cell lines to tumors; an important consideration is whether the tumor is a primary or metastatic lesion or one of multiple lesions. In our study, hypermethylation was less marked in primary tumors compared to cell lines and metastases. One exception was RAR-β2 where both primary and metastatic tumors demonstrated higher levels of hypermethylation than cell lines.
RAR-β2 was the most frequently hypermethylated gene in the panel of seven genes assessment. This is the first major report describing hypermethylation of RAR-β2 in melanoma in a large series of tumor specimens. Previous studies have demonstrated the frequent hypermethylation of this gene in breast and lung carcinomas (Widschwendter et al., 2000; Sirchia et al., 2002; Paz et al., 2003). RAR-β2 is a member of the nuclear retinoid receptor of genes, a family referred to as retinoic acid receptors (RAR) (Mangelsdorf and Evans, 1995), which are frequently turned off or not expressed in a number of carcinomas. The loss of RAR-β2 has been implicated in tumorigenesis. Interestingly, the frequency (70%) of RAR-β2 hypermethylation was similar among primary and metastatic tumors. This is one of the highest frequencies of genetic aberration reported for sporadic primary melanomas. BRAF mutation in primary tumors is about 31% (Shinozaki et al; unpublished data). The inhibition of transcription of RAR-β2 may be a key factor in sporadic cutaneous melanoma tumor development. RAR-β2 loss has been demonstrated as a biomarker of bronchial preneoplasia (Kurie et al., 2003). We demonstrated a significant correlation between hypermethylation of RAR-β2 and increasing primary tumor Breslow thickness, which is a major prognostic factor for early-stage melanoma (Bostick et al., 1999). The silencing of RAR-β2 may be a key epigenetic factor in melanocyte transformation and primary lesion progression. Further studies are needed to identify RAR-β2 loss during melanocyte and nevus transformation to melanoma.
Retinoic acid treatment can induce differentiation and inhibition of proliferation in selective melanoma cells (Demary et al., 2001). The variable responsiveness of melanomas has not been understood. It has also been shown that retinoic acid can activate RAR-β receptors (Spanjaard et al., 1997). Further studies may be warranted to examine strategic molecular targeting of therapeutics based on RAR-β status in melanoma.
The second most frequently hypermethylated gene was RASSF1A. This larger study supported our previous report that RASSF1A is frequently methylated in metastatic melanomas (Spugnardi et al., 2003). The 42% higher rate of RASSF1A hypermethylation in metastatic versus primary tumors suggests that hypermethylation of RASSF1A is likely to be acquired during tumor progression. Few published studies have compared hypermethylation of genes in primary and metastatic tumors of the same tumor type. The functional role of RASSF1A is still not clear. However, its inactivation as a TSG in multiple types of cancers has been demonstrated (Dammann et al., 2000, 2001; Lo et al., 2001; Pfeifer et al., 2002; Spugnardi et al., 2003).
The third most frequently hypermethylated gene was MGMT; its rate of hypermethylation was 24% higher in metastases than in primary tumors. MGMT, a DNA repair gene, serves as a key regulator of genome integrity. Studies have shown that MGMT expression protects mammalian cell lines from spontaneous G : C to A : T transitions (Christmann et al., 2001). Melanoma is known to have acquired resistance to antineoplastic agents such as alklylating drugs exhibiting methylating and chlorethylating properties such as dacarbazine, procarbazine, and temozolomide (Christmann et al., 2001). The overall frequency of DAPK, p16ink4a, and GSTP1 gene, often found hypermethylated in carcinomas, was quite low in melanoma. The three major genes we assessed were frequently hypermethylated in both primary and metastatic melanomas. There are likely other TSGs and tumor-related genes inactivated through hypermethylation during melanoma progression. A more global screening approach is needed such as DNA methylation microarray analysis (Shi et al., 2003) that will allow assessment of multiple genes for multiple specimens.
Previously, we have demonstrated circulating DNA in the plasma in the form of LOH of microsatellites in melanoma patients (Fujiwara et al., 1999; Taback et al., 2001). In the present study, we demonstrated that melanoma patients have circulating hypermethylated DNA in their plasma. The three most common genes in melanoma tumors were detected in the plasma at a lower frequency. A quantitative real-time PCR assay was developed to improve the sensitivity and accuracy of detecting methylated DNA in the plasma. The assay was 100% specific as no normal donors’ plasma was positive under the assay conditions. Future studies will focus on optimizing the assay to obtain a high sensitivity for early disease diagnosis. This is the first major study demonstrating the presence of a significant number of melanoma patients with circulated methylated DNA markers. The half-life of individual genes will play a significant role as to the value of detection of these circulating DNA. Circulating methylated DNA markers may be used as surrogates of subclinical disease recurrence or progression. Detailed studies on larger cohorts of patients are needed to determine whether these circulating methylation markers have clinical utility in predicting disease outcome. Nevertheless, it is intriguing that circulating methylated DNA is present in the plasma and released by tumor cells. Whether this DNA is from established metastases or circulating tumor cells in blood needs to be determined.
Materials and methods
Cell lines and tissues
In all, 15 established melanoma cell lines were cultured in the growth medium and prepared for DNA extraction as previously described (Fujiwara et al., 1999). Frozen metastatic melanoma tumor specimens (n = 53) were obtained from 44 patients who underwent elective surgery at John Wayne Cancer Institute, Saint John’s Health Center, Santa Monica, CA, USA. Frozen tumor-draining lymph nodes (n = 10), histopathology tumor negative by immunohistochemistry, were obtained from melanoma patients having elective surgery. Paraffin-embedded metastatic tumor tissues (n = 33) and primary tumors (n = 20) from melanoma patients were obtained from the Division of Surgical Pathology at Saint John’s Health Center. Paraffin-embedded melanoma and breast cancer tumor-draining lymph nodes (n = 12) that were histopathology (immunohistochemistry) negative were assessed. For the studies on paired tumors and plasma from the same patients, there were additional 24 metastatic tumors assessed; tumors from seven pairs overlapped the initial 86 metastatic patients assessed. All patients provided signed informed consent to participate in the studies. Human subjects’ IRB approval was obtained for the use of human subjects in this study from Saint John’s Health Center and John Wayne Cancer Institute joint committee.
Bisulfite treatment
DNA was isolated from cell lines and frozen tissues using DNAzol Genomic DNA Isolation Reagent (Molecular Research Center, Inc., Cincinnati, OH, USA) according to the manufacturer’s recommendations. Paraffin-embedded tumor DNA was extracted as previously described (Fujiwara et al., 1999). Following extraction, DNA was subjected to sodium-bisulfite modification (Spugnardi et al., 2003). In total, 1 μg of DNA was denatured at 100°C for 10 min and quickly chilled on ice. Sodium hydroxide (Sigma, St Louis, MO, USA) was then added to a final concentration of 0.3 M, and the DNA was incubated at 50°C for 15 min. The DNA was then mixed with 2 vol 2% LMP agarose (BioWhittaker Molecular Applications, Rockland, ME, USA) and pipetted into chilled mineral oil, forming a single bead. In total, 400 μl of a 5 M bisulfite solution (pH 5.0) consisting of 2.5 M sodium metabisulfite and 125 mM hydroquinone (Sigma) was added, and the reaction was incubated at 50°C for 14 h. The modification was stopped by equilibrating the beads with 0.5 ml 1 × Tris-EDTA (TE) (6 × 5 min) followed by desulfonation using 0.2 M NaOH (500 μl, 2 × 15 min). The reactions were neutralized using 100 μl (1/5 vol) 1 N hydrochloric acid (Sigma). One final TE rinse was followed by equilibration in molecular grade H2O (2 × 15 min). The beads were then used for MSP.
Genomic sequencing
DNA sequences were amplified by mixing 100 ng of bisulfite-treated melanoma cell line DNA with 100 pmol of each respective primer: MGMT, M1 5′-GGGTTATTTGGTAAATTAAGGTATAGAG-3′ and M2 5′-CACCTAAAAATAAAACAAAAACTACCAC-3′; RASSF1A, R3 5′-GGGAGTTTGAGTTTATTGAGTTG-3′ and R2 5′-CAC CTCTACTCATCTATAACCCAAATAC-3′; RAR-β2, RA3 5′-GTGTGATAGAAGTAGTA GGAAGTGAGTTGT-3′ and RA2 5′-ACTCCATCAAACTCTACCCCTTTTTTAAC-3′ in a 50 μl reaction containing buffer, of dNTP and AmpliTaq gold polymerase (Applied Biosystems, Foster City, CA, USA) at 95°C for 45 s, 55°C for 45 s, and 72°C for 2 min for 40 cycles. PCR products were gel purified using the QIAquick Gel Extraction Kit (Qiagen, Valencia, CA, USA) and sequenced using an automated DNA sequencer (CEQ 8000XL DNA Analysis System, Beckman Coulter, Fullerton, CA, USA) with the respective internal primer: MGMT, M3 5′-GTTGT (c/t)GGAGGATTAGGGT-3′; RASSF1A, R4 5′-TACCCCTTAACTACCCCTTCC-3′, and RAR-β2, RA4 5′-AATCATAAATTATAACAAACAAACCAACT-3′.
Fluorescent MSP analysis
Methylation status was assessed for each gene using two sets of fluorescent labeled primers specifically designed to amplify methylated or unmethylated DNA sequence. Primer sequences are listed as methylated sense and antisense followed by unmethylated sense and antisense, with annealing temperatures and PCR product size: TIMP-3, 5′-CGTTTCGTTATTTTTTGTTTTCGGTTTC-3′ and 5′-CCGAAAACCCCGCCTCG-3′ (59°C, 116 bp) 5′-TTTTGTTTTGTTATTTTTTGTTTTTGGTTTT-3′ and 5′-CCCCCAAAAACCCCACCTCA-3′ (59°C, 122 bp) (19); RASSF1A, 5′-GTGTTAACGCGTTGCGTATC-3′ and 5′-AACCCCGCGAACTAAAAAC-GA-3′ (601C, 93 bp), 5′-TTTGGTTGGAGTGTGTTAATG TG-3′ and 5′-CAAACCCCACAAACTAAAAACA A-3′ (60°C, 105 bp) (11,16); RAR-β2, 5′-GAACGCGAGCGATTCGAGT-3′ and 5′-GACCAATCCAACCGAAACG-3′ (59°C, 142 bp), 5′-GGATTGGGATGTTGAGAATGT-3′ and 5′-CAACCAATCCAACCAAAACAA-3′ (59°C, 158 bp) (Evron et al., 2001); MGMT, 5′-TTTCGACGTTCGTAGGTTTTC GC-3′ and 5′-GCACTCTTCCGAAAACGAAACG-3′ (66°C, 81 bp), 5′-TTTGTGTTTTGATGTTTGTAGGTTTTTGT-3′ and 5′-AACTCCACACTCTTCCAAAAACAAAAC (66°C, 93 bp) (Esteller et al., 1999); DAPK 5′-GGATAGTCGGATCGAGTTAACGTC and 5′-CCCTCCCAAACGCCGA (64°C, 98 bp), 5′-GGAGGATA GTTGGATTGAGTTAATGTT-3′ and 5′-CAAATCCCTCCCAAACACCAA-3′ (64°C, 106 bp) (Goessl et al., 2000); GSTP1, 5′-TTCGGGGTGTAGCGGTCGTC-3′ and 5′-GCCCCAATACTAAATCACGACG-3′ (59°C, 91 bp), 5′-GATGTTTGGG GTGTAGTGGTTGTT-3′ and 5′-CCACCCCAATACTAAATCACAACA-3′ (59°C, 97 bp) (Esteller et al., 1999; Zochbauer-Muller et al., 2001); p16INK4a, 5′-TTATTAGAGGGTGGGGCGGATCGC-3′ and 5′-GACCCGAACCGCGACCGTAA-3′ (65°C, 150 bp), 5′-TTATTAGAGGGTGGGGTGGATTGT-3′ and 5′-CAACCCCAAACCACA ACCATAA-3′ (65°C, 151 bp) (21,24); and MYOD1, 5′-CCAACTCCAAATCCCCTCTCTAT-3′ and 5′-TGATTAATTTAGATTGGGTTTAGAGAAG GA-3′ (60°C, 162 bp) (Eads et al., 1999). In all, 100 ng of bisulfite-modified DNA was subjected to PCR amplification in a final reaction volume of 20 μl containing PCR buffer, 2.5–4.5 mM MgCl2, dNTPs, 0.3 μM primers, BSA, and 0.5 U of AmpliTaq gold polymerase (Applied Biosystems). PCR was performed with an initial 10 min incubation at 95°C, followed by 40 cycles of denaturation at 95°C for 30 s, annealing for 30 s, and extension at 72°C for 30 s, and a final 7-min hold at 72°C. Sodium-bisulfite modified lymphocytes from healthy donors were used as positive unmethylated control, SssI Methylase (New England BioLabs, Beverly, MA, USA)-treated modified lymphocytes were used as a positive methylated control, and unmodified lymphocytes were used as a negative control for methylated and unmethylated reactions. PCR products were visualized using capillary array electrophoresis (CAE; CEQ 8000XL). The assay was set up in a 96-well microplate format. Multiple PCR products can be assayed in the same well for comparison. Methylated and unmethylated PCR products from each sample were assessed simultaneously by labeling forward primers with a choice of three Beckman Coulter WellRED Phosphoramidite (PA)-linked dyes (Genset Oligos, Boulder, CO, USA). Forward methylated specific primer was labeled with D4pa dye and forward unmethylated specific primer was labeled with D2pa dye. In all, 1 μl of methylated PCR product and 1 μl of unmethylated PCR product were mixed with 40 μl loading buffer and 0.5 μl dye-labeled size standard (Beckman Coulter Inc.). The CAE analysis detects the different dyes and displays them in respective colors.
RT–PCR analysis
Total cellular RNA was extracted from melanoma cell lines using TriReagent (Molecular Research Center, Cincinnati, OH, USA). RT–PCR was performed as previously described (Takeuchi et al., 2003). Briefly, all RT reactions were carried out with oligo-dT priming using 1 μg of total RNA. The resulting cDNA was subjected to PCR conditions of 95°C for 30 s, annealing for 30 s, and 72°C for 1 min, for 35 cycles for MGMT, RASSF1A, and RAR-β2 and 25 cycles for the GAPDH housekeeping gene. All samples were assessed for the presence of GAPDH mRNA. All PCR products were separated on 2% Tris-borate EDTA agarose gels and stained with ethidium bromide as previously described (Spugnardi et al., 2003).
Re-expression of MGMT, RAR-β2, and RASSF1A genes
Several cell lines were grown for 4 days in T75 cm2 tissue culture flasks in the presence of 0, 3, or 5 μM of 5Aza-dC (Sigma) as previously described (Spugnardi et al., 2003). An additional flask of cells was grown in the presence of 5 μM 5Aza-dC for 4 days followed by treatment with 1 μM ATRA (Sigma) for 24 h. RNA was isolated and RT–PCR was performed as described above to analyse for RASSF1A, MGMT, and RAR-β2 gene re-expression.
Plasma DNA isolation and methylation analysis
DNA was extracted from the plasma as previously described (Taback et al., 2001). Briefly, 500 μl of plasma was diluted with 0.9 M NaCl2, SDS, and proteinase K (QIAGEN) and incubated at 50°C for 3 h. An equal volume of phenol–chloroform–isoamyl alcohol (25 : 24 : 1) was then added and the sample was vortexed vigorously. After centrifugation at 1000 g for 10 min, the aqueous layer was collected and phenol–chloroform–isoamyl alcohol was again added. DNA was precipitated using pellet paint NF co-precipitant (Novagen, Madison, WI, USA) and isopropanol.
Extracted DNA was subjected to sodium bisulfite modification. Briefly, DNA extracted from 500 μl of plasma and supplemented with 1 μg salmon sperm DNA (Sigma) was denatured in 0.3 M NaOH for 15 min at 37°C. In all, 550 μl of a 2.5 M sodium bisulfite/125 mM hydroquione solution was then added and samples were incubated under mineral oil in the dark for 3 h at 60°C. Salts were removed using the Wizard DNA Clean-Up System (Promega, Madison, WI, USA) and samples were then desulfonated in 0.3 M NaOH at 37°C for 15 min. Modified DNA was precipitated with ethanol using Pellet Paint NF (Novagen) as a carrier and then resuspended in molecular grade H2O.
The methylation status of the bisulfite-treated DNA was determined using primers and probes specifically designed to amplify methylated gene promoter regions. Quantitative real-time PCR was preformed as previously described (Takeuchi et al., 2003). Real-time PCR reactions were run on the iCycler iQ RealTime thermocycler (Bio-Rad Laboratories, Hercules, CA, USA). Analysis involved 25 μl PCR reaction containing sodium bisulfite-treated DNA template, 0.8 μ of each primer, 0.4 μ fluorescence resonance energy transfer probe, AmpliTaq gold polymerase (Applied Biosystems), dNTPs, MgCl2, BSA, and AmpliTaq PCR buffer. Amplification conditions were 95°C for 10 min followed by 55 cycles of denaturation at 95°C for 1 min, annealing at 60°C for MYOD1 and RASSF1A (annealing at 59°C for RAR-β2 and 66°C for MGMT), and extension at 72°C for 1 min. Each PCR plate contained positive controls including melanoma cell lines shown to be methylated for the gene being assessed as well as SssI-treated healthy donor lymphocytes. Negative controls included healthy donors plasma DNA and reactions that contained no template DNA.
Real-time PCR assay was performed to obtain the approximate number of methylated gene copies present in a sample. The internal reference gene MYOD1 was used to amplify sodium bisulfite-treated DNA independent of methylation status to confirm the presence of modified DNA (9). In addition, a standard curve was constructed with serial dilutions of 101–105 copies of the targeted TSG promoter region template. Copy numbers for the individual samples were established using the standard curve. Primer sequences for the real-time PCR were the same as for the CAE analysis, while the probe sequences were as follows: MYOD, 5′-CCCTTCCTATTCCTAAATCCAACCTA-3′; MGMT, 5′-CGTTTGCGATTTGGTGAGTGTTTGGG-3′; RASSF1A, 5′-CAACTACCGTATAAAATTACACGCGATACCCCG-3′; and RAR-β2, 5′-CCGAATACGTTCCGAATCCTACCCCG-3′.
Acknowledgements
This work was supported in part by NIH NCI R21 CA100314, PO CA 29605 Project II, and PO CA 13917 Project II and Roy E Coates Foundation.
Abbreviations
- ATRA
all-trans-retinoic acid
- 5Aza-dC
5′-aza 2′-deoxycytidine
- GAPDH
glyceraldehyde-3-phosphate dehydrogenase
- DAPK
death-associated protein kinase
- GSTP1
glutathione S-transferase P1
- MGMT
O6-methylguanine DNA methyla-transferase
- MSP
methylation-specific polymerase chain reaction
- RT–PCR
reverse transcriptase-polymerase chain reaction
- RAR-β2
retinoic acid receptor-β2
- RASSF1A
RAS association domain family protein 1A
- TSG
tumor suppressor gene.
References
- Baylin SB, Herman JG. Trends Genet. 2000;16:168–174. doi: 10.1016/s0168-9525(99)01971-x. [DOI] [PubMed] [Google Scholar]
- Bostick PJ, Morton DL, Turner RR, Huynh KT, Wang HJ, Elashoff R, Essner R, Hoon DS. J. Clin. Oncol. 1999;17:3238–3244. doi: 10.1200/JCO.1999.17.10.3238. [DOI] [PubMed] [Google Scholar]
- Chen CM, Chen HL, Hsiau TH, Hsiau AH, Shi H, Brock GJ, Wei SH, Caldwell CW, Yan PS, Huang TH. Am. J. Pathol. 2003;163:37–45. doi: 10.1016/S0002-9440(10)63628-0. [DOI] [PMC free article] [PubMed] [Google Scholar]
- Christmann M, Pick M, Lage H, Schadendorf D, Kaina B. Int. J. Cancer. 2001;92:123–129. [PubMed] [Google Scholar]
- Dammann R, Li C, Yoon JH, Chin PL, Bates S, Pfeifer GP. Nat. Genet. 2000;25:315–319. doi: 10.1038/77083. [DOI] [PubMed] [Google Scholar]
- Dammann R, Yang G, Pfeifer GP. Cancer Res. 2001;61:3105–3109. [PubMed] [Google Scholar]
- Davies H, Bignell GR, Cox C, Stephens P, Edkins S, Clegg S, Teague J, Woffendin H, Garnett MJ, Bottomley W, Davis N, Dicks E, Ewing R, Floyd Y, Gray K, Hall S, Hawes R, Hughes J, Kosmidou V, Menzies A, Mould C, Parker A, Stevens C, Watt S, Hooper S, Wilson R, Jayatilake H, Gusterson BA, Cooper C, Shipley J, Hargrave D, Pritchard-Jones K, Maitland N, Chenevix-Trench G, Riggins GJ, Bigner DD, Palmieri G, Cossu A, Flanagan A, Nicholson A, Ho JW, Leung SY, Yuen ST, Weber BL, Darrow TL, Paterson H, Marais R, Marshall CJ, Wooster R, Stratton MR, Futreal PA. Nature. 2002;417:949–954. doi: 10.1038/nature00766. [DOI] [PubMed] [Google Scholar]
- Demary K, Wong L, Liou JS, Faller DV, Spanjaard RA. Endocrinology. 2001;142:2600–2605. doi: 10.1210/endo.142.6.8201. [DOI] [PubMed] [Google Scholar]
- Eads CA, Danenberg KD, Kawakami K, Saltz LB, Danenberg PV, Laird PW. Cancer Res. 1999;59:2302–2306. [PubMed] [Google Scholar]
- Esteller M, Corn PG, Baylin SB, Herman JG. Cancer Res. 2001;61:3225–3229. [PubMed] [Google Scholar]
- Esteller M, Hamilton SR, Burger PC, Baylin SB, Herman JG. Cancer Res. 1999;59:793–797. [PubMed] [Google Scholar]
- Esteller M, Herman JG. J. Pathol. 2002;196:1–7. doi: 10.1002/path.1024. [DOI] [PubMed] [Google Scholar]
- Evron E, Dooley WC, Umbricht CB, Rosenthal D, Sacchi N, Gabrielson E, Soito AB, Hung DT, Ljung B, Davidson NE, Sukumar S. Lancet. 2001;357:1335–1336. doi: 10.1016/s0140-6736(00)04501-3. [DOI] [PubMed] [Google Scholar]
- Fujiwara Y, Chi DD, Wang H, Keleman P, Morton DL, Turner R, Hoon DS. Cancer Res. 1999;59:1567–1571. [PubMed] [Google Scholar]
- Goessl C, Krause H, Muller M, Heicappell R, Schrader M, Sachsinger J, Miller K. Cancer Res. 2000;60:5941–5945. [PubMed] [Google Scholar]
- Harden SV, Tokumaru Y, Westra WH, Goodman S, Ahrendt SA, Yang SC, Sidransky D. Clin. Cancer Res. 2003;9:1370–1375. [PubMed] [Google Scholar]
- Jeronimo C, Usadel H, Henrique R, Oliveira J, Lopes C, Nelson WG, Sidransky D. J. Natl. Cancer Inst. 2001;93:1747–1752. doi: 10.1093/jnci/93.22.1747. [DOI] [PubMed] [Google Scholar]
- Johnson PJ, Lo YM. Clin. Chem. 2002;48:1186–1193. [PubMed] [Google Scholar]
- Jones PA, Baylin SB. Nat. Rev. Genet. 2002;3:415–428. doi: 10.1038/nrg816. [DOI] [PubMed] [Google Scholar]
- Kurie JM, Lotan R, Lee JJ, Lee JS, Morice RC, Liu DD, Xu XC, Khuri FR, Ro JY, Hittelman WN, Walsh GL, Roth JA, Minna JD, Hong WK. J. Natl. Cancer Inst. 2003;95:206–214. doi: 10.1093/jnci/95.3.206. [DOI] [PubMed] [Google Scholar]
- Lo KW, Kwong J, Hui AB, Chan SY, To KF, Chan AS, Chow LS, Teo PM, Johnson PJ, Huang DP. Cancer Res. 2001;61:3877–3881. [PubMed] [Google Scholar]
- Mangelsdorf DJ, Evans RM. Cell. 1995;83:841–850. doi: 10.1016/0092-8674(95)90200-7. [DOI] [PubMed] [Google Scholar]
- Maruyama R, Toyooka S, Toyooka KO, Harada K, Virmani AK, Zochbauer-Muller S, Farinas AJ, Vakar-Lopez F, Minna JD, Sagalowsky A, Czerniak B, Gazdar AF. Cancer Res. 2001;61:8659–8663. [PubMed] [Google Scholar]
- Paz MF, Fraga MF, Avila S, Guo M, Pollan M, Herman JG, Esteller M. Cancer Res. 2003;63:1114–1121. [PubMed] [Google Scholar]
- Pfeifer GP, Yoon JH, Liu L, Tommasi S, Wilczynski SP, Dammann R. Biol. Chem. 2002;383:907–914. doi: 10.1515/BC.2002.097. [DOI] [PubMed] [Google Scholar]
- Rosas SL, Koch W, da Costa Carvalho MG, Wu L, Califano J, Westra W, Jen J, Sidransky D. Cancer Res. 2001;61:939–942. [PubMed] [Google Scholar]
- Shi H, Wei SH, Leu YW, Rahmatpanah F, Liu JC, Yan PS, Nephew KP, Huang TH. Cancer Res. 2003;63:2164–2171. [PubMed] [Google Scholar]
- Sidransky D. Nat. Rev. Cancer. 2002;2:210–219. doi: 10.1038/nrc755. [DOI] [PubMed] [Google Scholar]
- Sirchia SM, Ren M, Pili R, Sironi E, Somenzi G, Ghidoni R, Toma S, Nicolo G, Sacchi N. Cancer Res. 2002;62:2455–2461. [PubMed] [Google Scholar]
- Smiraglia DJ, Rush LJ, Fruhwald MC, Dai Z, Held WA, Costello JF, Lang JC, Eng C, Li B, Wright FA, Caligiuri MA, Plass C. Hum. Mol. Genet. 2001;10:1413–1419. doi: 10.1093/hmg/10.13.1413. [DOI] [PubMed] [Google Scholar]
- Spanjaard RA, Ikeda M, Lee PJ, Charpentier B, Chin WW, Eberlein TJ. J. Biol. Chem. 1997;272:18990–18999. doi: 10.1074/jbc.272.30.18990. [DOI] [PubMed] [Google Scholar]
- Spugnardi M, Tommasi S, Dammann R, Pfeifer GP, Hoon DS. Cancer Res. 2003;63:1639–1643. [PubMed] [Google Scholar]
- Taback B, Fujiwara Y, Wang HJ, Foshag LJ, Morton DL, Hoon DS. Cancer Res. 2001;61:5723–5726. [PubMed] [Google Scholar]
- Takeuchi H, Kuo C, Morton DL, Wang HJ, Hoon DS. Cancer Res. 2003;63:441–448. [PubMed] [Google Scholar]
- Toyooka S, Maruyama R, Toyooka KO, McLerran D, Feng Z, Fukuyama Y, Virmani AK, Zochbauer-Muller S, Tsukuda K, Sugio K, Shimizu N, Shimizu K, Lee H, Chen CY, Fong KM, Gilcrease M, Roth JA, Minna JD, Gazdar AF. Int. J. Cancer. 2003;103:153–160. doi: 10.1002/ijc.10787. [DOI] [PubMed] [Google Scholar]
- Ueki T, Toyota M, Sohn T, Yeo CJ, Issa JP, Hruban RH, Goggins M. Cancer Res. 2000;60:1835–1839. [PubMed] [Google Scholar]
- Usadel H, Brabender J, Danenberg KD, Jeronimo C, Harden S, Engles J, Danenberg PV, Yang S, Sidransky D. Cancer Res. 2002;62:371–375. [PubMed] [Google Scholar]
- Widschwendter M, Berger J, Hermann M, Muller HM, Amberger A, Zeschnigk M, Widschwendter A, Abendstein B, Zeimet AG, Daxenbichler G, Marth C. J. Natl. Cancer Inst. 2000;92:826–832. doi: 10.1093/jnci/92.10.826. [DOI] [PubMed] [Google Scholar]
- Widschwendter M, Jones PA. Oncogene. 2002;21:5462–5482. doi: 10.1038/sj.onc.1205606. [DOI] [PubMed] [Google Scholar]
- Zochbauer-Muller S, Fong KM, Virmani AK, Geradts J, Gazdar AF, Minna JD. Cancer Res. 2001;61:249–255. [PubMed] [Google Scholar]