Abstract
Distortion product otoacoustic emissions (DPOAEs) originate in cochlear nonlinearity and emerge into the ear canal as an apparent sum of emission types, one of which (generator) travels directly out and the other (reflector) travels out following linear reflection. The present study explores intracochlear sources of DPOAEs via simultaneous ear canal and intracochlear pressure measurements in gerbils. A locally damaged cochlea was produced with reduced local intracochlear nonlinearity and significant elevation of the compound action potential thresholds at frequencies represented within the damaged region. In the DPOAE the comparison of healthy to locally damaged cochleae showed the following: (1) In the broad frequency region corresponding to the locally damaged best frequency, DPOAEs evoked by wider f2∕f1 stimuli decreased, consistent with the reduction in local nonlinearity. (2) DPOAEs evoked by narrow f2∕f1 stimuli often had a bimodal change, decreasing in a lower frequency band and increasing in a band just adjacent and higher, and the DPOAE phase-vs-frequency slope steepened. These changes confirm the complex nature of the DPOAE.
INTRODUCTION
Otoacoustic emissions (OAEs) are one piece of evidence for the cochlea’s active nonlinearity (Kemp, 1978) and have been widely used clinically for noninvasive hearing screening (Lonsbury-Martin and Martin, 1990). In a healthy ear with normal hearing thresholds, the cochlea’s mechanical response is sharply tuned and compressively nonlinear (reviewed in Robles and Ruggero, 2001; Cooper, 2003). The nonlinearity is produced by outer hair cells (OHCs) (reviewed in Patuzzi, 1986). Cochlear nonlinearity generates frequency components that are not present in the stimulus. For single tones, the response includes harmonics in addition to the fundamental component (Cooper, 1998; Olson, 2004). For two tones, the response includes a family of tones at combination frequencies of the primaries, known as distortion products (DPs) and called distortion product otoacoustic emissions (DPOAEs) when measured in the ear canal. DPOAEs are known to depend on the active process in the cochlea, which is tied to the normal function of OHCs (reviewed in Dallos, 1992), even with high primary intensities (Avan et al., 2003). The 2f1−f2 component is the most commonly studied, is often largest, and is emphasized in this paper. When measured over a range of primary frequencies with constant primary ratio (f2∕f1) the frequency response of a given component can be explored as a function of frequency. This “DPOAE-gram” has a complex nature, with fine structure in amplitude and a phase whose character depends on the stimulus parameters and on which DPOAE component is plotted (e.g., Mauermann et al., 1999b, 1999a; Shera and Guinan, 1999; Talmadge et al., 1999; Knight and Kemp, 2000). The DPOAE phase-vs-frequency can be either approximately constant or rapidly varying. These amplitude and phase characteristics can be readily explained if the DPOAE is contributed to by more than one source. Kim (1980) suggested that the DPOAE has substantial contributions from two regions, the f2 place and the fdp place. Kemp (1986) categorized these contributions as “wave-fixed” and “place-fixed” emission types, with the wave-fixed emission having a constant phase and the place-fixed emission having a rapidly varying phase. The two-source model was further developed as a two mechanism concept (Talmadge et al., 1998; Shera and Guinan, 1999): The wave-fixed emission was due to nonlinear generation and the place-fixed emission to linear coherent reflection. In this conceptualization, the source of the wave-fixed or “generator” emission moved along the cochlea with approximately unchanging phase as the primary frequencies were swept at fixed ratio. The generator-type emission arose directly from the source of nonlinearity. It was expected to come from a place where both f1 and f2 are relatively large—which, due to the steep apical cut-off of cochlear filtering is in the region of the f2 place. The “place-fixed” or “reflector” emission was thought to arise via linear reflection from random impedance variations, mainly within the peak of the response at the DP place (Zweig and Shera, 1995). The measured emission is the summation of generator-type and reflection-type emissions. Recent studies have noted a strong correlation between emission type and the primary ratio f2∕f1. For example, human studies showed that the 2f1−f2 DPOAE phase character changed systematically from rapidly varying (reflector-type emission) with primary ratio less than 1.1, to slowly varying (generator-type emission) at wider primary ratios (Knight and Kemp, 2000; Kalluri and Shera, 2001; Dhar et al., 2005). Several studies have been designed to unmix the two emission types, with results that support the two-source framework. (Stover et al., 1996; Talmadge et al., 1999; Knight and Kemp, 2000; Kalluri and Shera, 2001; Knight and Kemp, 2001; Konrad-Martin et al., 2001; Dhar et al., 2005; Long et al., 2008).
Numerous studies support OHC electromechanics as the fundamental source of the emissions. For example, in cochleae in which inner hair cells were selectively destroyed, the emissions were still strong (Jock et al., 1996; Trautwein et al., 1996). In addition, when OHCs were damaged or the endocochlear potential was reduced, emissions were reduced (Henley et al., 1996; Avan et al., 2003; Mills, 2003). When it comes to studies that probe the cochlear region of emission generation and thus test the emission theory, there is more uncertainty. For example, a study on the relationship between OAEs and OHC loss in damaged cochleae found that the DPOAE was insensitive to fairly extensive OHC loss (e.g., Harding et al., 2002; Harding and Bohne, 2004). Other studies have suggested that the cochlear base contributes substantially to emissions, especially at moderate and high stimulus levels (Martin et al., 1999; Fahey et al., 2000; Martin et al., 2008). The DPOAE is a simple signal emerging from a complicated system, and we still have much to learn about it.
In the present study, we developed a protocol to locally damage the cochlear partition (CP) and observed the resulting changes in DPOAEs and in the local intracochlear pressure responses measured close to the basilar membrane (BM). We made simultaneous measurements of DPOAEs and intracochlear DPs in gerbil using swept two-tone stimulation of fixed primary ratio, with the ratio either narrow (1.05) or relatively wide (1.25). The cochlear condition was evaluated by compound action potential (CAP) thresholds and single-tone intracochlear pressure responses measured at the location of damage. We found the following: (1) Local damage caused a decrease in the degree of locally measured cochlear nonlinearity upon single-tone stimulation and decrease in the intracochlear DPs upon two-tone stimulation. (2) When the primary ratio was narrow, DPOAEs had a bimodal change following damage, decreasing in a frequency band slightly lower than the damaged region and increasing within the damaged region. When the primary ratio was wider, the DPOAEs decreased when f2 was approximately within the damaged region. (3) In the damaged cochleae the DPOAE phase tended to shift from gradually to steeply sloping in affected frequency regions when the primary ratio was narrow while it did not change substantially with wider ratio primaries. The results indicate that damage can actually lead to an increase in an emission that, based on its phase characteristics, is a reflector-type emission. In contrast, the wider ratio DPOAE, whose phase characteristics are indicative of a generator-type, was always reduced by the local damage.
METHODS
Most of the methods have been described elsewhere (Dong and Olson, 2005b, 2006, 2008). Thus only a brief outline is given here, along with details of specific modifications.
Experiments were performed in deeply anesthetized young adult gerbils. Ketamine (40 mg∕kg) was administered first to sedate the animal. Sodium pentobarbital (initial dose 60 mg∕kg, supplemental 10 mg∕kg) was used throughout the experiment for maintenance of anesthesia and the analgesic buprenorphine (20 mg∕kg) was administered every 6 h. At the end of the experiment the animal was sacrificed with sodium pentobarbital. The care and use of the animals were approved by the Institutional Animal Care and Use Committee of Columbia University. During the experiment, animal core temperature was maintained at ∼37 °C using a thermostatically controlled heating blanket. A tracheotomy was performed to maintain a patent airway. The left pinna was removed and the bulla was widely open. A small hole was hand drilled in turn one scala tympani (ST) where the best frequency (BF) is ∼20 kHz to introduce the micro-pressure-sensor into the cochlea.
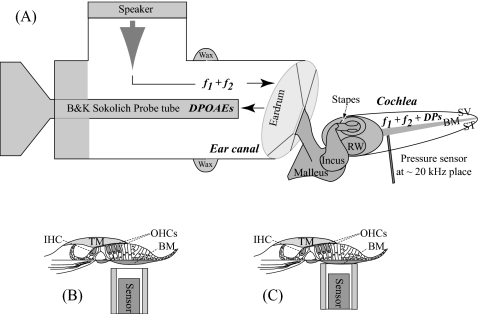
Acoustic intracochlear pressure and ear canal (EC) pressure responses were simultaneously recorded [Fig. 1A]. A sensitive Bruel & Kjaer probe tube microphone positioned within 3 mm of the tympanic membrane in a closed-field sound configuration served as the EC pressure monitor. The frequency-dependent transfer function of the probe tube microphone was accounted for when setting the sound pressure level (SPL) and analyzing the data. SPLs are reported as dB SPL (decibels relative to 20 μPa peak). Intracochlear pressure responses were measured with the micro-pressure-sensor technique (Olson, 1998). A sensor of ∼125 μm outer diameter was introduced via a hand-drilled hole and positioned close to the BM at a distance of ∼10 μm using a motorized micromanipulator that advanced in micrometer steps (Fig. 1). Sensor construction and calibration have been reported previously (e.g., Olson, 1998; Dong and Olson, 2006). In brief, after construction, the sensors were calibrated in water and air (air at room and body temperature) from 200 Hz to 50 kHz. The air calibration is usually similar to the water calibration. The sensitivity is typically flat with frequency to within ∼2 dB through 40 kHz and often dropped a few dB between 40 and 50 kHz (Fig. 2 of Olson, 1998). Water calibration was performed before and after experiments. The sensitivity can change due to very small disturbances of the sensitive membrane; this typically produces an uncertainty of ±∼10 dB in the pressure measurements. In the present study the sensor was used to indent the cochlear partition in the turn one location of measurement [see Fig. 1C]. Local indentation was done in four animals. In two of these the indentation damaged the sensor’s fragile membrane so that it was no longer sensitive, limiting the experiments with complete data sets pre- and post-damage to two (wg95 and wg122). A subset of results from the other two experiments is reported, and results from several other experiments are included to illustrate particular points.
Figure 1.
Simultaneous measurement of DP and DPOAE and locally damaged cochlea. (A) DPAOE was measured in the ear canal pressure responses close to the eardrum with a sensitive microphone with two-tone stimuli to the ear canal in a closed-field sound configuration (sound system coupled to the ear canal opening with bone wax). Simultaneously, the intracochlear DP was measured in ST pressure responses in turn one with a micro-pressure-sensor. (B) Sensor positioned close to the basilar membrane. (C) Sensor indenting the cochlear partition. BM: basilar membrane; IHC: inner hair cells; OHC: outer hair cells; ST: scala tympani; SV: scala vestibuli; TM: tectorial membrane.
Figure 2.
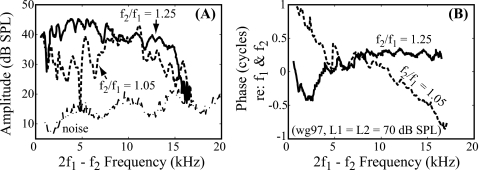
Gerbil DPOAE includes multiple types. (A) Amplitude and (B) phase of DPOAE obtained from one animal (wg97, L1=L2=70 dB SPL, f2∕f1=1.05 and 1.25, frequency step=400 Hz). Phases were normalized to ear canal f1 and f2 phases. Dashed and solid lines represent responses with f2∕f1 of 1.05 and 1.25, respectively. The fine structure in the amplitude and different phase slopes indicate that the DPOAE is a combination of multiple types.
The stimuli consisted of single or two-equal-intensity tones of 1–2 s duration, generated by a Tucker Davis Technology (TDT) system III and delivered via a closed system with a Radio Shack tweeter. With a fixed primary ratio paradigm, the primaries were swept in steps of ∼500 Hz with f2∕f1 fixed at either 1.05 or 1.25 (frequency spacing down to 50 Hz has been used and showed similar phase as that with step of ∼500 Hz; thus there is no unwrapping phase error). The sampling frequency of the TDT system was 200 kHz. Stimulus and acquisition programs were written in MATLAB and the TDT visual design studio. Responses were later analyzed by Fourier transform with MATLAB. The phases of the DP or DPOAE are presented referenced to the EC primary phases: Φ2f1−f2-re-EC=Φ2f1−f2−(2Φf1−Φf2), where Φf1 and Φf2 are the phases of EC primaries.
With 1 s data acquisition time, the microphone noise level (with probe tube) was ∼5–10 dB SPL up to 30 kHz and higher at higher frequencies. The noise level of the intracochlear pressure measurement is 50–60 dB SPL. System distortion has been discussed previously (Dong and Olson, 2006, 2008). Acoustic two-tone distortion was checked in a small cavity and was ∼70 dB below the primary levels when both primaries were 100 dB SPL. System distortion was also checked with postmortem responses after each in vivo experiment.
Single- and two-tone responses were collected consecutively with the sensor close to the BM under normal condition [Fig. 1B] and locally damaged condition [Fig. 1C]. The locally damaged cochlea was produced by indenting the cochlear partition ∼10 μm several times with the micro-pressure-sensor [Fig. 1C)]. The physiological condition of the cochlea was monitored using CAP threshold responses (threshold criterion ∼5 μV p-p) to tone pips, measured with a silver electrode on the bone surrounding the round window (RW) opening. The CAP thresholds were measured a few times during the experiments, especially before and after introducing the sensor into the ST and after damaging the CP. Damage was confirmed by an elevation in CAP thresholds. We have shown that the mere presence of the sensor close to the BM has minimal effect on CAP thresholds and DPOAEs (Dong and Olson, 2008).
RESULTS
Basic characteristics of DPOAE—Evidence for multiple types
Typical 2f1−f2 DPOAE data from an intact gerbil cochlea are shown in Fig. 2. The primary levels were L1=L2=70 dB SPL, and the primary ratio (f2∕f1) was fixed at either 1.05 (dashed line) or 1.25 (solid line). DPOAEs are robust in gerbils, and their levels could exceed 40 dB SPL at both ratios (Mills, 2002). Above 15 kHz, the DPOAEs diminished, sometimes slightly and other times more acutely; this cut-off frequency varied across animals, similar to the observed variation in CAP threshold at frequencies above 20 kHz. Deep notches in the amplitude are suggestive of cancellation, and the amplitude fine structure is one of the observations leading to a two-source emission framework. The phase was quite flat for the wider ratio DPOAE (1.25) consistent with past observations (Dong and Olson, 2008), while the narrow ratio DPOAE (1.05) had a more rapidly varying phase. These characteristics are consistent with DPOAE observations in the literature discussed in the Introduction.
Changes post-damage
The impact of the local damage was assessed using CAP threshold responses to tone pips (Fig. 3) and single-tone intracochlear pressure responses measured close to the BM (Fig. 4).
Figure 3.
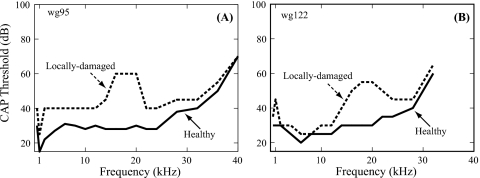
CAP thresholds before and after local damage. Solid and dashed lines indicate healthy and locally damaged conditions (wg95 and wg122).
Figure 4.
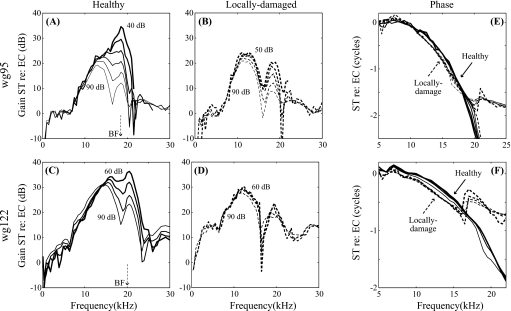
Cochlear mechanics before and after local damage. Single-tone intracochlear pressure responses measured at the same location, close to the BM (∼10 μm) pre- and post-damage in two animals (wg95 and wg122). [(A) and (C)] Pre-damage gain relative to stimulus pressure in the ear canal; [(B) and (D)] Post-damage gain. Stimulus SPLs are labeled. [(E) and (F)] Single-tone pressure phase referenced to EC. Solid and dashed lines represent the cochlear conditions, healthy or locally damaged, respectively.
CAP thresholds after local damage
CAP thresholds from 0.5 to 40 kHz under healthy (pre-damaged) and locally damaged (post-damage) conditions in two animals are illustrated in Fig. 3. The CAP thresholds in the healthy condition were ∼30 dB SPL at frequencies below 20 kHz, and higher at higher frequencies (solid line in Fig. 3). Making the ST hole and introducing the sensor to a position close to the BM changed the CAP thresholds very little (e.g., Fig. 4 in Dong and Olson, 2008). After using the sensor to indent the cochlear partition as illustrated in Fig. 1C, the CAP thresholds were elevated up to 20–30 dB at frequencies around 20 kHz, the BF place of the sensor, and ∼10 dB or less at lower and higher frequencies (dashed line in Fig. 3). The range of substantial (>10 dB) threshold elevation is between ∼12 and 24 kHz in both preparations. Thus, indenting the cochlear partition from the BM side produced a pronounced elevation in CAP threshold in the ∼20 kHz BF region where the probe was positioned, leading to a locally damaged condition.
Single-tone responses in locally damaged cochleae
Pre- and post-damage intracochlear pressure responses to single tones can be seen in Fig. 4. The sensor was positioned close to the BM in turn one of the gerbil cochlea, where the BF is ∼20 kHz. As shown in the normalized results of Figs. 4A, 4C, the responses were compressively nonlinear at frequencies around the BF (19 and 20 kHz, respectively) in the healthy condition. At frequencies more than approximately a half octave (factor of 0.7) below the BF the pressure responses overlaid each other, indicating linear scaling for these frequencies. Above that frequency there is a dramatic fanning out of the normalized responses in the peak region. In the plateau region above the peak, responses typically scale linearly as in Fig. 4A. After indenting the cochlear partition with the sensor ∼10 μm, the degree of nonlinearity in single-tone responses was diminished [Figs. 4B, 4D]. On the other hand, the responses at frequencies well below and well above the BF changed little. Therefore, the local damage to the cochlear partition led to a decrease in the degree of nonlinearity at frequencies around the BF, with little change in the responses at frequencies above and below.
The phase responses in Figs. 4E, 4F (ST pressure re: EC pressure) show traveling wave delay through ∼2 cycles. Post-damage, two changes occur. The high frequency phase plateau is encountered at lower frequencies, signifying that the fast, compression wave dominates the traveling wave at lower frequencies, which is to be expected since the nonlinear traveling wave response mode is diminished by the damage, but the linear fast response mode is not. (See our previous papers, Olson, 1999, 2001and Dong and Olson, 2005b for background on the multi-mode nature of intracochlear pressure.) A second change is that within the traveling wave region the phase accumulates more rapidly in the damaged preparation. This is consistent with reduced CP stiffness (Kolston, 2000). Thus the local damage has reduced the local cochlear nonlinearity, and also seems to have produced a reduction in the local stiffness of the CP.
Intracochlear DP and DPOAE of 2f1−f2
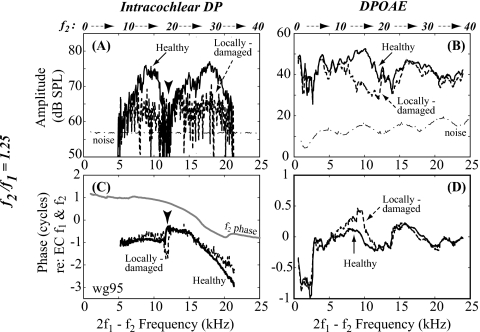
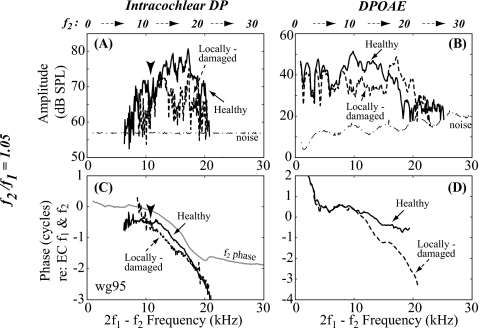
Simultaneous measurements of DP and DPOAE were obtained under normal and locally damaged conditions with f2∕f1 fixed at 1.25 (Fig. 5) and 1.05 (Fig. 6). The micro-pressure-sensor was positioned ∼10 μm from the BM. The response amplitudes and phases are plotted vs their own frequencies. Phases are referenced to EC f1 and f2 phases.
Figure 5.
2f1−f2 with f2∕f1=1.25 in the cochlea (DP) and ear canal (DPOAE) pre- and post-damage. (A) DP amplitude, measured at a distance ∼10 μm from the BM; (B) DPOAE amplitude; (C) DP phase; and (D) DPOAE phase. All phases are referenced to EC f1 and f2 phases. Solid and dashed lines represent cochlear condition, healthy or locally damaged. Gray line in panel (C) shows f2 phase. There was no change in the low frequency region below 6 kHz (wg95, L1=L2=80 dB SPL).
Figure 6.
2f1−f2 with f2∕f1=1.05 in the cochlea (DP) and ear canal (DPOAE) pre- and post-damage. Same format as Fig. 5 (wg95, L1=L2=80 dB SPL).
When f2∕f1 was fixed at 1.25, DP in the healthy cochlea showed fine structure superposed on double peaks separated by a deep notch [solid line in Fig. 5A]. One peak reached its maximum at ∼19 kHz BF and the other at ∼9 kHz. The phase [solid line in Fig. 5C] changed character at the notch frequency [arrowhead in Fig. 5C]. At frequencies around the BF the DP phase was similar to that of f2 [gray line in Fig. 5C], suggesting that the DP in this region was dominated by forward going distortion originating from more basal locations (Ren, 2004; Dong and Olson, 2005b; de Boer et al., 2008; Dong and Olson, 2008). In the frequency region well below the BF, the DP phase departed from the f2 phase and was more similar to the DPOAE phase [solid in Fig. 5D], suggesting that the DP was a combination of locally generated distortion, and apically generated distortion that was recorded on its way out of the cochlea (Dong and Olson, 2008). The f2 frequencies are indicated above the panels, and when combined with the results in Fig. 4, help to guide expectations on whether local nonlinearity probably contributed to those DPs, or whether they were probably produced remotely. Examination of Fig. 4A reveals that ∼12 kHz is the lowest frequency with substantial nonlinearity in single-tone responses. A 12 kHz f2 corresponds to a 7–8 kHz 2f1−f2 DP. Thus, the lower peak in Fig. 5A, which extends from 5 to 12 kHz, is probably a combination of both apically and locally generated nonlinear distortions. The pronounced notch in the amplitude at ∼12 kHz corresponded to a 180° phase shift [arrowheads in Figs. 5A, 5C], and appeared to result from cancellation of anti-phase components, probably a combination of basally generated∕forward traveling, apically generated∕backward traveling, and locally generated components. This notch was not seen in the DPOAE [see Figs. 5B, 5D], which reinforces that the locally measured DP has a different composition than the DPOAE. Post-damage, the amplitude of the DP decreased in both peaks. The lower frequency peak was greatly diminished above 7 kHz, but below 6 kHz the DP was little affected by the damage, consistent with the DP at these frequencies arising from more apical, undamaged regions. The phase changed relatively little [dashed lines in Fig. 5C] and still underwent a change in character at the notch frequency, which shifted up slightly in frequency.
In the healthy condition, the DPOAE was ∼40 dB SPL up to 24 kHz with fine structure in amplitude [solid line in Fig. 5B] and phase varying little and nonmonotonically with frequency [solid line in Fig. 5D]. After the cochlea was locally damaged the DPOAE changed. In the frequency region from ∼7 to 12 kHz, the DPOAE decreased, similar to the DP in that region [dashed line in Fig. 5B]. The small change in phase was similar in the DP and DPOAE. However, for DPOAEs with frequencies within the damaged region, the pre- and post-damage DPOAEs were similar, both in amplitude and phase. It appeared that the decrease in DP had little effect on the DPOAE in this frequency region, indicating that the DPOAE did not arise from its own best place. The relationship between local damage (as indicated in CAP changes) and DPOAE changes will be summarized in Fig. 8.
Figure 8.
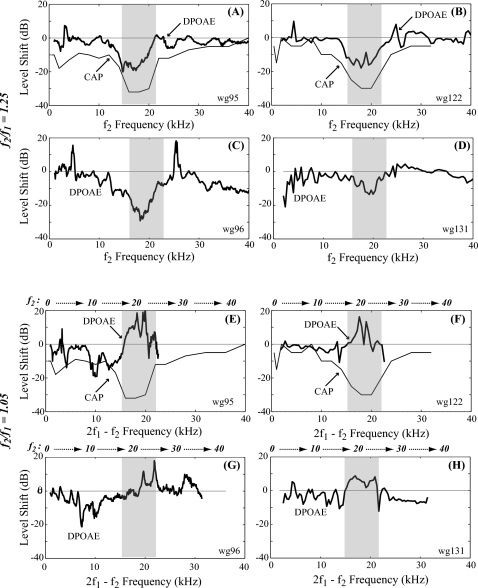
CAP threshold shifts and changes in 2f1−f2 DPOAE level upon local damage. Thick and thin lines show changes in DPOAE and CAP thresholds upon damage. [(A)–(D)] f2∕f1=1.25, plotted vs f2; [(E)–(H)] f2∕f1=1.05 plotted vs 2f1−f2 frequency. Data were from locally damaged experiments wg95, wg96, wg122, and wg131. Gray bands show the damaged region based on the sensor location (∼20 kHz region) and verified with CAP changes in animals wg95 and wg122.
When the primary ratio was 1.05, the changes in the locally damaged condition were different (Fig. 6). The pre-damage DP amplitude had similar tuning as the single-tone response (Fig. 4), but with more fine structure [solid line in Fig. 6A]. At 12 kHz, there was a shallow notch in the amplitude corresponding to an inflection in the phase slope [arrowheads in Figs. 6A, 6C]. At frequencies above 12 kHz, the DP peaked at the BF (19 kHz) and its phase was similar to that of f2 [gray line in Fig. 6C]. The DP tuning and its phase-vs-frequency slope at frequencies around the BF suggested that the DP was largely locally generated or basally generated∕forward going. At frequencies below 12 kHz, the well-sub-BF region, the phase differed from that of the forward f2 phase, which suggested that in this region the DP was not locally generated∕forward traveling and likely originated from a more apical place (Dong and Olson, 2008). After locally damaging the cochlea, the DP in the sub-BF region decreased around 10 kHz, and the phase steepened markedly [dashed line in Fig. 6C]. The steepened phase may indicate that the locally generated∕forward going type of the DP was diminished relative to the component that was traveling out of the cochlea from more apical regions. At frequencies above 12 kHz the amplitude of the DP decreased and its phase changed slightly, but maintained its forward going character.
Pre- and post-damage DPOAEs are shown in Figs. 6B, 6D. Pre-damage the DPOAE was at a level of ∼40 dB SPL, with fine structure and a sharp decrease for frequencies above ∼18 kHz. The phase had a fairly shallow slope, accumulating about 1 cycle over 20 kHz. There was a stair-step pattern superimposed on the shallow slope (see Talmadge et al., 1999), suggesting that the emission had contributions from components with both rapidly varying and slowly varying phase-vs-frequency slopes. Following damage, at frequencies from ∼9 to 17 kHz (just below the damaged region) the DPOAE amplitude decreased ∼10 dB and the phase steepened substantially. At frequencies in the damaged region (∼17–20 kHz) the DPOAE amplitude increased and the phase steepened.
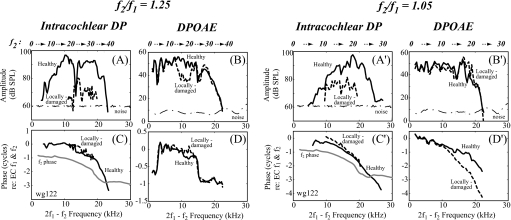
The variations in DP and DPOAE after local damage were confirmed by results in a second animal (wg122) shown in Fig. 7. When the wider ratio was examined the changes are very similar to those in Fig. 5. With the narrow ratio, the DPOAE changes are more subtle, but qualitatively similar to Fig. 6.
Figure 7.
2f1−f2 DP and DPOAE of animal wg122. DP was measured at ∼10 μm from the BM pre- and post-damage (L1=L2=80 dB SPL, f2 frequency step was 0.5 kHz). Same format as Fig. 5.
To summarize the findings, local damage reduced cochlear nonlinearity both in single-tone responses and in the locally measured DP. With primary ratio of 1.25, the DPOAE at frequencies slightly lower than the BFs of the damaged region decreased and changed little for frequencies close to the BFs of the damaged region, with little variation in phase. With relatively narrow primary ratio (1.05), the DPOAE decreased at frequencies slightly lower than the BFs of the damaged region, and increased at frequencies close to the BFs of the damaged region. The phase changed from slowly varying to rapidly varying with frequency.
Correlation between DPOAE and cochlear condition
A full understanding of the changes seen benefits from a direct comparison of changes in both CAP thresholds and DPOAE amplitudes. Using the results from the two animals that were shown in Figs. 3567, the level shifts of CAP threshold (pre-damage—post-damage) and DPOAE (post-damage—pre-damage) upon local damage are plotted together in Figs. 8A, 8B, 8E, 8F. The DPOAE variations upon damage from two additional local damage experiments are plotted in the other four panels. The sensor was broken and CAP data were not gathered post-damage in these animals but in all cases the sensor, which was used to cause damage, was positioned at the region with ∼20 kHz BF, indicated by gray bands. The DPOAE results are supportive of the results of the two main animals. The level shifts are plotted vs f2 when the primary ratio was 1.25, and vs 2f1−f2 when the primary ratio was 1.05, because these respective correlations were more instructive. (The f2 frequency is included at the top of each panel for reference.)
When the primary ratio was 1.25 [Figs. 8A, 8B, 8C, 8D], the reduction in DPOAE lined up with the damaged region (∼12–24 kHz according to CAP changes) with the maximum increase in CAP thresholds. Thus, when the f2 region was damaged, the DPOAE was reduced. With narrower primary ratio of 1.05, DPOAE enhancement lined up with the damaged area indicated by the CAP threshold shift [Figs. 8E, 8F]. A reduction in DPOAE level occurred at slightly lower frequencies.
DISCUSSION
The present study used localized intracochlear damage, localized measurements of intracochlear responses, and emission and CAP measures to explore the two-source model and more general questions of where emissions come from in the cochlea. The present study advances these questions with a well controlled damage location, and by probing the changes in intracochlear mechanics precisely at that location, while correlating the intracochlear measurements with DPOAE and CAP.
Our research used relatively high sound pressure levels. There is strong evidence for the two-source model at low sound pressure levels, where cochlear excitation patterns are expected to be fairly well localized (Mauermann et al., 1999b, 1999a; Kalluri and Shera, 2001). At moderate to high sound pressure levels the cochlear regions responsible for the emission appear to broaden due to the broadening of cochlear tuning with level (e.g., Knight and Kemp, 2001; Zhang and Mountain, 2008; Martin et al., 2008). In studies in humans, at moderate to high sound levels, an emission with rapidly varying phase was observed (Martin et al., 2008). Based on this phase character, the two-source model would categorize the emission as a reflector-type, and predict that it arose from reflection from around the fdp place. However, the suppression behavior of the emission indicated that it arose from basal to the f2 region. This suggests that the two-source model should be used with caution at moderate-high levels. The present study advances the understanding of DPOAE sources at relatively high primary levels, probing the limitations of the two-source model, and hopefully facilitating the use of high levels in the clinic, where high levels are often required to elicit emissions in impaired ears.
Previous studies have demonstrated the qualitative differences between emissions produced with narrow and relatively wide ratios, with narrow ratios giving rise to emissions with rapid phase variations, thought to be reflector-type emissions, and ratios above ∼1.2 giving rise to emissions possessing slow phase variations, thought to be generator-type emissions (Knight and Kemp, 2000; Kalluri and Shera, 2001; Knight and Kemp, 2001; Dhar et al., 2005). This dependence of emission type on ratio is expected when the phase interferences of the spatially disparate sources are taken into account (de Boer et al., 2005; Shera and Guinan, 2007a, 2007b). Our own previous work also showed this dichotomy, with the wider primary ratio giving rise to a generator-type emission, and the narrow primary ratio giving rise to a mixture of emission types (Dong and Olson, 2008). The present study supports the dichotomy.
Relationship between DPs and DPOAEs, regions that source the DPOAEs
The relationship between the intracochlear DP at one site in the cochlea, and the DPOAE was explored in a previous publication from our laboratory (Dong and Olson, 2008). A short review follows. After generation, a DP is subject to cochlear filtering and the measured DP frequency response is determined by both the tuning of the primaries and the subsequent tuning of the DP (Dong and Olson, 2005b, 2005a). As illustrated in Fig. 5 (wider primary ratio) and Fig. 6 (narrow primary ratio), at frequencies approximately the BF, DP amplitude tuning and phase are similar to those of the primaries (Cooper and Rhode, 1997; Robles et al., 1997; Dong and Olson, 2005b, 2005a, 2008). The DP appears to be dominated by local generation and∕or forward traveling, basally generated distortion [Figs. 5C, 6C, 7C, and 7(C′)]. At frequencies well below the BF, DP behavior is less primary-like. The DP normally shows more fine structure, similar to that in the DPOAE, and its phase departs from that of the primaries and is more like that of the DPOAE (e.g., Fig. 9 in Dong and Olson, 2008 and Fig. 8 in Rhode, 2007). Thus, at low frequencies, the DP appears to have a substantial contribution from apically generated distortion [Figs. 5C, 6C], traveling out of the cochlea. These basic observations underscore the fact that, except at primary frequencies substantially lower than the local BF, the local DP appears to be mainly locally generated or forward traveling and thus is not tightly linked to the DPOAE.
Figure 9.
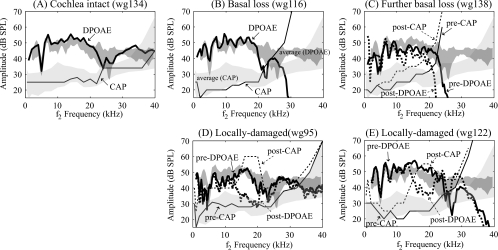
Using DPOAE to gauge the cochlear condition (five animals). The darker gray bands display average DPOAE and the lighter gray bands the average CAP thresholds across eight animals with normal CAP thresholds. The width of the bands indicates the standard deviation. The lines show DPOAE and CAP results from individual animals. The thicker lines show DPOAE levels, with the solid line pre-damage and the dotted line post-damage. The thinner lines show the corresponding CAP thresholds curves, solid pre-damage, and dotted post-damage. The DPOAE shown is at frequency 2f1−f2 with L1=L2=80 dB, f2∕f1=1.25.
The results after local damage in the present paper are consistent with this picture. We have noted that at the wider primary ratio (1.25), the 2f1−f2 emission appears to be dominated by the generator-type, and consider this case first. When the intracochlear probe and damage location (∼20 kHz place) was at the f2 place or somewhat basal to the f2 place (for example, f2 from 12 to 20 kHz in Fig. 5) both the DP and the DPOAE were reduced (Figs. 57). When f2 was less than 12 kHz (a situation with excitation patterns that peak substantially apically of the damage location) the emission was not affected. From this result it is clear that the emission source is localized to a region that includes the f2 place and extends somewhat basal (almost an octave). When the damaged location was somewhat apical to the f2 place, the intracochlear DP could be much reduced with little or no change in the DPOAE (Fig. 5, and Fig. 7 unprimed panels). Thus, regions apical to the f2 place appear to be not at all responsible for the generator-type emissions. This result makes sense, given the sharp apical drop off of the f2 response beyond its best place. Thus, these damage studies show that substantial DPs exist within the cochlea that are not detected in the emission—most certainly because they are traveling forward to be absorbed and not outward to become an emission.
With narrow primary ratio the mixture of emission types in the DPOAE is pronounced. In this case the DPOAE increased at frequencies in the damaged region, and decreased at frequencies slightly lower. Increases in DPOAEs after sound-induced cochlear lesions near the base have been reported previously (Kakigi et al., 1998b, 1998a). Based on the steepened phase post-damage, the changes (Figs. 67 primed) are interpretable as a relative increase in reflector-type emission and decrease in generator-type emission. With narrow ratio primaries the physical sites of generation and reflection emissions are not well separated, and the sizes of generator- and reflector-type of emissions in the healthy cochlea appear to be similar. The damaged region appears to cause a pronounced reflection. In the case of wider primary ratio of 1.25, there is no evidence for enhanced reflection—the emission goes down, and based on its phase, remains dominantly a generator-type emission.
Cochlear damage changed the relative contribution from different emission types
Relatively wide f2∕f1 ratio emissions can be used to gauge cochlear condition
The flat phase-vs-frequency response of the DPOAE observed when the primary ratio is fixed is the signature of a generator-type emission (Shera and Guinan, 1999). This occurs due to approximate “scaling symmetry,” which refers to the way the response pattern (amplitude and phase) shifts along the cochlea but does not change shape when primary frequencies are swept at constant ratio. The generator phase is therefore constant, giving rise to a flat phase-vs-frequency response in the emission. Consistent with the findings of others, we found that the generator-type emission dominated the DPOAE at the wider primary ratio in gerbils. We also found that when the region corresponding to f2 and basal—the putative generator region—was damaged, the DPOAE was reduced. This is illustrated in Fig. 9, which shows the covariance of the DPOAEs and CAP thresholds. The averaged DPOAE ± standard deviation from eight healthy ears is shown as the dark-gray band in each panel (stimulus level L1=L2=80 dB SPL, f2∕f1=1.25). Cochlear health was determined with CAP: When the cochlear condition was good, CAP thresholds were less than 40 dB up to 35 kHz. The CAP ± standard deviation of these animals is shown in the light gray band. In Fig. 9A results from a healthy cochlea are shown, with CAP the thin line and DPOAE the thick line. The DPOAEs were around 40 dB and could be recorded up to 40 kHz, and were similar to the averaged DPOAEs from healthy ears. Some animals had high frequency hearing loss at the start of measurement, caused by inadvertent surgical trauma or cooling upon opening the bulla, without or prior to purposeful local damage [Figs. 9B, 9C, 9E]. In these cases the DPOAE dropped off sharply above 25–30 kHz, and CAP thresholds increased sharply at these frequencies. Figure 9C documents increasing damage through two stages, indicated with solid and dotted lines (thick for DPOAE and thin for CAP). Figures 9D, 9E repeat the information in Fig. 8 showing the close correspondence between CAP threshold elevation and DPOAE decrease following local damage. These results indicate that the DPOAE with wider primary ratio can be used to gauge the cochlear condition in the f2 region. Looking at the DPOAE data from the panels in Fig. 9 with a “clinical” eye, it would be easy to pick out a cochlea with broad basal damage of unknown etiology [Figs. 9B, 9C, 9E] compared to the healthy∕normal DPOAE in the “healthy” ears in the dark-gray band. On the other hand, the bounded dips in DPOAE in Figs. 9D, 9E would be easy to pick out only if the pre-damage DPOAE data were also available from the same individuals. If only the post-damage data were available the dips observed would point to a region of possible cochlear damage to be followed up with further testing.
Changes in emission and intracochlear phase confirm changes in the dominance of the two emission types with narrow ratio
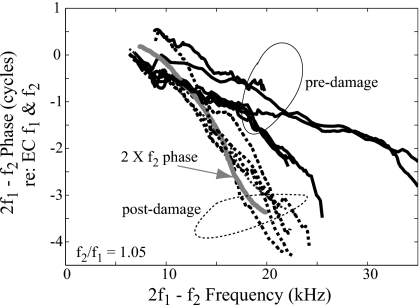
Steep phase-vs-frequency in the DPOAE at fixed f2∕f1 is the signature of dominance by reflector-type emissions (Stover et al., 1996; Shera and Guinan, 1999). In the two-source theory, this emission type arises due to linear coherent reflection from random perturbations along the cochlear partition (Zweig and Shera, 1995). The largest reflection is expected to be from the region where the traveling wave peaks, where the phase changes rapidly with frequency. On average, the phase-vs-frequency slope of the emission is predicted to be slightly less than twice the slope of the forward wave, due to the round trip travel in and out of the cochlea (Shera et al., 2008). With narrow primary ratios, the DPOAE phase at low SPL normally varies rapidly with frequency in humans (Knight and Kemp, 2000, 2001) and other mammals (e.g., Withnell et al., 2003) [and even non-mammals, but this is not the focus of the present paper (e.g., Meenderink et al., 2005)]. Often the emission type at narrow primary ratio appears mixed, with a shallow slope with superimposed variations. Many studies have been devoted to unmixing these components (e.g., Kalluri and Shera, 2001). By locally indenting the cochlear partition using our micro-pressure-sensor, the local cochlear nonlinearity was reduced, and stiffness perhaps reduced as noted above. The induced changes in cochlear mechanics led to the apparent decrease in the generator-type emission at frequencies somewhat less than the BF of the damaged region and relative increase in the reflector-type at frequencies in the vicinity of the damaged location’s BF [Figs. 6B, 6D, 7(B′) and 7(D′)]. Thus, in the BF frequency region, post-damage the phase was steep and the reflector-type emission appeared to be dominant. We evaluate this damage-induced phase change in Fig. 10, which shows a group of DPOAE phase results under pre- (solid lines) and post-damage conditions (dotted lines). Results from six animals are shown. A representative curve showing twice the forward traveling wave phase at the 20 kHz BF from one animal is also shown (gray line). The emission phase post-damage is quite similar to twice the forward traveling wave phase, confirming the notion that the rapidly varying emission phase is representative of the traveling wave in the cochlea, and can be used to estimate traveling wave delays.
Figure 10.
DPOAE pre- and post-damage phases. Data from experiments wg91, wg92, wg93, wg95, wg122, and wg131. The 20 kHz region was damaged either by locally indenting the BM or by the invasive intracochlear measurement. Solid and dashed lines represent the phase under healthy and locally damaged conditions, respectively. The DPOAE shown is at frequency 2f1−f2 with L1=L2=80 or 90 dB and f2∕f1=1.05. The gray line shows an example of two times forward f2 phase with BF ∼20 kHz.
SUMMARY
Locally indenting the cochlear partition raised CAP thresholds at frequencies within the targeted region and reduced local cochlear nonlinearity, including local DPs, and appeared to reduce the stiffness of the cochlear partition slightly. DPOAE changes following the local damage corresponded to the damaged region, with reductions at some frequencies and enhancements at others. The changes could be interpreted within the two-source framework of cochlear emissions, and indicated an increase in reflector- and a decrease in generator-type emissions. In addition, the results confirmed that for the low frequency sidebands, e.g., 2f1−f2, the generator-type dominates the DPOAE at relatively wide primary ratio (1.25) and both the generator- and reflector-type emissions contribute substantially at narrow primary ratio (1.05).
ACKNOWLEDGMENTS
We gratefully acknowledge the efforts of Glenis R. Long, Glen Martin, and an anonymous reviewer, who provided valuable comments on the manuscript. This work was funded by Grant No. 5R03DC009080 from the NIH∕NIDCD.
References
- Avan, P., Bonfils, P., Gilain, L., and Mom, T. (2003). “Physiopathological significance of distortion-product otoacoustic emissions at 2 f1-f2 produced by high- versus low-level stimuli,” J. Acoust. Soc. Am. 113, 430–441. 10.1121/1.1525285 [DOI] [PubMed] [Google Scholar]
- Cooper, N. P. (1998). “Harmonic distortion on the basilar membrane in the basal turn of the guinea-pig cochlea,” J. Physiol. 509, 277–288. 10.1111/j.1469-7793.1998.277bo.x [DOI] [PMC free article] [PubMed] [Google Scholar]
- Cooper, N. P. (2003). “Compression in the peripheral auditory system,” in Compression From Cochlear to Cochlear Implants, edited by Bacon S. P., Fay R. R., and Popper A. N. (Springer, New York: ), pp. 18–61. [Google Scholar]
- Cooper, N. P., and Rhode, W. S. (1997). “Mechanical responses to two-tone distortion products in the apical and basal turns of the mammalian cochlea,” J. Neurophysiol. 78, 261–270. [DOI] [PubMed] [Google Scholar]
- Dallos, P. (1992). “The active cochlea,” J. Neurosci. 12, 4575–4585. [DOI] [PMC free article] [PubMed] [Google Scholar]
- de Boer, E., Nuttall, A. L., Hu, N., Zou, Y., and Zheng, J. (2005). “The Allen-Fahey experiment extended,” J. Acoust. Soc. Am. 117, 1260–1266. 10.1121/1.1856229 [DOI] [PubMed] [Google Scholar]
- de Boer, E., Zheng, J., Porsov, E., and Nuttall, A. L. (2008). “Inverted direction of wave propagation (IDWP) in the cochlea,” J. Acoust. Soc. Am. 123, 1513–1521. 10.1121/1.2828064 [DOI] [PMC free article] [PubMed] [Google Scholar]
- Dhar, S., Long, G. R., Talmadge, C. L., and Tubis, A. (2005). “The effect of stimulus-frequency ratio on distortion product otoacoustic emission components,” J. Acoust. Soc. Am. 117, 3766–3776. 10.1121/1.1903846 [DOI] [PubMed] [Google Scholar]
- Dong, W., and Olson, E. S. (2005a). “Tuning and travel of two tone distortion in intracochlear pressure,” in Auditory Mechanisms: Processes and Models, The Ninth International Symposium, edited by Nuttall A. L., Ren T., Gillespie P., Grosh K., and de Boer E. (World Scientific, Portland, OR: ), pp. 56–62.
- Dong, W., and Olson, E. S. (2005b). “Two-tone distortion in intracochlear pressure,” J. Acoust. Soc. Am. 117, 2999–3015. 10.1121/1.1880812 [DOI] [PMC free article] [PubMed] [Google Scholar]
- Dong, W., and Olson, E. S. (2006). “Middle ear forward and reverse transmission in gerbil,” J. Neurophysiol. 95, 2951–2961. 10.1152/jn.01214.2005 [DOI] [PubMed] [Google Scholar]
- Dong, W., and Olson, E. S. (2008). “Supporting evidence for reverse cochlear traveling waves,” J. Acoust. Soc. Am. 123, 222–240. 10.1121/1.2816566 [DOI] [PubMed] [Google Scholar]
- Fahey, P. F., Stagner, B. B., Lonsbury-Martin, B. L., and Martin, G. K. (2000). “Nonlinear interactions that could explain distortion product interference response areas,” J. Acoust. Soc. Am. 108, 1786–1802. 10.1121/1.1308048 [DOI] [PubMed] [Google Scholar]
- Harding, G. W., and Bohne, B. A. (2004). “Temporary DPOAE level shifts, ABR threshold shifts and histopathological damage following below-critical-level noise exposures,” Hear. Res. 196, 94–108. 10.1016/j.heares.2004.03.011 [DOI] [PubMed] [Google Scholar]
- Harding, G. W., Bohne, B. A., and Ahmad, M. (2002). “DPOAE level shifts and ABR threshold shifts compared to detailed analysis of histopathological damage from noise,” Hear. Res. 174, 158–171. 10.1016/S0378-5955(02)00653-6 [DOI] [PubMed] [Google Scholar]
- Henley, C. M., Weatherly, R. A., Martin, G. K., and Lonsbury-Martin, B. (1996). “Sensitive developmental periods for kanamycin ototoxic effects on distortion-product otoacoustic emissions,” Hear. Res. 98, 93–103. 10.1016/0378-5955(96)00077-9 [DOI] [PubMed] [Google Scholar]
- Jock, B. M., Hamernik, R. P., Aldrich, L. G., Ahroon, W. A., Petriello, K. L., and Johnson, A. R. (1996). “Evoked-potential thresholds and cubic distortion product otoacoustic emissions in the chinchilla following carboplatin treatment and noise exposure,” Hear. Res. 96, 179–190. 10.1016/0378-5955(96)00058-5 [DOI] [PubMed] [Google Scholar]
- Kakigi, A., Hirakawa, H., Harel, N., Mount, R. J., and Harrison, R. V. (1998a). “Basal cochlear lesions result in increased amplitude of otoacoustic emissions,” Audiol. Neuro-Otol. 3, 361–372. 10.1159/000013806 [DOI] [PubMed] [Google Scholar]
- Kakigi, A., Hirakawa, H., Harel, N., Mount, R. J., and Harrison, R. V. (1998b). “Comparison of distortion-product and transient evoked otoacoustic emissions with ABR threshold shift in chinchillas with ototoxic damage,” Auris Nasus Larynx 25, 223–232. 10.1016/S0385-8146(98)00034-0 [DOI] [PubMed] [Google Scholar]
- Kalluri, R., and Shera, C. A. (2001). “Distortion-product source unmixing: A test of the two-mechanism model for DPOAE generation,” J. Acoust. Soc. Am. 109, 622–637. 10.1121/1.1334597 [DOI] [PubMed] [Google Scholar]
- Kemp, D. T. (1978). “Stimulated acoustic emissions from within the human auditory system,” J. Acoust. Soc. Am. 64, 1386–1391. 10.1121/1.382104 [DOI] [PubMed] [Google Scholar]
- Kemp, D. T. (1986). “Otoacoustic emissions, travelling waves and cochlear mechanisms,” Hear. Res. 22, 95–104. 10.1016/0378-5955(86)90087-0 [DOI] [PubMed] [Google Scholar]
- Kim, D. O. (1980). “Cochlear mechanics: Implications of electrophysiological and acoustical observations,” Hear. Res. 2, 297–317. 10.1016/0378-5955(80)90064-7 [DOI] [PubMed] [Google Scholar]
- Knight, R. D., and Kemp, D. T. (2000). “Indications of different distortion product otoacoustic emission mechanisms from a detailed f1,f2 area study,” J. Acoust. Soc. Am. 107, 457–473. 10.1121/1.428351 [DOI] [PubMed] [Google Scholar]
- Knight, R. D., and Kemp, D. T. (2001). “Wave and place fixed DPOAE maps of the human ear,” J. Acoust. Soc. Am. 109, 1513–1525. 10.1121/1.1354197 [DOI] [PubMed] [Google Scholar]
- Kolston, P. J. (2000). “The importance of phase data and model dimensionality to cochlear mechanics,” Hear. Res. 145, 25–36. 10.1016/S0378-5955(00)00067-8 [DOI] [PubMed] [Google Scholar]
- Konrad-Martin, D., Neely, S. T., Keefe, D. H., Dorn, P. A., and Gorga, M. P. (2001). “Sources of distortion product otoacoustic emissions revealed by suppression experiments and inverse fast Fourier transforms in normal ears,” J. Acoust. Soc. Am. 109, 2862–2879. 10.1121/1.1370356 [DOI] [PubMed] [Google Scholar]
- Long, G. R., Talmadge, C. L., and Lee, J. (2008). “Measuring distortion product otoacoustic emissions using continuously sweeping primaries,” J. Acoust. Soc. Am. 124, 1613–1626. 10.1121/1.2949505 [DOI] [PubMed] [Google Scholar]
- Lonsbury-Martin, B. L., and Martin, G. K. (1990). “The clinical utility of distortion-product otoacoustic emissions,” Ear Hear. 11, 144–154. 10.1097/00003446-199004000-00009 [DOI] [PubMed] [Google Scholar]
- Martin, G. K., Stagner, B. B., Fahey, P. F., and Lonsbury-Martin, B. L. (2008). “Steep and shallow phase gradient distortion product otoacoustic emissions arising basal to the primary tones,” J. Acoust. Soc. Am. 125, EL85–EL92. 10.1121/1.3073734 [DOI] [PMC free article] [PubMed] [Google Scholar]
- Martin, G. K., Stagner, B. B., Jassir, D., Telischi, F. F., and Lonsbury-Martin, B. L. (1999). “Suppression and enhancement of distortion-product otoacoustic emissions by interference tones above f2. I. Basic findings in rabbits,” Hear. Res. 136, 105–123. 10.1016/S0378-5955(99)00119-7 [DOI] [PubMed] [Google Scholar]
- Mauermann, M., Uppenkamp, S., van Hengel, P. W., and Kollmeier, B. (1999a). “Evidence for the distortion product frequency place as a source of distortion product otoacoustic emission (DPOAE) fine structure in humans. I. Fine structure and higher-order DPOAE as a function of the frequency ratio f2/f1,” J. Acoust. Soc. Am. 106, 3473–3483. 10.1121/1.428200 [DOI] [PubMed] [Google Scholar]
- Mauermann, M., Uppenkamp, S., van Hengel, P. W., and Kollmeier, B. (1999b). “Evidence for the distortion product frequency place as a source of distortion product otoacoustic emission (DPOAE) fine structure in humans. II. Fine structure for different shapes of cochlear hearing loss,” J. Acoust. Soc. Am. 106, 3484–3491. 10.1121/1.428201 [DOI] [PubMed] [Google Scholar]
- Meenderink, S. W., Narins, P. M., and van Dijk, P. (2005). “Detailed f1, f2 area study of distortion product otoacoustic emissions in the frog,” J. Assoc. Res. Otolaryngol. 6, 37–47. 10.1007/s10162-004-5019-0 [DOI] [PMC free article] [PubMed] [Google Scholar]
- Mills, D. M. (2002). “Interpretation of standard distortion product otoacoustic emission measurements in light of the complete parametric response,” J. Acoust. Soc. Am. 112, 1545–1560. 10.1121/1.1505021 [DOI] [PubMed] [Google Scholar]
- Mills, D. M. (2003). “Differential responses to acoustic damage and furosemide in auditory brainstem and otoacoustic emission measures,” J. Acoust. Soc. Am. 113, 914–924. 10.1121/1.1535942 [DOI] [PubMed] [Google Scholar]
- Olson, E. S. (1998). “Observing middle and inner ear mechanics with novel intracochlear pressure sensors,” J. Acoust. Soc. Am. 103, 3445–3463. 10.1121/1.423083 [DOI] [PubMed] [Google Scholar]
- Olson, E. S. (1999). “Direct measurement of intra-cochlear pressure waves,” Nature (London) 402, 526–529. 10.1038/990092 [DOI] [PubMed] [Google Scholar]
- Olson, E. S. (2001). “Intracochlear pressure measurements related to cochlear tuning,” J. Acoust. Soc. Am. 110, 349–367. 10.1121/1.1369098 [DOI] [PubMed] [Google Scholar]
- Olson, E. S. (2004). “Harmonic distortion in intracochlear pressure and its analysis to explore the cochlear amplifier,” J. Acoust. Soc. Am. 115, 1230–1241. 10.1121/1.1645611 [DOI] [PubMed] [Google Scholar]
- Patuzzi, R. B. (1986). “Cochlear micromechanics and macromechanics,” in The Cochlea, edited by Dallos P., Popper A. N., and Fay R. R. (Springer-Verlag, New York: ), pp. 186–257. [Google Scholar]
- Ren, T. (2004). “Reverse propagation of sound in the gerbil cochlea,” Nat. Neurosci. 7, 333–334. 10.1038/nn1216 [DOI] [PubMed] [Google Scholar]
- Rhode, W. S. (2007). “Distortion product otoacoustic emissions and basilar membrane vibration in the 6–9 kHz region of sensitive chinchilla cochleae,” J. Acoust. Soc. Am. 122, 2725–2737. 10.1121/1.2785034 [DOI] [PubMed] [Google Scholar]
- Robles, L., and Ruggero, M. A. (2001). “Mechanics of the mammalian cochlea,” Physiol. Rev. 81, 1305–1352. [DOI] [PMC free article] [PubMed] [Google Scholar]
- Robles, L., Ruggero, M. A., and Rich, N. C. (1997). “Two-tone distortion on the basilar membrane of the chinchilla cochlea,” J. Neurophysiol. 77, 2385–2399. [DOI] [PMC free article] [PubMed] [Google Scholar]
- Shera, C. A., and Guinan, J. J., Jr. (1999). “Evoked otoacoustic emissions arise by two fundamentally different mechanisms: A taxonomy for mammalian OAEs,” J. Acoust. Soc. Am. 105, 782–798. 10.1121/1.426948 [DOI] [PubMed] [Google Scholar]
- Shera, C. A., and Guinan, J. J., Jr. (2007a). “Cochlear traveling-wave amplification, suppression, and beamforming probed using noninvasive calibration of intracochlear distortion sources,” J. Acoust. Soc. Am. 121, 1003–1016. 10.1121/1.2404620 [DOI] [PubMed] [Google Scholar]
- Shera, C. A., and Guinan, J. J., Jr. (2007b). “Mechanisms of mammalian otoacoustic emission,” in Active Processes and Otoacoustic Emissions in Hearing, edited by Manley G. A., Fay R. R., and Popper A. N. (Springer, New York: ), pp. 305–342. 10.1007/978-0-387-71469-1_9 [DOI] [Google Scholar]
- Shera, C. A., Tubis, A., and Talmadge, C. L. (2008). “Testing coherent reflection in chinchilla: Auditory-nerve responses predict stimulus-frequency emissions,” J. Acoust. Soc. Am. 123, 3851. 10.1121/1.2935684 [DOI] [PMC free article] [PubMed] [Google Scholar]
- Stover, L. J., Neely, S. T., and Gorga, M. P. (1996). “Latency and multiple sources of distortion product otoacoustic emissions,” J. Acoust. Soc. Am. 99, 1016–1024. 10.1121/1.414630 [DOI] [PubMed] [Google Scholar]
- Talmadge, C. L., Long, G. R., Tubis, A., and Dhar, S. (1999). “Experimental confirmation of the two-source interference model for the fine structure of distortion product otoacoustic emissions,” J. Acoust. Soc. Am. 105, 275–292. 10.1121/1.424584 [DOI] [PubMed] [Google Scholar]
- Talmadge, C. L., Tubis, A., Long, G. R., and Piskorski, P. (1998). “Modeling otoacoustic emission and hearing threshold fine structures,” J. Acoust. Soc. Am. 104, 1517–1543. 10.1121/1.424364 [DOI] [PubMed] [Google Scholar]
- Trautwein, P., Hofstetter, P., Wang, J., Salvi, R., and Nostrant, A. (1996). “Selective inner hair cell loss does not alter distortion product otoacoustic emissions,” Hear. Res. 96, 71–82. 10.1016/0378-5955(96)00040-8 [DOI] [PubMed] [Google Scholar]
- Withnell, R. H., Shaffer, L. A., and Talmadge, C. L. (2003). “Generation of DPOAEs in the guinea pig,” Hear. Res. 178, 106–117. 10.1016/S0378-5955(03)00064-9 [DOI] [PubMed] [Google Scholar]
- Zhang, X., and Mountain, D. C. (2008). “Distortion product emissions: Where do they come from?,” in Concepts and Challenges in the Biophysics of Hearing, The Tenth International Workshop on the Mechanics of Hearing, edited by Cooper N. P. and Kemp D. T. (World Scientific, Keele, Staffordshire, UK: ), pp. 48–54.
- Zweig, G., and Shera, C. A. (1995). “The origin of periodicity in the spectrum of evoked otoacoustic emissions,” J. Acoust. Soc. Am. 98, 2018–2047. 10.1121/1.413320 [DOI] [PubMed] [Google Scholar]


