Abstract
Listeners attempted to localize 1500-Hz sine tones presented in free field from a loudspeaker array, spanning azimuths from 0° (straight ahead) to 90° (extreme right). During this task, the tone levels and phases were measured in the listeners’ ear canals. Because of the acoustical bright spot, measured interaural level differences (ILD) were non-monotonic functions of azimuth with a maximum near 55°. In a source-identification task, listeners’ localization decisions closely tracked the non-monotonic ILD, and thus became inaccurate at large azimuths. When listeners received training and feedback, their accuracy improved only slightly. In an azimuth-discrimination task, listeners decided whether a first sound was to the left or to the right of a second. The discrimination results also reflected the confusion caused by the non-monotonic ILD, and they could be predicted approximately by a listener’s identification results. When the sine tones were amplitude modulated or replaced by narrow bands of noise, interaural time difference (ITD) cues greatly reduced the confusion for most listeners, but not for all. Recognizing the important role of the bright spot requires a reevaluation of the transition between the low-frequency region for localization (mainly ITD) and the high-frequency region (mainly ILD).
INTRODUCTION
Sine tones with slow onsets or with masked onsets are localized on the basis of ongoing interaural level differences (ILDs) and interaural time differences (ITDs). The ILDs are mainly useful cues at high frequencies, where the head casts a significant shadow on the ear further from the source of sound.
The ITDs appear to provide the dominant localization cues for sine tones in free field at low frequencies (Wightman and Kistler, 1992; Hartmann and Wittenberg, 1996). However, as the frequency of the tone increases toward 1000 Hz and beyond, the ITD becomes an unreliable cue because the corresponding interaural phase difference (IPD) is close to 180°, causing the perceived direction of the ITD cue to be ambiguous. For a frequency of 1000 Hz, an IPD of 180° occurs for an azimuth near 41°, and as the azimuth increases to 50°, the IPD becomes −150°, i.e., reversed in sign.1 Perhaps because of this phase problem, the human nervous system becomes rapidly insensitive to ITDs in a steady sine tone as the tone frequency increases. Little or no ITD sensitivity is found at 1300 Hz and higher (Zwislocki and Feldman, 1956). There is a strong evolutionary advantage for such insensitivity because if the IPD sign is reversed, the ITD cue indicates a source direction that is opposite to the true direction. Better to have no cue at all than to have such a misleading cue.
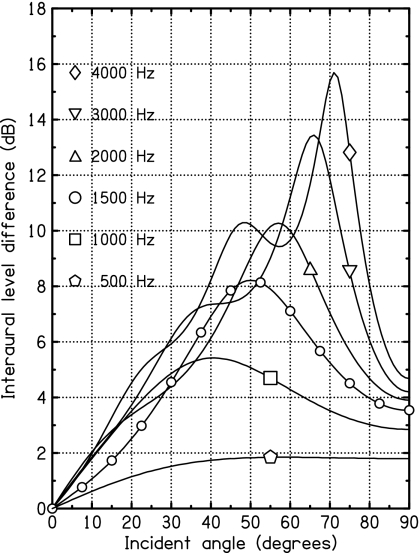
The loss of the ITD cue is not the only interaural change that occurs as the frequency of a tone increases beyond 1000 Hz. A second change is that the interaural level difference becomes a seriously non-monotonic function of azimuth because of the peculiar physics of wave diffraction around the head. Figure 1 shows the calculated ILD vs azimuth for six different frequencies. The ILD is a non-monotonic function of azimuth for all six. Theoretically, the ILD function shows non-monotonic behavior for all frequencies (even 500 Hz in Fig. 1), but that behavior becomes perceptually important only for 1000 Hz and higher. For a 1500-Hz tone, the peak ILD (at an azimuth of 50°) is larger than 8 dB. This can be compared to an ILD of less than 4 dB at 90°. The functions in Fig. 1 were calculated from a spherical-head diffraction model (Rschevkin, 1963; Kuhn, 1977) with antipodal ears (±90° from the forward direction). If the ears are further back on the head, the peak moves to smaller azimuths. For instance, for 1500 Hz, the peak moves from 50° to 41° as the ear angle increases from 90° to 100°.
Figure 1.
The interaural level difference plotted as a function of source azimuth (Incident angle) for tones of six different frequencies, as computed in the spherical-head model with antipodal ears. All six curves have a peak, but it is hard to see for 500 Hz.
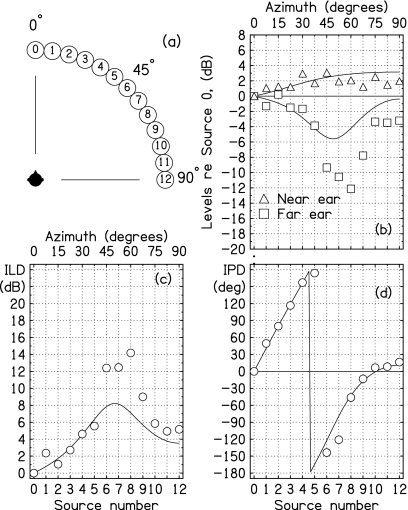
The origin of the non-monotonic ILD is the acoustical “bright spot.” According to Fresnel’s theory of diffraction, the intensity of a wave diffracted by a sphere is anomalously large at a location on the sphere directly opposite the direction of wave incidence. The bright spot, often called Poisson’s bright spot or Arago’s bright spot, was an important effect in demonstrating the wave nature of light (Hecht, 2002; Kelly et al., 2009).2 The acoustical effect is shown in panel (b) of Fig. 2 for a 1500-Hz tone. The solid lines show spherical-head calculations. The symbols show measurements made with a Knowles Electronics Manikin for Acoustics Research (KEMAR) (Burkhard and Sachs, 1975). Although the level in the ear near the source tends to grow with increasing azimuth, the level in the ear far from the source first decreases, then increases. The maximum far-ear level at 90° is the bright spot itself, but the approach to the bright spot is seen in the far ear for all angles greater than 50° or 60°. The difference between the near-ear and far-ear levels is the ILD, as shown in Fig. 2c. Because of the bright spot, the ILD is a non-monotonic function of azimuth. As Kuhn (1987) observed, significant non-monotonic behavior is characteristic of the ILD throughout the high-frequency region.
Figure 2.
Spherical-head computations (solid lines) and recordings in KEMAR ears (symbols). The sizes of the symbols indicate about 4 standard deviations. (a) The arrangement of loudspeakers and listener in the anechoic room. (b) The levels in near and far ears. Levels are plotted as functions of source azimuth for a 1500-Hz tone. They are referenced to the level at zero azimuth. (c) The ILD is the difference between near and far curves from part (b). The “near” ear is the right ear, and the “far” ear is the left ear. (d) Interaural phase difference.
The goal of the experiments reported in this article was to determine the perceptual consequences of the bright spot for large azimuths and relatively high frequency. Specifically, we hypothesized that at a frequency of 1500 Hz, the ITD would not be a useful cue and listeners could only rely on the ILD to encode the azimuth. Therefore, we expected that localization judgments would be dramatically misled by the non-monotonic character of the ILD. It was not completely obvious that this hypothesis would be supported experimentally. First, the theoretical curves and data in Fig. 2 might not apply to real listeners. Second, if they do apply, then perhaps listeners recognize the ambiguity of the ILD cues and have learned to cope with them. For example, Fig. 2b shows that there might be an opportunity for listeners to use the level information in the two ears separately to solve the azimuthal problem. As McFadden (1981) pointed out, peripheral interaural cues always require interpretation by higher-level functions.
EXPERIMENT 1: IDENTIFICATION
In an identification experiment, listeners were asked to identify the location of a loudspeaker producing a 1500-Hz sine tone. A frequency of 1500 Hz was chosen because of the large range of azimuths where the ILD slope is negative, as shown in Figs. 12c. Also, 1500 Hz is low enough that the spherical-head model predicts only a simple peak as a function of azimuth.
Method
Listeners were seated near the center of an anechoic room (IAC 107840) with interior dimensions of 3.0×4.3×2.4 m3. An L-shaped rod mounted to the back of the chair touched the top of the listener’s head to help him keep his head position fixed and facing in the forward direction. At a distance of 112 cm from the listener was an arc of 13 single-driver loudspeakers (Minimus 3.5), with azimuths varying in 7.5° increments over the range from 0° (forward direction) to 90°, as shown by the numbered circles in Fig. 2a. The loudspeaker cones were at the height of the listener’s ears, within a few centimeters. Listeners were familiar with the loudspeaker positions. A small drawing of the speaker array, with positions numbered 0–12 [Fig. 2a], was mounted below the front speaker (number 0) to remind listeners of the geometry.
Prior to the experiment, the level of each loudspeaker was measured using an omnidirectional microphone at the listener’s position with the chair removed. In the experiments that followed, the levels of the signals sent to loudspeakers were equalized so that all the loudspeakers produced the same level at the listener’s position, ±0.5 dB. Of course, the levels in the listener’s ears were ultimately not all the same, but depended on the speaker azimuth and the listener’s head. The reason for using constant source level (and not roving) was that preliminary experiments suggested that listeners would be confused by the non-monotonic ILD, and we wanted to give the listeners every possible advantage in performing the task. In principle, equal-level sources might allow the listeners to localize by using the levels in the two ears independently if they are able to do so.
During the experiment, a computer program generated the tone, selected one of the 13 sources at random, and played the tone twice via Tucker-Davis digital-to-analog converters (DD1). The listener’s task was to listen to the tones and to report the perceived azimuth verbally by an intercom. The experimenter then entered that choice into the computer for later analysis.
The tone level was 72 dBA at the listener’s position. To avoid onset and offset cues, the tone had rise and fall durations of 250 ms. Each of the two tones had a full-on duration of 500 ms, and there was a gap of 1.8 s between the two tones. It was expected that presenting the tone twice from the same loudspeaker would make listener judgments more reliable. The presentations were paced by the listener’s responses.
Each experimental run consisted of five passes through the set of loudspeakers. In any pass, each of the 13 speakers was presented once in random order. Thus, there were 65 decisions per run. A typical run lasted about 10 min. After a run, the listener could come out of the anechoic room and rest. There was no trial-by-trial feedback.
Physical measurements
While the experiment was in progress, each tone was measured using probe microphones in the listener’s two ear canals (Etymotic ER-7c system with matching preamplifier). Prior to conversion to digital form (Tucker-Davis DD1), the microphone signals were given an additional 40 dB of gain. The digital recordings were processed by matched filtering, which led to recorded amplitudes and phases in each ear. The left and right amplitudes and phases were used to compute ILD and IPD values. Because each speaker was chosen for five trials in a run and a tone was presented twice for each trial, there were ten independent measurements of ILD and IPD per run. These were then averaged over two runs (20 measurements) to find the interaural parameters for each speaker. All measured values of IPD were reduced to the range from −180° to +180°.
The ILD and IPD values obtained for source number 0 (directly ahead) were small. Their mean values were subtracted from the mean values of all the other sources so that the ILD and IPD values reported in this article represent the changes in interaural parameters caused by the angular displacement away from the forward direction.
Reliability of the acoustical measurements was tested by using the probe microphones to measure the signals in the ear canals of a KEMAR manikin. The probes were inserted ten different times to simulate different fittings for human listeners, and measurements were made each time. The measured values are shown by the symbols in Fig. 2b. The standard deviation across the ten different measurements was the size of a symbol or smaller.
Listeners
There were five listeners, all male. Listeners E, M, and N were in their twenties. Listener X was 35, and B was 56. All listeners had pure-tone thresholds within 15 dB of normal according to audiometric tests in the range 200–8000 Hz.
Results and discussion
In collecting the physical measurements, the experimenters monitored the measured levels and phases to verify correct operation. The standard deviations were examined to make sure that the measurements were not adversely affected by motion of the listener. Although the listeners’ head positions were minimally constrained, the data were collected without having to repeat any runs except for one listener.
Levels in the ear canals
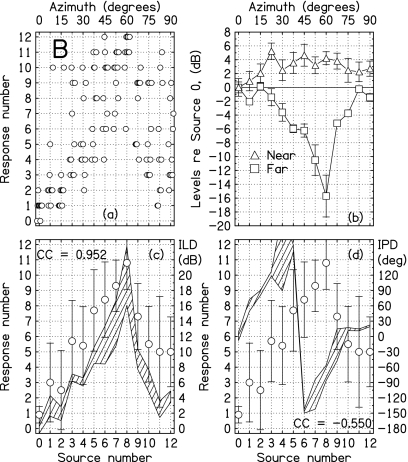
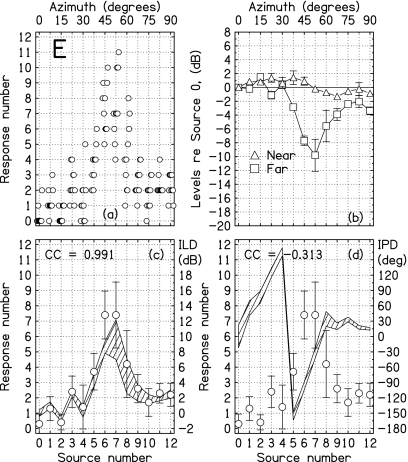
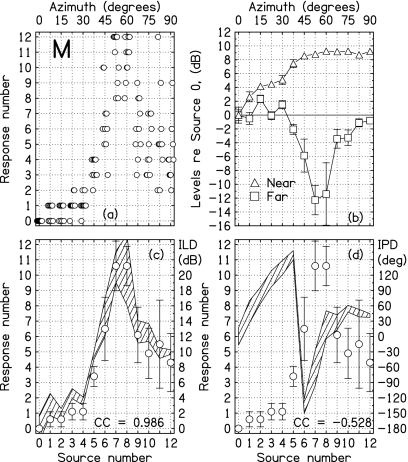
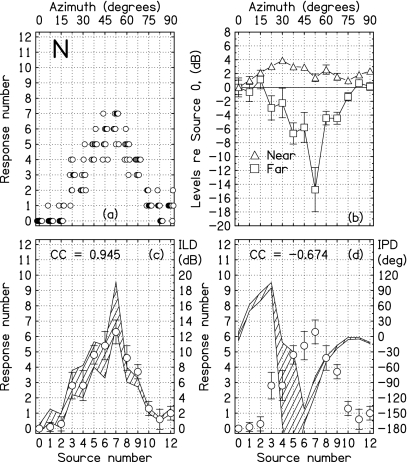
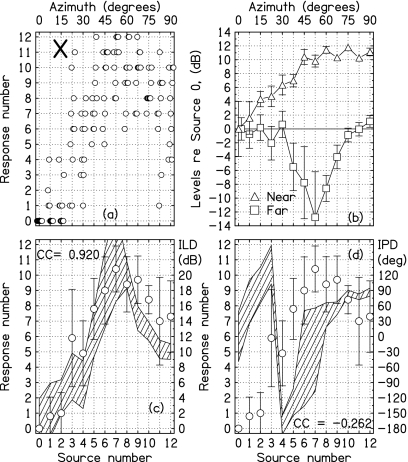
All data reported here are based on the two runs; a total of ten trials for each loudspeaker. The ear-level data are presented in the (b) parts of Figs. 34567 for listeners B, E, M, N, and X, respectively. The KEMAR data from Fig. 2 are the contribution to physical measurements from listener K.
Figure 3.
Identification responses and probe-microphone measurements for listener B. (a) Scatter plot showing all responses. Points have been slightly displaced horizontally for clarity. (b) Measured levels in near (right) and far (left) ears. Error bars are 2 standard deviations in overall length. (c) Listener identification responses on the scale 0–12, with error bars 2 standard deviations in overall length. Perfect performance would correspond to a 45° line. The hatched region shows the ILD. For each source, it is centered on the mean ILD, and the overall height of this region is 2 standard deviations. The ILD values were measured while the response data were being collected. (d) Identification responses as in part (c) plotted together with IPD. The hatched region shows the IPD. For each source, it is centered on the mean IPD, and the overall height is 2 standard deviations. The IPD values were measured while the response data were being collected.
Figure 4.
Same as Fig. 3, but for listener E.
Figure 5.
Same as Fig. 3, but for listener M.
Figure 6.
Same as Fig. 3, but for listener N.
Figure 7.
Same as Fig. 3, but for listener X.
In approximate agreement with the spherical-head diffraction model, the levels measured in the far ear showed a minimum near an azimuth of 50° (60° for listener B). The minima were of similar depth, ranging from –10 dB for listener E to –16 dB for listener B, and were all deeper than the prediction of –6 dB from the spherical-head model.
Although one might expect the levels in the near ear to be similar across the listeners because of the simple geometry, they were actually quite different. Two listeners, M and X, followed the prediction of the spherical-head model in that the levels tended to increase monotonically with azimuth, although the levels for these listeners rose by about 10 dB, to be compared with only 3 dB for the model. All the other listeners, including K, showed near-ear levels that were rather flat functions of azimuth, with some tendency to decrease near 70°.
ILD analysis
The ILDs shown in the (c) panels of Figs. 34567 are the differences between near and far-ear levels. For all listeners, the ILDs have a peak where the far-ear level was a minimum. Peaks are in the range of 20–23 dB for listeners B, M, and X. They are in the range of 10–16 dB for listeners E, K, and N. All peak ILDs are greater than the value of 8 dB predicted by the spherical-head model. The discrepancy is likely to be a result of the torso, which is not included in the model.
The ILDs in the (c) panels are plotted as hatched polygons, 2 standard deviations in height. Given the reliability of the microphone method indicated by the KEMAR test, the standard deviations are likely caused by listener motion. Some of the deviation occurred as the listener was reseated between the first and second runs.
Listener responses
The identification data reported here are based on the ten trials for each loudspeaker. The data are presented along with the physical measurements in Figs. 34567 for the five listeners. In the (c) panels, the identification responses are superimposed on the ILD plots. No attempt was made to plot the listener responses in a way that would coincide with the polygons depicting measured ILDs for individual listeners. The scaling rule for drawing the plots was 7.5° of response angle for 2 dB of ILD for all the listeners. Nevertheless, the responses and ILDs overlap rather well.
The correlation (Pearson product moment) between the average response and the average ILD, computed over the 13 sources, is given in the plots. Over the five listeners, the average correlation was 0.96 (sd=0.03). These high correlations clearly suggests that localization decisions were strongly influenced by the ILD.3
Sensitivity to ILD
For all listeners, the peak identification response occurred for the source (or sources) that led to the largest ILD. Listeners B, M, and X, with peak ILDs greater than 20 dB, all made peak responses greater than 10. Listeners E and N, with peak ILDs less than 16 dB, both made peak responses less than 8. The corresponding peak ILDs and peak responses suggest a common-sensitivity hypothesis. According to this hypothesis, all listeners have similar internal scales relating ILDs to azimuths, and listeners E and N gave smaller responses, simply because they experienced smaller ILDs.
To test the common-sensitivity hypothesis, the individual responses R were plotted as a two-parameter function, R=A[1−exp(−ILD∕C)]. The initial slope of this function is A∕C, and it serves as a measure of sensitivity to ILD. The largest slope was for listener B, 10°∕dB. The smallest was for listener N, 5°∕dB. The data for listener M did not have negative curvature and could not be fitted with the function. Listeners B, E, and X had similar slopes of 10°∕dB, 7.6°∕dB, and 7.1°∕dB, respectively. Therefore, the common-sensitivity hypothesis could account for the small peak response made by listener E. By contrast, the small peak response for listener N reflects a relative insensitivity to stimulus ILD.
IPD analysis
The IPDs in the (d) panels of Figs. 34567 are also plotted as polygons, again with overall heights showing 2 standard deviations in the measurements. In agreement with the spherical-head model, the IPDs all cross the 180° line for azimuths between 30° and 45°. There is one exception; the crossing occurs between 22° and 30° for listener X. Listener X also had the largest peak ILD and the widest head. The correlation between interaural parameters and head size was made clear in the scaling study by Middlebrooks (1999a, 1999b).
The identification responses from the (c) panels are repeated on the (d) panels for comparison with measured IPD. As shown by the correlation coefficient (cc) values on the (d) panels, the correlation between the responses and IPDs was negative for all the listeners. That negative correlation suggests that identification judgments were not much influenced by IPDs.
Individual-ear analysis
The strong correlation between ILD and response for all the listeners points to the ILD as a dominant cue for localization. However, there is additional localization information in the individual levels in left and right ears, and listeners might possibly benefit from that. A simple way to combine ILD with individual ear levels is, first, to observe that the nonmonotonic ILD presents the listener with an ambiguity and, second, to assume that individual ear levels might resolve that ambiguity. We called that strategy the “supplemental strategy.”
Supplemental strategy
We studied the supplemental strategy by beginning with the ILDs of all the sources to the right of the ILD peak, as shown in part (c) of Figs. 34567. For each of these source azimuths to the right of the peak, there corresponds at least one azimuth to the left of the peak (not necessarily at a source location) for which the ILD is the same. We asked whether either the near-ear levels or the far-ear levels (usually interpolated) for those ILD-ambiguous azimuths differed by more than 1 dB. If so, we assumed that the individual ear difference could resolve the ILD ambiguity. An ideal listener with complete information could successfully employ such a strategy.
Summed over the five listeners in Experiment 1, there were 24 ILD-ambiguous sources. The supplemental strategy successfully resolved the ambiguity for 19 of these. Therefore, this hypothesis predicts that Experiment 1 should show only a few non-monotonic identification responses, contrary to observation. Apparently, human listeners are not able to use all the information assumed by the supplemental strategy.
Separate-ears strategy
An alternative strategy, the “separate-ears strategy,” involves only the levels in the two ears separately. A simple separate-ears strategy begins by assuming that the listener determines source location based on the level in the far ear because the far ear shows the stronger azimuth dependence. However, as shown in parts (b) of Figs. 34567, the far-ear level is ambiguous because of the minimum in the level function. For every source azimuth to the right of the minimum, there is at least one azimuth (not necessarily at a source location) to the left of the minimum for which the far-ear level is the same. We assumed that a listener would try to resolve the ambiguity between two azimuths by considering the levels in the near ear. If the near-ear level for the larger azimuth is at least 1 dB greater than the near-ear level for the smaller azimuth (as it is for all but one of the sources in the spherical-head model), then we assumed that the separate-ears analysis would resolve the ambiguity.
Calculations using the separate-ears strategy indicated that listeners E and N should not be able to resolve the ambiguity for any of the ambiguous sources. However, calculations for listeners M and X predicted successful resolution for four of the five ambiguous sources for each listener. Calculations for listener B were intermediate between those for E and N on the negative side, and M and X on the positive side. They predicted successful resolution for two of the four sources that were ambiguous for listener B. A glance at the first column of Table 1 shows that the predictions of the separate-ears strategy are ordered the same as performance in Experiment 1. The average correlation for listeners E and N was 0.25. The average correlation for listeners M and X was 0.7. The correlation for listener B was intermediate; a value of 0.49.
Table 1.
Correlation between the source number and the listener’s response in four identification experiments. Experiments 1 and 2 used sine waves. Experiment 2 included training and feedback. Experiment 4 used AM. Experiment 5 used narrow-band noise.
| Listener | Expt.1 | Expt.2 | Expt.4 | Expt.5 |
|---|---|---|---|---|
| B | 0.49 | 0.49 | 0.98 | 0.91 |
| E | 0.29 | 0.49 | 0.82 | 0.86 |
| M | 0.64 | 0.71 | 0.63 | 0.67 |
| N | 0.20 | 0.28 | 0.99 | 0.99 |
| X | 0.76 | 0.78 | 0.86 | 0.93 |
| Av | 0.48 | 0.55 | 0.86 | 0.87 |
The above analysis of the separate-ears strategy, based on precise rules, does not differ from the impression that one gets merely by looking carefully at the (b) parts of Figs. 34567. Listeners M and X exhibited a large, approximately monotonic increase in near-ear level with increasing azimuth. Other listeners, especially E and N, did not. The problem with the separate-ears strategy as a hypothesis is that it predicts mostly monotonic responses for listeners M and X, but these listeners gave non-monotonic responses like those of the other listeners.
What can be said in conclusion is that all listeners were misled by the non-monotonic ILD, but some listeners may have found it possible to use the information in separate ears to improve their decisions. Evidence for some use of separate-ear information comes from the fact that the predictions of the separate-ears strategy correlate rather well with performance in Experiment 1.
EXPERIMENT 2: INFORMED IDENTIFICATION
Because listeners obviously were confused by the stimuli in Experiment 1, Experiment 2 attempted to teach listeners to make better use of the available cues. There were two phases: training and feedback (T∕F). The training phase was incorporated into the experiment runs. Each experiment run consisted of two data-collection passes through the 13 sources where the order of presentation of the sources was randomized on a pass. Prior to each of the two passes, there was a 1 min training pass, in which the sources were presented in ascending numerical order. The listener was alerted to the start of a training pass and knew what to expect. Each listener completed five runs, a total of ten data passes (by contrast, Experiment 1 had two runs of five passes).
A simple form of feedback was given after each trial as data were collected—one pilot lamp if the source had been in the range 0–6, the other pilot lamp if the source had been in the range 7–12. This binary feedback was adequate to resolve almost all of the ILD ambiguity.
Results
Table 1 shows the correlation between the listener’s response and the true source number for the ten passes of Experiment 1 (no T∕F) and the ten passes of Experiment 2 (with T∕F). It shows modest improvement in Experiment 2 for three of the five listeners. To better determine whether identification accuracy benefited from T∕F, the first five passes in Experiment 2 were compared with the first five passes in Experiment 1. Also, the second five passes in Experiment 2 were compared with the second five passes in Experiment 1. To determine whether continued T∕F led to improved accuracy, the first and second five passes were compared within Experiment 2. The statistic used to assess accuracy was again the correlation between the listener response and the source number.
For the first five passes, the correlation was improved by T∕F for three of the five listeners, and the mean increased from 0.46 to 0.52. For the second five passes the correlation improved for four of the five listeners, and the mean increased from 0.48 to 0.56. The correlation on the first pass of Experiment 2 was 0.52, and on the second pass, it was 0.56, a difference of 0.04 that might be attributed to learning.
The increases in correlations attributable to T∕F, as reported above, were clearly modest at best. By contrast, correlations between responses with and without T∕F were high. A round-robin comparison of first and second passes led to four correlations that ranged from 0.86 to 0.88. The conclusion of Experiment 2, incorporating training and feedback, was that listeners did learn from the experience, but they did not learn much. However, the training in Experiment 2 was not extensive, and it is possible that further training, or different training, might have been more effective.
EXPERIMENT 3: DISCRIMINATION
Experiment 3 was similar in its setup to Experiments 1 and 2. The stimuli were also similar, except that the two tones on each trial came from different loudspeakers. Thus, Experiment 3 had the form of a classic two-source two-interval discrimination experiment intended to determine acuity. From the listener’s perspective, the tones of a trial moved from left to right or moved from right to left along the arc. The listener’s task was to report the direction of motion by means of push buttons.
Method
With 13 loudspeakers, there were 78 ways to choose different pairs. To obtain adequate statistics, it was necessary to limit this number and select pairs. For each experimental run, six pairs of loudspeakers were selected based on predictions from the spherical-head calculations and from the identification data for the individual listener. Two pairs were selected because the previous data predicted that discrimination responses would be correct. Two others were selected because the data predicted incorrect responses, and two others were selected expecting uncertain responses. An experimental run included ten trials for each pair, presented in random order.
There were two experimental runs with different loudspeaker pairs selected for each. Therefore, each listener discriminated among 12 pairs, normally different for different listeners. The listeners from the identification experiments, Experiments 1 and 2, were also the listeners in Experiment 3. The timing and tone levels were the same as in Experiments 1 and 2. As in Experiments 1 and 2, ILD and IPD were measured in the discrimination experiment.
Predicting discrimination results
It is straightforward to use the results of the identification experiments to predict the results of discrimination experiments, assuming that the same sensory process applies to both experiments. If μm and μn are the mean identification responses for sources m and n, and if σm and σn are the corresponding standard deviations, then the expected value of d′ in an experiment that requires the listener to discriminate between sources m and n is
| (1) |
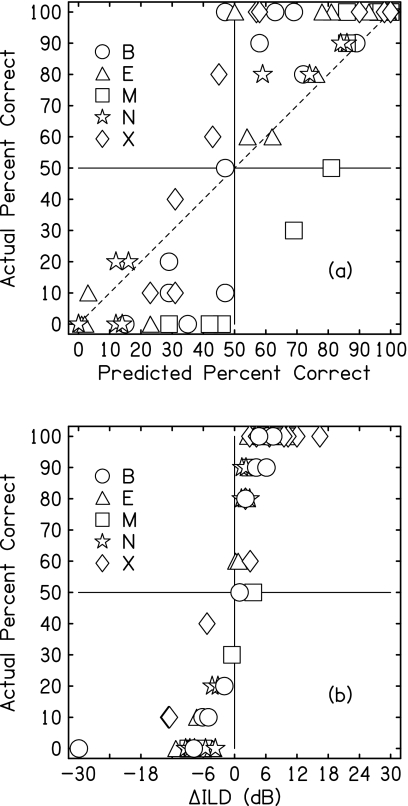
This value of d′ can be converted to percent correct on a two-interval forced-choice task. Such predicted values of percent correct appear on the horizontal axis in Fig. 8a.
Figure 8.
Experiment 3, Discrimination. (a) The predicted percent correct and the actual percent correct are plotted against each other for the five listeners. Predicted values were based on individual identification data from Experiment 1. (b) Same as part (a) except that the actual percent correct is plotted against the change in ILD between the greater and lesser source numbers.
Results
The comparison between the discrimination responses of Experiment 3 and the predictions are shown in Fig. 8a for the five listeners. The predictions were successful to some degree because almost all of the data points fell into the upper-right and lower-left quadrants of the plot. Points in the low-left quadrant correspond to systematic discrimination errors and show that the confusions in identification caused by the bright spot reappear in discrimination.
The shape of the predictions in Fig. 8a is different from the responses. The predictions were on a continuum from 0% to 100% correct. The responses tended to be bimodal. Evidently listeners were much more certain about whether one source was to the right or left of another than they were about the absolute locations of the two sources involved. Informally, listeners remarked that the discrimination task seemed easier than the identification task.
The discrepancy between the actual and predicted results in Fig. 8a is unlikely to be the result of technical error. As per Moore et al. (2008), who obtained a good correspondence between identification and discrimination, values of μ and σ in Eq. 1 were taken from source-dependent behavioral data. The problem is likely that the values of σ were obtained from identification experiments that covered a wide angular span. As noted by Shelton and Searle (1978), the standard deviation in identification experiments grows with both azimuth and with angular span. The effect was modeled by Hartmann and Rakerd (1989) as a sensory bias, which may rove in an experiment that is extensive over both azimuth and time. The increased standard deviation in identification would lead to a continuous form of the predicted results, as in Fig. 8a.
In addition to sensory bias, the identification experiment may have suffered from a peculiar form of response bias. Subjects who know that there are 13 sources may expect to perceive all 13 over the course of an experiment. When many trials have occurred, and all of them point to only half of the sources, subjects may try to compensate. Response bias like this is one way to account for the scatter of data in the (a) parts of Figs. 34567, particularly for listeners B, M, and X. These are the listeners whose data depart most dramatically from the 45° line in Fig. 8a.
An alternative to a discrimination prediction based on identification data is a prediction based on physical data. Figure 8b shows the comparison between the discrimination responses and the change in ILD between the two sources. A comparison with Fig. 8a indicates that the change in ILD, especially the sign of the change, is a much better predictor of discrimination than is the identification performance. Only when the change in ILD was less than about 4 dB did the listeners tend to give ambiguous responses.
EXPERIMENT 4: AMPLITUDE MODULATION
Experiment 4 was an identification experiment like Experiment 1, except that the tone was given 100% amplitude modulation (AM) with a modulating frequency of 100 Hz. The temporal window for the AM tone was the same as for Experiment 1.
The motivation for the experiment was that the envelope of AM tones provides a temporal pattern that enables the binaural system to use ITDs, even at a relatively high frequency such as 1500 Hz (Henning, 1974; McFadden and Pasanen, 1976; Stellmack et al., 2005). The 100-Hz modulation frequency was well below the 800-Hz limit found in the superior olive by Joris and Yin (1998) and in references contained therein. The 200-Hz bandwidth is close to the auditory filter width at 1500 Hz, measured by Glasberg and Moore (1990). The listeners for previous experiments were listeners in Experiment 4.
Results
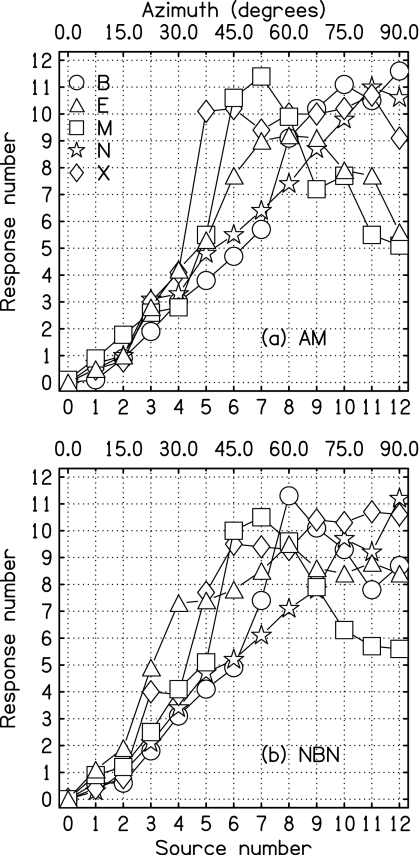
The results of Experiment 4 are shown for the five listeners by individual plots, showing response number vs source number in Fig. 9a. The figure shows that the responses for listeners B, N, and X became monotonic functions of azimuth or nearly so. However, the responses for listeners E and M remained non-monotonic. As shown in Table 1, the correlation between response and source numbers was 0.98 or greater for listeners B and N. Although listener E’s responses remained non-monotonic, the correlation increased considerably, compared to Experiment 1, an increase from 0.29 to 0.82. By contrast, the addition of AM led to no change in the responses of listener M by any of our measures.
Figure 9.
(a) Experiment 4, AM: Listener identification responses on the scale 0–12 to sources as numbered on the horizontal axis for five listeners. The stimulus was a 1500-Hz sine tone amplitude modulated by a 100-Hz sine tone. (b) Experiment 5, NBN: Same as (a) except that the stimulus was a 200-Hz band of noise centered on 1500 Hz.
EXPERIMENT 5: NARROW-BAND NOISE
In Experiment 5, the sine tone of Experiment 1 was replaced by a narrow-band noise (NBN). Again, the motivation for the experiment was to determine if temporal features in the envelope of the stimulus could provide an ITD cue that would enable localization at large azimuth. It might be expected that NBN would be more effective than AM because of the wider range of envelope-variation frequencies.
The experiment used equal-amplitude, random-phase noise with a spectrum consisting of 201 components spanning the range 1400–1600 Hz. Therefore, the bandwidth was the same as for Experiment 4. There were actually 13 different noises, based on different phase randomizations, selected randomly for each experimental trial. The temporal window for the noise was the same as for Experiment 1. The same listeners participated.
Results
The results of Experiment 5 (NBN) are presented in Fig. 9b, which can be compared with Experiment 4 (AM) in Fig. 9a. The data for listeners N and X look very similar for AM and NBN, which was the expected result. Compared to the results for AM, the results for listener E became more monotonic, and the results for listener B became less. Listener M was no more aided by NBN than by AM. His results were unchanged by any measure. Table 1 shows that the correlations between listener responses, and source numbers were similar in Experiments 4 and 5.
The experiments incorporating AM or NBN show that for most of the listeners, the temporal structure in the envelope can be used to solve the localization problem given an ambiguous ILD. [Experiments by Eberle et al. (2000) suggest that there would be little value in attempting to combine NBN with AM to obtain additional time structure.] However, for some listeners, listener M in particular, the timing information in the envelope proved to be insignificant, compared to the ILD cue.
DISCUSSION AND CONCLUSION
The experiments of this article demonstrated the importance of the information, and misinformation, contained in the ILD for medium-frequency pure tones such as 1500-Hz pure tones. Experiment 1 showed that the non-monotonic ILD, predicted by the bright-spot theory and the spherical-head model, occurred for real listeners, and that it led to a parallel non-monotonic perception of azimuth in a source-identification experiment. Experiment 2 showed that the misleading effects of the non-monotonic ILD were not alleviated by training the listeners nor by giving them feedback after every trial. Experiment 3 showed that the confusion indicated in the identification experiments translated to predictable confusion in the discrimination experiments. However, the ILD values themselves were better predictors of discrimination performance than were the results of identification experiments, because the discrimination experiments showed smaller within-subject variability than the identification experiments. The increased variability in identification could be attributed to both sensory bias and response bias.
A foreshadowing of the bright-spot effects seen in Experiments 1–3 on pure tones appeared in the discrimination experiments by Mills (1958, 1972). Mills measured the minimum audible angle (MAA) as a function of reference angle and frequency with the following results.
For reference angles in the forward direction (azimuth 0), the MAA demonstrated a familiar behavior: For low frequencies, the MAA was matched by the just noticeable difference (JND) in ITD, as measured by headphone experiments. When the frequency increased to 1500 Hz, the MAA (about 3°) was matched by the JND in ILD, indicating that the ITD had lost its effectiveness.
When the reference azimuth increased to 30°, the MAA between 1500 and 4000 Hz increased to about 6°, but was otherwise well behaved, indicating that the ILD provided a useful cue.
However, when the reference angle increased to 60° or 75°, the MAA went off the chart as the frequency rose to 1500 Hz. In Mills’ own words, “for tones between 1500 and 2000 Hz, from sources at azimuths of more than 45°, the minimum audible angle is indeterminately large.”
The anomalous behavior reported by Mills finds a ready explanation in the calculations, measurements, and perceptual consequences of the bright spot, as reported in the present article. It is exactly these frequencies and these reference azimuths, where the ILD is a decreasing function of azimuth. The more the source moves to the right, the more the listener hears it to the left. Discrimination measurements like the MAA are bound to fail under such conditions, as shown by the results in Experiment 3 above.
The results of Experiments 1–3 have implications for the duplex theory of pure-tone localization. According to the version of duplex theory by Stevens and Newman (1936), there are three frequency regions. In a low-frequency region, below about 1 kHz, localization is cued by the ITD. In a high-frequency region, above 4 kHz, localization is cued by the ILD. In a middle region, extending from about 1 to 4 kHz, neither ITD nor ILD is an effective cue. Stevens and Newman based this viewpoint on localization experiments that showed a broad peak in localization error, centered on 3 kHz. Errors were notably smaller when the frequency increased to 4 or 5 kHz. These experiments measured localization errors over the full 180° from front to back, around the right side of the listener. Therefore, these experiments encountered the angles and the frequencies where the experiments of the present article find that ILD is a non-monotonic function of azimuth. This non-monotonic behavior above 1 kHz leads to large localization errors. We suggest that Stevens and Newman would have found very different results if they had limited their localization task to azimuths within 40° of the midline. ILDs in the region from 1 to 4 kHz can be large enough to support good localization near the forward direction, with errors much smaller than reported by Stevens and Newman.
It is possible that a localization experiment that avoided the azimuthal region of non-monotonic ILD would find that the midfrequency region identified by Stevens and Newman (also observed by Mills) would disappear. Alternatively, a region of relatively poor localization might emerge centered near 1 kHz because of the peak in ILD difference limen observed by Grantham (1984). Grantham speculated that this peak reflected a greater localization utility for interaural cues at frequencies, both above and below 1 kHz. Frequencies above 1 kHz are useful because of the increased ILD; frequencies below 1 kHz are useful because latency in peripheral neurons converts an ILD into an ITD.
A different explanation for the 1-kHz peak observed by Grantham is also based on localization utility. Figure 1 suggests that near 1 kHz, non-monotonic ILDs are present at rather small azimuths, 40° to 50°. Even smaller azimuths would be expected from more realistic models of the human head. At frequencies well above 1 kHz, the non-monotonic behavior is much more dramatic, but it occurs only for larger azimuths. One can speculate that azimuths within 45° of the midline are particularly important, and that binaural development has been influenced by the unreliability of ILDs at these relatively small azimuths and at frequencies near 1 kHz.
An anonymous reviewer of this article pointed out that the non-monotonic ILD caused by the bright spot has implications for front-back localization. Normally, a listener is able to resolve front-back ambiguities by rotating the head slightly because rotation causes the ILD to change in a way that favors the ear that is approaching the source (Wallach, 1939, 1940; Perrett and Noble, 1997). However, if the ILD is a decreasing function of the azimuth, the sign of the ILD change will be reversed, thus cueing the front direction when the source is in the back and vice versa. For a frequency of 1500 Hz, this kind of reversal would be expected for all sources having a lateral angle of 55° or more (e.g., 65° azimuth vs 115°).
Experiments 4 and 5 modified the stimulus by adding temporal structure to the envelope of the tone, which significantly reduced the confusion in source identification on the average. However, the effectiveness of the temporal structure varied. For different listeners, it ranged from completely effective to not-at-all effective.
The modulated pure tone is a stimulus with two localization cues, the ILD in the entire tone, and the ITD in the envelope modulation. Experiments 4 and 5 indicated that different listeners weight these two cues differently. This observation is consistent with a general model of sound localization, wherein different, possibly conflicting, localization cues arrive at a central processor in the nervous system where they are combined to form a localized image. The process of weighting and combining the cues is normally entirely subconscious. A model of localization or lateralization that depends on idiosyncratic central weighting of cues has long been a possible interpretation of ITD-ILD trading experiments (e.g., Hafter and Carrier, 1972). Survey experiments by McFadden et al. (1973) found an anomalously large sensitivity for one of these cues or the other in 50% of the population, and of these, 75% were more sensitive to the ILD. The failed attempts to retrain listeners described by Jeffress and McFadden (1971) indicate that, although the weighting is not necessarily hard wired, it is very resistant to change. The central weighting hypothesis gained practical value in connection with experiments on the localization of sound in rooms, where standing waves lead to conflicting cues (Hartmann, 1983; Rakerd and Hartmann, 1985). Such a central model of cue combination would seem to apply to the highly individualized weighting of cues observed in Experiments 4 and 5.
ACKNOWLEDGMENTS
Mr. Zachary Ryan provided important technical help in the early phases of this work, supported by the NSF REU program in the Department of Physics and Astronomy at Michigan State University. This work was mainly supported by the NIDCD of the NIH under Grant No. DC 00181.
Footnotes
The calculations are from the low-frequency limit of the diffraction formula, where the ITD is given by (3r∕c)sin θ, where r is the radius of the head, c is the speed of sound, and θ is the azimuth with respect to the forward direction (Kuhn, 1977).
The classic optical bright spot is at the center of a shadow cast by the sphere on a screen. A bright spot on the dark surface of the sphere itself is caused by the same physics—constructive addition of diffracted waves at a symmetry point.
Because a sine tone, as used in these experiments, conveys so little localization information, a listener’s association of an ILD cue with a location in the horizontal plane occurs partly because the listener can see sources in that plane. Because of the cone of confusion, or the equivalent for real heads, many other source locations would also correspond to a given ILD cue.
References
- Burkhard, M. D. and Sachs, R. M. (1975). “Anthropomorphic manikin for acoustics research,” J. Acoust. Soc. Am. 58, 214–222. 10.1121/1.380648 [DOI] [PubMed] [Google Scholar]
- Eberle, G., McAnally, K. I., Martin, R. L., and Flanagan, P. (2000). “Localization of amplitude modulated high-frequency noise,” J. Acoust. Soc. Am. 107, 3568–3571. 10.1121/1.429428 [DOI] [PubMed] [Google Scholar]
- Glasberg, B. R., and Moore, B. C. J. (1990). “Derivation of auditory filter shapes from notched noise data,” Hear. Res. 47, 103–138. 10.1016/0378-5955(90)90170-T [DOI] [PubMed] [Google Scholar]
- Grantham, D. W. (1984). “Interaural intensity discrimination: Insensitivity at 1000 Hz,” J. Acoust. Soc. Am. 75, 1191–1194. 10.1121/1.390769 [DOI] [PubMed] [Google Scholar]
- Hafter, E. R., and Carrier, S. C. (1972). “Binaural interactions in low-frequency stimuli: The inability to trade time and intensity completely,” J. Acoust. Soc. Am. 51, 1852–1862. 10.1121/1.1913044 [DOI] [PubMed] [Google Scholar]
- Hartmann, W. M. (1983). “Localization of sound in rooms,” J. Acoust. Soc. Am. 74, 1380–1391. 10.1121/1.390163 [DOI] [PubMed] [Google Scholar]
- Hartmann, W. M., and Rakerd, B. (1989). “On the minimum audible angle—A decision theory approach,” J. Acoust. Soc. Am. 85, 2031–2041. 10.1121/1.397855 [DOI] [PubMed] [Google Scholar]
- Hartmann, W. M., and Wittenberg, A. T. (1996). “On the externalization of sound images,” J. Acoust. Soc. Am. 99, 3678–3688. 10.1121/1.414965 [DOI] [PubMed] [Google Scholar]
- Hecht, E. (2002). Optics (Addison-Wesley, San Francisco, CA: ), p. 494. [Google Scholar]
- Henning, G. B. (1974). “Detectability of interaural delay in high-frequency complex waveforms,” J. Acoust. Soc. Am. 55, 84–90. 10.1121/1.1928135 [DOI] [PubMed] [Google Scholar]
- Jeffress, L. A., and McFadden, D. (1971). “Differences of interaural phase and level in detection and lateralization,” J. Acoust. Soc. Am. 49, 1169–1179. 10.1121/1.1912479 [DOI] [PubMed] [Google Scholar]
- Joris, P. X., and Yin, T. C. T. (1998). “Envelope coding in the lateral superior olive III. Comparison with afferent pathways,” J. Neurophysiol. 79, 253–269. [DOI] [PubMed] [Google Scholar]
- Kelly, W. R., Shirley, E. L., Migdall, A. L., Polyakov, S. V., and Hendrix, K. (2009). “First and second order Poisson spots,” Am. J. Phys. 77, 713–720. 10.1119/1.3119181 [DOI] [Google Scholar]
- Kuhn, G. F. (1977). “Model for the interaural time differences in the azimuthal plane,” J. Acoust. Soc. Am. 62, 157–167. 10.1121/1.381498 [DOI] [Google Scholar]
- Kuhn, G. F. (1987). Directional Hearing, edited by Yost W. A. and Gourevitch G. (Springer, New York: ), pp. 3–25. [Google Scholar]
- McFadden, D. (1981). “The problem of different interaural time differences at different frequencies,” J. Acoust. Soc. Am. 69, 1836–1837. 10.1121/1.385924 [DOI] [Google Scholar]
- McFadden, D., Jeffress, L. A., and Russell, W. E. (1973). “Individual differences in sensitivity to interaural differences in time and level,” Percept. Mot. Skills 37, 755–761. [DOI] [PubMed] [Google Scholar]
- McFadden, D., and Pasanen, E. G. (1976). “Lateralization at high frequencies based on interaural time differences,” J. Acoust. Soc. Am. 59, 634–639. 10.1121/1.380913 [DOI] [PubMed] [Google Scholar]
- Middlebrooks, J. C. (1999a). “Individual differences in external-ear transfer functions reduced by scaling in frequency,” J. Am. Stat. Assoc. 106, 1480–1492. [DOI] [PubMed] [Google Scholar]
- Middlebrooks, J. C. (1999b). “Virtual localization improved by scaling nonindividualized external-ear transfer functions in frequency,” J. Acoust. Soc. Am. 106, 1493–1510. 10.1121/1.427147 [DOI] [PubMed] [Google Scholar]
- Mills, A. W. (1958). “On the minimum audible angle,” J. Acoust. Soc. Am. 30, 237–246. 10.1121/1.1909553 [DOI] [Google Scholar]
- Mills, A. W. (1972). Foundations of Modern Auditory Theory, edited by Tobias J. (Academic, New York: ). [Google Scholar]
- Moore, J. M., Tollin, D. J., and Yin, T. C. T. (2008). “Can measures of sound localization acuity be related to the precision of absolute location estimates?,” Hear. Res. 238, 94–109. 10.1016/j.heares.2007.11.006 [DOI] [PMC free article] [PubMed] [Google Scholar]
- Perrett, S., and Noble, W. (1997). “The effect of head rotations on vertical plane sound localization,” J. Acoust. Soc. Am. 102, 2325–2332. 10.1121/1.419642 [DOI] [PubMed] [Google Scholar]
- Rakerd, B., and Hartmann, W. M. (1985). “Localization of sound in rooms II: The effects of a single reflecting surface,” J. Acoust. Soc. Am. 78, 524–533. 10.1121/1.392474 [DOI] [PubMed] [Google Scholar]
- Rschevkin, S. N. (1963). A Course of Lectures on the Theory of Sound, translated by P. E. Doak (Pergamon, New York: /McMillan, New York: ). [Google Scholar]
- Shelton, B. R., and Searle, C. L. (1978). “Two determinants of localization acuity in the horizontal plane,” J. Acoust. Soc. Am. 64, 689–691. 10.1121/1.381995 [DOI] [PubMed] [Google Scholar]
- Stellmack, M. A., Viemeister, N. F., and Byrne, A. J. (2005). “Discrimination of interaural phase differences in the envelopes of sinusoidally amplitude modulated 4-kHz tones as a function of modulation depth,” J. Acoust. Soc. Am. 118, 346–352. 10.1121/1.1923370 [DOI] [PubMed] [Google Scholar]
- Stevens, S. S., and Newman, E. B. (1936). “The location of actual sources of sound,” Am. J. Psychol. 48, 297–306. 10.2307/1415748 [DOI] [Google Scholar]
- Wallach, H. (1939). “On sound localization,” J. Am. Stat. Assoc. 10, 270–274. [Google Scholar]
- Wallach, H. (1940). “The role of head movements and vestibular and visual cues in sound localization,” J. Exp. Psychol. 27, 339–368. 10.1037/h0054629 [DOI] [Google Scholar]
- Wightman, F. L., and Kistler, D. J. (1992). “The dominant role of low-frequency interaural time differences in sound localization,” J. Acoust. Soc. Am. 91, 1648–1661. 10.1121/1.402445 [DOI] [PubMed] [Google Scholar]
- Zwislocki, J., and Feldman, R. S. (1956). “Just noticeable differences in dichotic phase,” J. Acoust. Soc. Am. 28, 860–864. 10.1121/1.1908495 [DOI] [Google Scholar]


