Abstract
A structural magnetic resonance imaging study has revealed that pharyngeal articulation varies considerably with voicing during the production of English fricatives. In a study of four speakers of American English, pharyngeal volume was generally found to be greater during the production of sustained voiced fricatives, compared to voiceless equivalents. Though pharyngeal expansion is expected for voiced stops, it is more surprising for voiced fricatives. For three speakers, all four voiced oral fricatives were produced with a larger pharynx than that used during the production of the voiceless fricative at the same place of articulation. For one speaker, pharyngeal volume during the production of voiceless labial fricatives was found to be greater, and sibilant pharyngeal volume varied with vocalic context as well as voicing. Pharyngeal expansion was primarily achieved through forward displacement of the anterior and lateral walls of the upper pharynx, but some displacement of the rear pharyngeal wall was also observed. These results suggest that the production of voiced fricatives involves the complex interaction of articulatory constraints from three separate goals: the formation of the appropriate oral constriction, the control of airflow through the constriction so as to achieve frication, and the maintenance of glottal oscillation by attending to transglottal pressure.
INTRODUCTION
It has long been observed that voiced consonants are characterized by supralaryngeal configurations that differ from those used during the production of voiceless equivalents. Westbury (1983), for example, found that voiced stops “always exhibit active volume increases during their closures,” but concluded that the precise nature of any such increase is not especially important, since the means by which the pharynx was expanded was found to vary widely. A cinefluorographic study of English stop cognates by Kent and Moll (1969) found that voiced stops were produced with larger supraglottal volumes caused by lengthening and expansion of the oropharynx, which was attributed to “the result of muscular action rather than passive responses of the vocal tract.”
Many other studies have addressed pharyngeal behavior in voiced stops (e.g., Ladefoged, 1963; Rothenberg, 1968), but it has not been established which parts of the pharynx are responsible for voiced expansion, and there has been little treatment in the literature of the mechanisms of voicing in the production of fricatives.
At a first level of analysis, the voicing of fricatives is subject to the same physical constraints as any other voiced obstruent: for glottal excitation to occur, there must be sufficient airflow through the glottis. This is initiated by creating a pulmonically driven pressure differential across the glottis, but in order to sustain airflow, a mechanism for the reduction of supraglottal air pressure must be created. In the case of stop consonants, three mechanisms can be employed (Rothenberg, 1968, p. 91):
-
(i)
a passive, pressure-actuated expansion of the walls of the supraglottal cavity,
-
(ii)
a muscularly activated enlargement of the supraglottal cavity, and
-
(iii)
(nasal) airflow through an incomplete (velopharyngeal) closure.
The production of fricatives typically involves no nasal airflow but is characterized by the continuous release of air from the supraglottal cavity through an oral constriction, so the same three mechanisms are available for absorption of glottal airflow. Another strategy might be to increase the aperture of the constriction during the production of voiced fricatives. However, if the speaker controls a similar rate of airflow through the fricative constriction for both members of a voiced-voiceless fricative pair, the question to be considered here is the extent to which the first two mechanisms come into play.
In the case of labial fricatives, supraglottal volume can be manipulated by adjusting the lips and cheeks. However, the more posterior the place of constriction, the fewer the options available for manipulating supraglottal volume. Considering also that the production of English fricatives requires precise articulatory control of the lips, tongue tip, and tongue body (Hardcastle, 1976), then it would appear that the pharynx—which is less directly involved in the generation of noise at the fricative constriction than the active articulators—should bear a greater functional load in the achievement of voicing requirements.
The central question addressed in this paper is the way in which the pharynx is articulated during voicing; specifically, in the production of a voiced fricative:
to what extent is pharyngeal volume actively manipulated or allowed to change passively?
to what extent do competing constraints on the production of fricatives interact with the control of pharyngeal volume for voicing?
Supraglottal volume control during voicing
Rothenberg (1968) addressed in detail the ways in which “glottal airflow in a voiced plosive is often absorbed by a muscularly activated enlargement of the supraglottal cavity,” arguing that there are three components of pharyngeal volume change, attributable to movements of the (i) anterior, (ii) vertical, and (iii) posterior-lateral boundaries of the pharynx.
Perkell (1965) reported expansion of the pharynx through forward movement of the base of the tongue by up to 50 mm, which Rothenberg (1968) estimated as contributing up to 6 ml of volume. Stetson (1951) described how vertical motion of the larynx-hyoid unit can elongate the pharynx in that dimension, and Perkell (1965) measured net vertical pharyngeal augmentation of the order of 2 mm during the production of voiced plosives. Based on these data, Rothenberg (1968) estimated that vertical displacement might be responsible for pharyngeal volume increases of up to 2 ml. The third mechanism of pharyngeal expansion, attributable largely to the action of the stylopharyngeous muscles, is estimated to contribute an additional 2 ml of volume, although Rothenberg (1968) did not base this figure on any phonetic data. In total, Rothenberg (1968) estimated that the combined action of these three components could expand the pharynx by up to 10 ml during the production of a voiced consonant, a factor of 20% for a pharyngeal volume of 50 ml.
Bell-Berti (1975) examined the activity of four muscle groups responsible for control of pharyngeal cavity size during the production of stops—levator palatini, superior constrictor, middle constrictor and sternohyoid—and found that all three subjects used at least one of the active expansion mode muscles significantly. She concluded that each subject used “a different arrangement of muscle activities to achieve the pharyngeal cavity expansion necessary for the continuation of glottal pulsing during voiced stop consonant occlusion.” On the other hand, Magen et al. (2003) used magnetic resonance imaging (MRI) and x-ray cineradiography to examine the behavior of the posterior pharyngeal wall in Japanese and English speakers’ vowel production, and found very little movement. The authors concluded that “the position of the posterior pharyngeal wall in this region can be eliminated as a variable, and the anterior portion of the pharynx alone can be used to estimate vocal cavities.” The study did not include voiced-voiceless consonantal contrasts.
Supraglottal volume control in the production of fricatives
Although many of these same mechanisms are available to a speaker during the production of a voiced fricative, the task differs considerably from that of stop production because of the aerodynamic continuancy involved in producing frication. Ohala (1983) proposed that the difficulty of managing the competing aerodynamic requirements of frication and voicing might account for the comparative typological scarcity of voiced fricatives in comparison to the more commonly occurring voiced stops.
There are little phonetic data currently available with which to test such hypotheses and gain further insights into the details of voicing mechanisms in fricatives. In a cineradiographic study of English sibilants, Subtelny et al. (1972) found that “pharyngeal dimensions for ∕s∕… were smaller than for ∕z∕” within some vowel contexts, but these fricative pairs were not elicited in identical phonological contexts. Cineradiographic data collected by Perkell (1969) reveal pharyngeal augmentation during the production of ∕z∕ due to advancement of the tongue dorsum 2 mm further than for ∕s∕. A limitation of these studies is that the data are restricted to the midsagittal plane, and cannot be used to calculate pharyngeal volumes, nor to examine articulation in other dimensions.
In an MRI study of English fricatives, Narayanan et al. (1995) observed that “the tongue root tended to be more advanced in the case of the voiced fricatives when compared to their unvoiced counterparts …Tongue root advancement resulted in greater areas in the mid- and lower-pharyngeal regions (and) also influenced the epiglottic-vallecular volume to some extent.” All fricatives in their study were elicited in a [ə_] context; however, it has been found that schwa is an inconsistently articulated context vowel, and that adjacent vowels can have a large influence on the position of the tongue when producing fricatives (Shadle et al., 2008). This vocalic coarticulation effect is an important factor which must be controlled when considering the pharyngeal variation that can be attributed to consonantal voicing.
METHOD
The pharyngeal models considered in this study were constructed from MR images acquired while speakers of American English produced a range of fricative tokens in a scanner.
Subjects and corpora
Four monolingual native speakers of Standard American English, two women (W2 and W3) and two men (M1 and M2), were recruited as subjects. All were students of linguistics, aged between 21 and 26 years, who were paid for their participation. Non-naive subjects were deliberately chosen so that stimuli could be presented in the International Phonetic Alphabet (IPA), and the subjects could be instructed about the linguistic requirements of each task.
Each subject was asked to produce each of the English oral fricatives: eight consonants organized as voiced-voiceless pairs distributed over four places of articulation: labiodental [f]-[v], dental [θ]-[ð], alveolar [s]-[z], and post-alveolar [ʃ]-[ʒ]. Each fricative was elicited in three maximally distributed vocalic contexts [i_i], [a_a], and [u_u].
Stimuli were presented in the format [ifi ifːi], allowing the subject to practice the token once, before taking a breath and sustaining the target fricative. The vowel immediately before the long fricative was sustained for approximately half a second before the scanner sequence was initiated at the beginning of frication. Subjects were instructed to sustain even frication and to concentrate on maintaining a consistent articulatory posture throughout the production. At the end of each sustained fricative, the final context vowel was repeated after the scanner had stopped to ensure that, as much as possible, the vocalic context had been maintained throughout the production.
Subjects practiced sustaining fricatives before each MRI session by producing the same corpora in an anechoic chamber while they were prompted using the same stimulus presentation software which was deployed in the scanner. High quality acoustic recordings were made during the anechoic sessions to allow for acoustic analysis of the speakers’ fricatives.
A Siemens Sonata 1.5 T MRI scanner was used to image the subjects’ vocal tracts while they produced all fricative tokens over the course of two 90-min sessions. Subjects lay supine in the scanner, sustaining each fricative in each vocalic context for 36 s. Prompts were presented in IPA, projected onto a screen which could be read by the subject from within the scanner bore. Subjects varied in the number of breaths they took during the sustained frication, from none (M1) to two (M2, depending on the trial); they were instructed to do so with a minimum of oral movement. In the few cases where the quality of an image sequence was compromised by motion blur associated with breathing or other activity, the token was reacquired.
All fricatives elicited during the scanning session were monitored using a FOMRI dual channel noise canceling optical microphone (Optoacoustics Ltd., 2007) integrated into the scanner. Scanner noise was attenuated by approximately 40 dB, allowing for real-time supervision of the subjects’ speech. In this way the veracity of each fricative and vowel was monitored during the production of each token, as well as the maintenance of voicing in the long-hold fricatives. Scan sessions were organized such that, as much as possible, multiple tokens of the same fricatives and all tokens of voiced-voiceless fricative pairs were elicited in a single session to reduce alignment errors.
A two-dimensional True-FISP scan sequence (Tr=200 ms, Te=3.3 ms, flip angle=70°) was chosen as the best compromise between image resolution and scan time. Each token was repeated three times, so that it could be imaged in each of three orientations: sagittally (from ear to ear), axially (from upper trachea to nasal cavity), and obliquely, 45° to the axial planes, providing cross-sectional imaging of the tract in the alveolar region (from lips to velum) (see Proctor et al., 2008 for details of imaging orientations). In each orientation, parallel slices of 4 mm thickness were acquired, spaced at 4.8 mm intervals. Although this interslice spacing was coarser than ideally desired, it was deemed more important to keep the scan time short to ensure that vowel context persisted through the production of each token. The number of slices acquired for each subject and each orientation was varied as needed in order to sample the tract over the region of interest.
Pharyngeal model construction
Initial processing of MR images was performed using 3D-DOCTOR, a vector-based three-dimensional image processing and modeling suite (Able Software Corp., 2007). All subsequent image processing and tract modeling was performed in MATLAB (MathWorks Inc., 2007). Image stacks were assembled from DICOM files in each orientation: sagittal, axial, and oblique. The MR images provided a resolution of 0.47×0.47 mm2 in the plane of each image slice, with an interslice spacing of 4.8 mm.
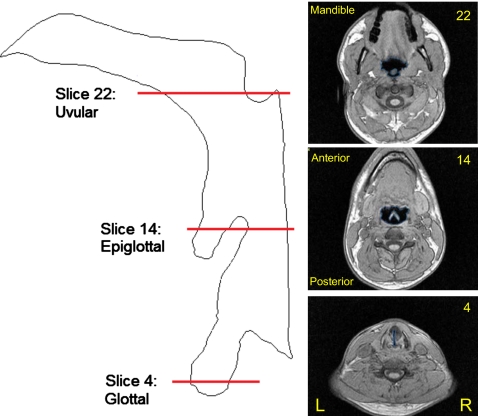
For each fricative token, a subset of slices was selected from the axial stack to create a model of the subject’s pharynx. A stack of 15–20 slices was required to cover the full extent of each oropharynx, depending on the size, gender, and anatomy of the subject. The bottom slice selected in each stack was the most constricted slice through the glottis above the elliptical sections defining the trachea (Fig. 1, slice 4). The top slice delineating the stack was chosen to be the last slice imaging the oropharynx before any evidence of the uvula was apparent (Fig. 1, slice 21). The sets of images chosen in this way corresponded to a 72–96 mm section of the pharynx.
Figure 1.
Left: Midsagittal outline of tract from glottis to alveolar constriction, showing location of three axial MRI slices for subject M1—[s] in token [asːa]. Right (bottom to top): Axial slice 4: through glottis; slice 14: midpharynx, showing epiglottis; slice 22: slice above top of oropharynx, showing tip of uvula.
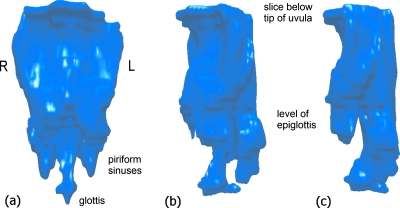
Three-dimensional models were constructed from the subset of axial images defining the pharynx. Each image slice was segmented by identifying a set of points defining the air-tissue boundary, resulting in a set of curves lying in parallel planes representing the intersection of the tract with the center of each imaging plane. A model of the airway of each oropharynx was constructed from the axial stack of boundaries (Fig. 2). The tract model surface was created by fitting a triangulated mesh to the points defined on the constituent boundaries. The surface was triangulated using a DELAUNAY algorithm (de Berg, 1997).
Figure 2.
Pharyngeal model constructed from axial MRI slices—subject M1, fricative [z] in token [aza]. (a) Frontal view through mandible. (b) Front-left perspective. (c) Lateral view through left cheek.
Pharyngeal volume estimation
The volume of each pharynx was estimated from the triangulated surface defining the pharyngeal tract boundary. An arbitrary reference point on the tract surface was first chosen. For each triangle on the tract surface, a tetrahedron based on the triangle with an apex at the reference point was constructed, and the volume of the tetrahedron was calculated. All signed tetrahedral volumes defined over the surface with respect to the reference point were then summed to calculate the total volume enclosed by the surface.
RESULTS
Pharyngeal articulation and voicing
Comparison of the fricative tract models reveals that voiceless fricatives are generally produced with a different pharyngeal configuration to that employed in the production of voiced fricatives at the same place of articulation. Although the region of the tract around the fricative constriction is not shown in these models, no major differences were observed in the primary place of articulation between voiced and voiceless fricative pairs, nor in the size of the constriction.
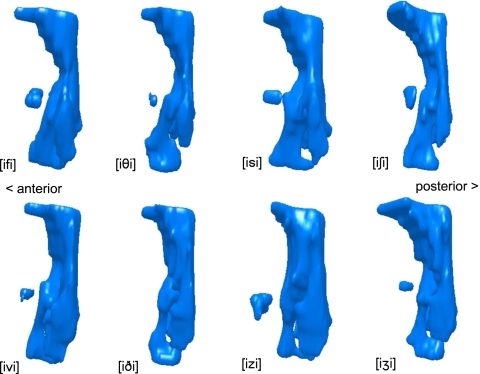
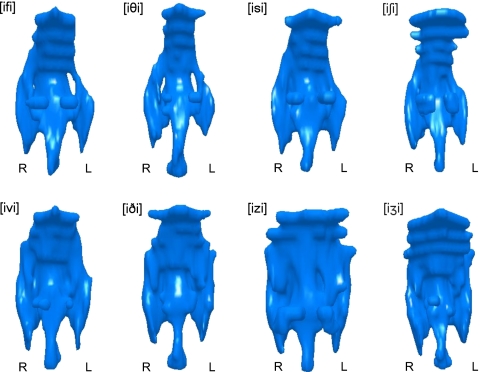
Articulatory differences between voiced and voiceless fricatives are most apparent in the upper oropharynx, where voiceless tracts typically appear more constricted than their voiced equivalent tracts. Lateral views of the pharynx of subject W3 producing voiced and voiceless fricative pairs are shown in Fig. 3. Frontal views of the same pharyngeal models are shown in Fig. 4.
Figure 3.
Pharyngeal models of voiceless (top row) and voiced (bottom row) fricatives. Left lateral view. Subject W3, all oral fricatives produced in [i_i] context.
Figure 4.
Pharyngeal models of voiceless (top row) and voiced (bottom row) fricatives. Frontal view. Subject W3, all oral fricatives produced in [i_i] context.
The vocal tract articulations employed in the production of the voiceless fricatives at all four places of articulation can be seen to be more constricted in the midpharyngeal region. The most constricted section of each of the voiceless pharynges is the region immediately above the epiglottis; in contrast, the voiced tracts maintain a more consistent volume throughout the upper pharynx.
The frontal views of the models (Fig. 4) reveal that the voiceless tracts are also more laterally constricted in the upper pharynx compared to their voiced equivalents, which are noticeably wider in the region below the uvula. For subject W3, whose pharyngeal models are illustrated here, this effect is particularly noticeable in the sibilant tokens [izi] and [iʒi], which display considerable lateral expansion compared to their voiceless equivalents [isi] and [iʃi]. The issue of whether this expansion is passive or active is addressed in Sec. 4.
These same differences in pharyngeal articulation between voiced and voiceless fricatives are also evident in all tokens produced by subjects M2 and W2, across all four places of articulation. Subject M1 did not show the same consistent pharyngeal expansion for voiced tokens as the other subjects, and his pharyngeal articulation varied considerably with place of articulation. For some tokens, M1’s pharynx was more expanded during the production of voiceless fricatives—an effect not observed in any other subject.
Pharyngeal volume and voicing
The gross differences in pharyngeal articulation observed in the tract surface models were quantified by calculating the volumes of the pharyngeal models for each token (Sec. 2C). Differences in volumes of voiced and voiceless tracts were calculated for each pair of fricatives, and averaged over subjects and vowel contexts (Table 1). Overall, for this group of speakers, voiced fricatives are produced with a 36% larger mean pharyngeal volume than their voiceless equivalents.
Table 1.
Mean pharyngeal volume (cm3) by place of fricative articulation. All four subjects and all three vowel contexts. Percentage difference calculated as (Vvoiced−Vunvoiced)∕Vunvoiced×100.
| Place of articulation | Volume voiced | Volume unvoiced | Difference | |
|---|---|---|---|---|
| cm3 | % | |||
| Labiodental | 26.9 | 20.2 | 6.7 | 33 |
| Dental | 22.9 | 19.5 | 3.4 | 18 |
| Alveolar | 34.3 | 23.0 | 11.4 | 49 |
| Postalveolar | 33.1 | 23.7 | 9.3 | 39 |
| All fricatives | 29.3 | 21.6 | 7.7 | 36 |
Mean pharyngeal volumes for each subject, averaged over fricative token and vocalic context, are given in Table 2. The data show that three of these speakers produced voiced fricatives with a pharyngeal volume at least 49% larger than their voiceless equivalents. For one speaker (M2), the pharynx used to produce voiced fricatives is on average twice as large as the pharynx used to produce voiceless fricatives. Compared to the other subjects, the pharyngeal volume data of subject M1 were anomalous, showing no major difference in mean pharyngeal volume between voiced and voiceless fricatives.
Table 2.
Mean pharyngeal volume (cm3) by subject. All fricatives and all vowel contexts. Percentage difference calculated as (Vvoiced−Vunvoiced)∕Vunvoiced×100.
| Subject | Volume voiced | Volume unvoiced | Difference | |
|---|---|---|---|---|
| cm3 | % | |||
| M1 | 50.4 | 49.7 | 0.7 | 1 |
| M2 | 37.9 | 18.9 | 19.0 | 100 |
| W2 | 13.1 | 8.8 | 4.3 | 49 |
| W3 | 15.8 | 9.0 | 6.8 | 76 |
| All subjects | 29.3 | 21.6 | 7.7 | 36 |
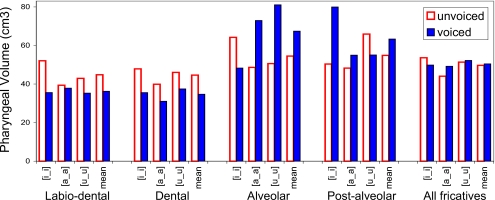
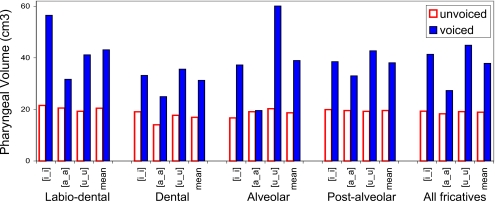
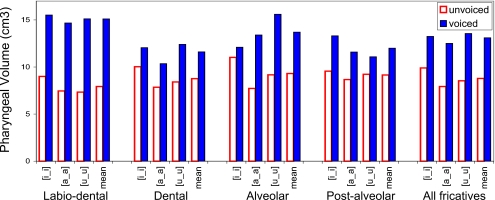
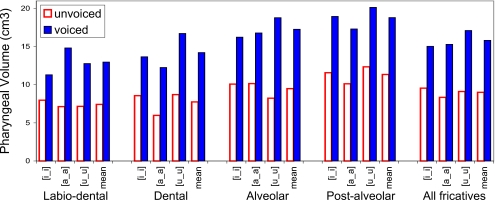
Although mean voiced fricative pharyngeal volumes are consistently larger than voiceless volumes across all places of articulation, the magnitude and direction of these differences vary between subjects. Pharyngeal volumes of fricatives produced by individual subjects at each place of articulation are compared in Figs. 5678.
Figure 5.
Fricative pharyngeal volumes by place of articulation and vocalic context—subject M1. Solid bars indicate voiced volumes; outlined bars indicate voiceless volumes. Contexts [i_i], [a_a], and [u_u] and mean volumes shown for each pair.
Figure 6.
Fricative pharyngeal volumes by place of articulation and vocalic context—subject M2. See Fig. 5 for legend.
Figure 7.
Fricative pharyngeal volumes by place of articulation and vocalic context—subject W2. See Fig. 5 for legend.
Figure 8.
Fricative pharyngeal volumes by place of articulation and vocalic context—subject W3. See Fig. 5 for legend.
The data show that three of the four subjects (M2, W2, and W3) consistently produce voiced fricatives with larger pharyngeal volumes than their voiceless equivalents, in all vocalic contexts at all places of articulation (Figs. 678). Subject M1 is anomalous in that his voiceless dental and labiodental fricatives, as well as the tokens [isi] and [uʃu], are all produced with a greater pharyngeal volume than that used in the production of their voiced fricative pairs (Fig. 5).
The data in Table 2 also reveal that the mean volume of the pharynx of the largest male subject (M1) was more than 3.5 times greater than the mean volume of the smallest female subject (W2). To provide a better means of comparison across the population of subjects, the data were normalized with respect to each subject.
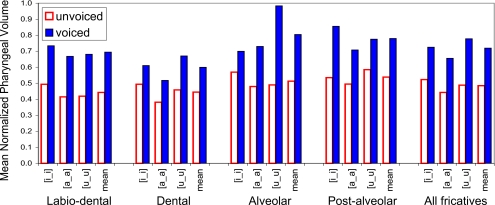
Each pharyngeal volume was divided by the largest volume calculated for the same subject, resulting in four sets of relative volumes lying within the range [0–1]. The normalized pharyngeal volumes obtained in this manner were averaged over all subjects and grouped according to vowel context. The mean normalized volume data are illustrated in Fig. 9.
Figure 9.
Mean normalized pharyngeal volumes by place of articulation and vowel context, averaged over all subjects. Solid bars indicate voiced volumes; outlined bars indicate voiceless volumes. Contexts [i_i], [a_a], and [u_u] and mean shown for each pair.
The data in Fig. 9 reveal that the fricative pair for which the voiced-voiceless pharyngeal volume differences are the most robust over all vowel contexts is [f-v]. For labiodental fricative tokens, the minimum differential pharyngeal volume is 49% (for vowel context [i_i]), the maximum differential volume 63% (vowel context [u_u]), and the mean difference across all contexts and speakers is 57%. The sibilants [s-z] also show a mean differential volume difference of 57%, but for this pair of fricatives the difference is less consistent, varying from 23% in the high front context [i_i] to 101% for context [u_u]. Although some of this variation is clearly attributable to the anomalous volume differences found in M1, subjects M2 and W2 also show large differences in the amount of pharyngeal volume change with sibilant voicing in different vowel contexts (compare M2 [isi-izi], [asa-aza], and [usu-uzu]).
Articulatory characterization of supraglottal changes during voicing
In order to examine the geometry of the pharynx during the production of voiced and voiceless fricatives in more detail, tissue outlines were extracted from selected MR imaging planes and superimposed to compare vocal tract configurations. Midsagittal images were superimposed to compare tract length, laryngeal position, and overall tract shape, and axial slices were used to examine cross-sectional differences in the epiglottal and pharyngeal regions.
Method
For each pair of voiced-voiceless fricative tokens, the two axial image stacks were aligned such that the configuration of the pharynx in each corresponding image slice could be compared across tracts. For each MR image stack, a Sobel edge-detection algorithm (Duda and Hart, 1973) was applied to automatically detect air-tissue boundaries. Contrast and edge-detection thresholds were selected to produce the best tissue outlines for the images of interest.
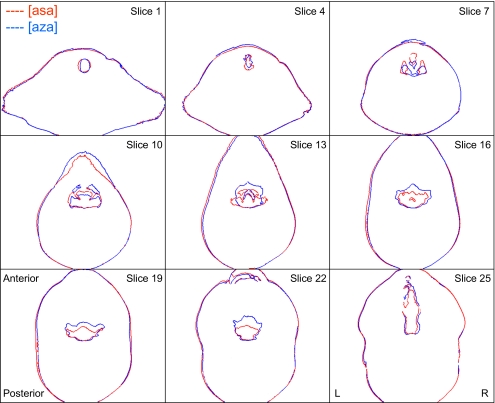
Tract boundaries corresponding to voiced and unvoiced tokens were superimposed. Alignment between image stacks was verified by comparing anatomical landmarks—primarily the outline of the subjects’ head. In most cases, because the voiced-voiceless fricative pairs were acquired during the same imaging session, the subject’s heads remained in perfect alignment, so that the superimposed tracts could be compared directly without any need for translation of the images with respect to each other. An example of a superimposed pair of image stacks generated in this way is shown in Fig. 10.
Figure 10.
Superimposition of axial slices to compare pharyngeal articulation—subject M1, tokens [asa] vs [aza]. Higher slice numbers correspond to higher positions in tract. Slice 1 (top left): trachea; slice 7: supraglottal slice showing piriform sinuses; slice 13: midpharynx and epiglottis; slice 25 (bottom right): oral cavity beneath hard palate.
Characterizing pharyngeal differences
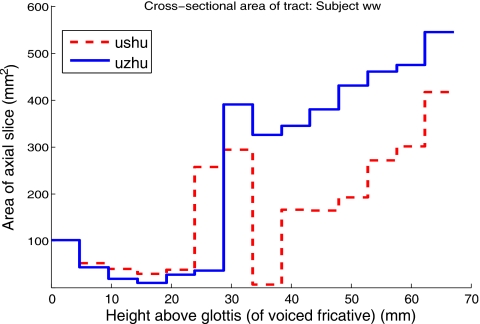
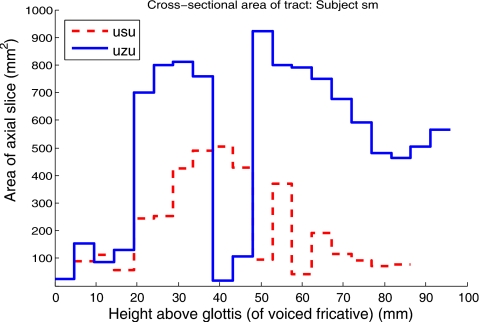
Area functions of fricative pairs were calculated from the axial image stacks in order to compare the contributions of different regions of the tract to the voiced-voiceless pharyngeal volume differences. For each slice in the image stack, the areas enclosed by the two tract boundaries were computed. A pair of area functions was constructed in this manner for each superimposed pharyngeal stack. Comparative area functions calculated from tract models of subject W3’s productions of [uʃu] and [uʒu] are plotted in Fig. 11. Area functions comparing subject M2’s tokens [usu] and [uzu] are shown in Fig. 12.
Figure 11.
Comparative pharyngeal area function—subject W3, tokens [uʃu] (broken line) vs [uʒu] (solid line).
Figure 12.
Comparative pharyngeal area function—subject M2, tokens [usu] (broken line) vs [uzu] (solid line).
The area functions in Figs. 1112 reveal that the bulk of the additional volume observed in the voiced pharynges is contributed by expansion of the upper pharynx. The same pattern is observed for all other tokens produced by subjects M2 and W3, and for all tokens produced by subject W2.
The comparative area functions of fricatives produced by M1 also show the same pattern, except in those cases where the voiceless pharyngeal volumes are larger; in these cases—tokens [ifi], [ufu], [isi], and [uʃu]—the bulk of the additional volume in the voiceless pharynges is also contributed by expansion of the upper pharynx.
Pharyngeal variation throughout the pharynx
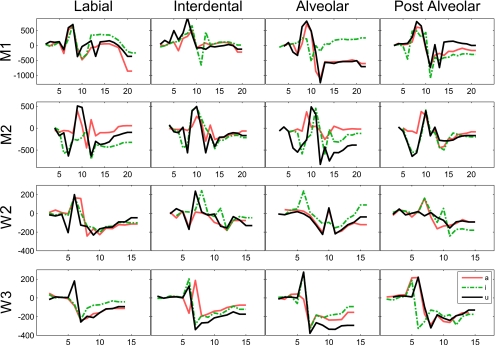
To gain further insights into the effect of vocalic context and place of articulation on fricative production, differential area functions were generated to observe the way in which the volume varies between voiced and voiceless productions in different parts of the tract. The data, organized by speaker and place of articulation, are illustrated in Fig. 13. Area functions are aligned by slice number within each subject such that slice 1 corresponds to the lowest position of the glottis for any token by that subject.
Figure 13.
Differential area function (Aunvoiced−Avoiced, mm2) by subject (row), place of articulation (column), and vocalic context: [i_i] (broken line), [a_a] (light solid line), and [u_u] (dark solid line). x-axis: image slice numbers. Higher slice numbers correspond to higher positions in pharynx.
The differential area functions in Fig. 13 offer a number of insights into the difference between voiced and voiceless fricative pharyngeal articulation. Negative values indicate regions of the pharynx where the cross-sectional area of the voiced tract is greater than that used in the production of the corresponding voiceless fricative. The general pattern observed in all of these graphs is a function that starts at zero, becomes positive for 1–2 slices, and then trends negative for the remainder of the slices, corresponding to the upper half of the pharynx. Variations of this same general trend are observed for all subjects, including M1, whose upper laryngeal volume differences are anomalous compared to the other subjects. The fact that the differential area function alternates between positive and negative in this way indicates that the minimum pharyngeal areas occur at different heights for the same fricative place, vowel context, and subject.
The near-zero values at the beginning of the function correspond to the small volumes observed around the glottis in both voiced and voiceless fricatives. The functions trend rapidly positive and then negative because of differences in the vertical alignment of different parts of the larynx, piriform, and false vocal folds between the voiced and voiceless fricatives being compared, and because of differences in the volumes of these regions of the tract.
Laryngeal height
One of the important insights revealed by the area functions derived in Sec. 3C2 is that the glottal slices in the voiced fricative productions are often displaced with respect to the equivalent voiceless fricative productions. In both Figs. 1112, for example, the area function of the voiced tract (solid line) begins one slice before the voiceless tract area function (broken line), indicating that the glottis is lower in the tract during the production of the voiced fricative.
In all 48 fricative pairs (4 subjects×4 places of articulation×3 vowel contexts), the height of the glottis during the production of the voiced fricative was either level with or up to three slices (14.4±2.4 mm) lower in the tract than the voiceless fricative glottal height. Subject W3 showed the least glottal displacement with voicing, averaging 2.4 mm, and subject M2 the most (9.2 mm). The mean vertical glottal displacement across all 48 fricative pairs was 1.0625 slices or 5.1±2.4 mm. That is, the glottis was on average half a centimeter lower in the voiced tracts than it was during the production of the voiceless fricative equivalents. This suggests that either the larynx is lowered during voicing or raised during the production of voiceless fricatives.
Mechanisms of expansion
Another question addressed in this study is whether the increased pharyngeal volume observed in the voiced fricative productions results from a uniform expansion of the upper pharynx or whether the additional volume is attributable to a particular active mechanism of articulation.
A comparison of midsagittal images of voiced-voiceless fricative pairs revealed no major differences in the height or configuration of the uvula, eliminating vertical displacement of the upper oropharynx as a mechanism of expansion for voiced production. For example, the tip of the uvula was located 59 mm below the top of the sphenoidal sinus during subject W3’s production of [uvːu] and 58 mm below the sinus during her production of [ufːu]—a fricative pair which differs in volume by 43%, yet shows no evidence of vertical displacement of the uvula. Likewise, for subject M1, the uvular tip was measured to be 71 mm below the sphenoidal sinus during his production of [isːi] and 72 mm below the sinus during his production of [izːi].
In order to gain more insights into the nature of pharyngeal expansion, the voiced and voiceless tracts were compared by measuring the relative displacement of the front, rear, and side pharyngeal walls at different heights.
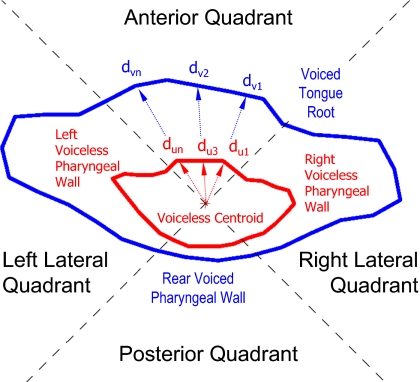
In each slice of the pharyngeal stack, the centroid of the voiceless fricative tract was calculated. The image plane was divided into four quadrants by constructing two perpendicular axes intersecting at the centroid and oriented at 45° with respect to the anterior-posterior axis. The tract boundaries of the corresponding voiced fricative were superimposed on each slice, so that the relative articulations of the voiced-voiceless fricative pair could be compared. Because all fricative pairs were acquired during the same scanning session, no image registration was required to perform the superimposition, since each set of boundaries was represented within the same coordinate space.
Quantifying gross pharyngeal expansion
For both tract boundaries on each slice, the distance of each point to the voiceless centroid was calculated. By averaging both sets of distances in each quadrant, a mean displacement from the centroid was calculated for both voiced and voiceless tract boundaries. The relative displacement of the voiced tract with respect to the voiceless tract was then calculated as the difference between the mean boundary displacements (Fig. 14).
Figure 14.
Superimposed voiced (outer) and voiceless (inner) pharyngeal boundaries, showing four quadrants and method of calculation of pharyngeal wall displacements in each quadrant—subject M2 [isi-izi] (slice 17).
The method of calculation of the anterior pharyngeal differential distance A, for example, is given by
| (1) |
where n,m=number of points on anterior quadrant of voiced and voiceless boundaries, respectively, and d is defined in Fig. 14. The posterior P, left lateral LL, and right lateral RL differential distances are calculated in the same way in their respective quadrants. The distance metrics calculated in this manner provide an indication of the amount of expansion of the voiced tract with respect to the voiceless tract at different heights in the pharynx.
In the lower pharynx, this pharyngeal expansion metric did not prove to be a reliable means of quantifying changes in articulation between voiced and voiceless fricatives because the morphology of this part of tract is not sufficiently simple. In the lower-midpharyngeal region, for example, the epiglottis introduces a bifurcation, and in the laryngeal region, the tract trifurcates at the piriform sinuses. Another factor which prevents the use of the metric throughout the entire pharynx is the vertical displacement of the laryngeal region due to voicing (Sec. 3C4). This causes dissimilar parts of the pharynx to appear on the same image slice, which cannot be sensibly compared.
For these reasons, a subsection of each pharynx was chosen in which the voiced and voiceless tract morphologies were sufficiently alike to allow for comparison using this method—a section extending from the top slice in the pharynx down to the top of the epiglottis. The mean number of slices in the upper pharyngeal section was 4.85, representing a 23.3 mm section, covering approximately the top third of each pharynx.
In each slice of the upper pharynx, the total displacement of the voiced tract with respect to the voiceless tract was calculated as the sum of displacements in all four quadrants. The total pharyngeal displacement T was defined to be the sum of anterior, left lateral, right lateral, and posterior displacements [Eq. 2].
| (2) |
The gross differential pharyngeal wall displacement calculated using this metric varied considerably across fricative tokens, from a minimum of −9.30 mm (subject M1, tokens [ifi-ivi], reflecting the larger size of the voiceless tract) to a maximum of 31.05 (subject M2, tokens [usu-uzu]). The mean total differential upper pharyngeal wall displacement across all 48 fricative pairs was 9.27 mm (Table 3).
Table 3.
Mean total differential pharyngeal wall displacement (dVoiced−dVoiceless) (mm), and ratios of anterior wall to total displacement and posterior wall to total displacement by subject—all fricatives and all vowel contexts.
| Subject | Total V-U displacement (mm) | Anterior∕total | Posterior∕total |
|---|---|---|---|
| M1 | 3.19 | 0.15 | 0.15 |
| M2 | 13.75 | 0.29 | 0.11 |
| W2 | 8.47 | 0.51 | −0.09 |
| W3 | 11.65 | 0.29 | 0.08 |
| Mean | 9.27 | 0.31 | 0.06 |
Directional characterization of pharyngeal expansion
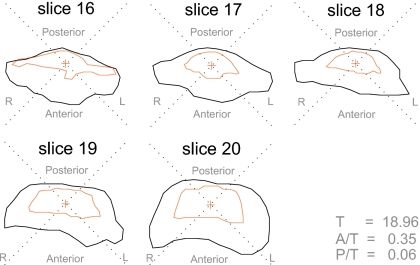
To better characterize the nature of pharyngeal expansion, the percentage contribution of pharyngeal wall displacement in each direction was estimated by calculating the ratio of directional displacement to total displacement T in each quadrant. The left (LL∕T) and right (RL∕T) displacement ratios were added to provide an indication of total lateral displacement (L∕T), which could then be compared to the anterior (A∕T) and posterior (P∕T) displacement ratios. In each slice, by definition, the sum of anterior, posterior, and lateral displacement ratios is 1.
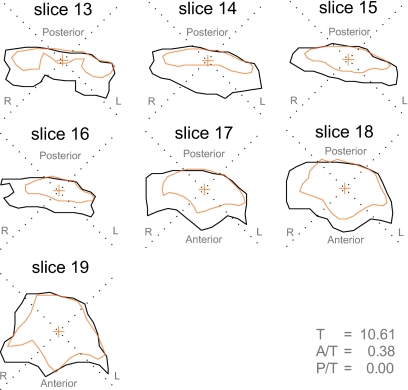
One pattern of upper pharyngeal expansion which was observed among these fricative pairs is shown in Fig. 15. The seven superimposed tract slices contrast subject W2’s production of [ifi] (inner tract boundary) and [ivi] (outer boundary). The rear pharyngeal walls of both fricative productions are revealed to be in close alignment (P∕T=0.00), and nearly all of the expansion of the voiced tract results from displacement in the lateral (L∕T=0.59) and anterior (A∕T=0.38) quadrants, suggesting that the sole mechanism of pharyngeal expansion employed in the production of the voiced fricative, in this case, involves forward displacement of the tongue root.
Figure 15.
Upper pharyngeal expansion primarily through tongue root and lateral displacement—subject W2, upper eight slices of [ifi] (inner boundary) vs [ivi] (outer boundary). Slice 13: midpharynx, above epiglottis; slice 19: top of oropharynx, below uvula.
In a few cases, the expansion of the voiced pharynx was observed to occur more equally in all directions, as in the case of the fricative pair compared in Fig. 16. In this example (W2 [afa-ava]), 14% of displacement occurs in the posterior quadrant, 25% in the anterior quadrant, and the remainder is lateral (L∕T=0.64). These data suggest that some volume differences might result from active constriction of the voiceless tract with a sphincterlike mechanism. The alternative explanation—that the expansion of the voiced tract is passive—does not seem plausible because that would require increased intraoral air pressure in the voiced cases.
Figure 16.
Concentric voiced∕voiceless upper pharynges—subject W2, [afa] (inner boundary) vs [ava] (outer boundary). Slice 13: midpharynx, above epiglottis; slice 19: top of oropharynx, below uvula.
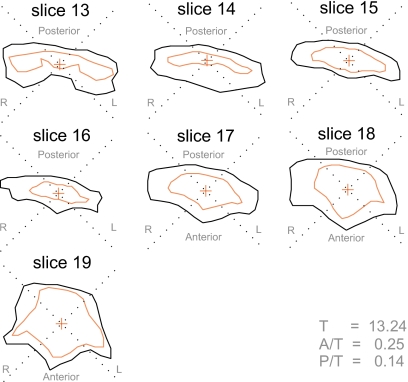
The prototypical pattern of pharyngeal expansion observed in this study involves neither a static rear pharyngeal wall (as in Fig. 15) nor a concentric arrangement of the voiced and voiceless tracts (as in Fig. 16), but rather the configuration illustrated in the fricative pair in Fig. 17. Some expansion of the voiced tract may be observed in all directions; however, the majority of the displacement is in the anterior and lateral quadrants, again suggesting that the primary mechanism of voiced pharyngeal expansion seems to involve forward displacement of the tongue root.
Figure 17.
Typical displacement pattern observed in upper pharynx—subject M2, [isi] (inner boundary) vs [izi] (outer boundary). Slice 16: midpharynx, above epiglottis; slice 20: top of oropharynx, below uvula.
The extent to which forward movement of the tongue root dominates the expansion of the rear pharyngeal wall can be quantified by averaging the ratios of anterior and posterior pharyngeal wall to total displacement (Table 3). For subject M1, no difference in anterior and posterior displacements was observed, a statistic which reflects the anomalous behavior of this subject in producing some voiceless fricatives with a larger pharynx than their voiced equivalents. However, for the remaining three subjects, the contribution of tongue root displacement to pharyngeal expansion (A∕T) outweighs the effect of rear pharyngeal wall expansion (P∕T) by a factor of at least 2. Overall, forward displacement accounts for 31% of total voiced expansion in the upper oropharynx.
DISCUSSION
One issue to be considered when assessing the findings of this study is the artificiality of the task. MRI requires subjects to sustain fricatives for an unnaturally long time and to utter them while lying supine in a scanner.
Adopting a supine posture has been demonstrated to have a minor influence on articulation. Engwall (2003) observed slight pharyngeal narrowing in the supine production of Swedish vowels, compared to when prone, most noticeably for the front vowel [i]. In an X-ray microbeam study of two Japanese subjects, Tiede et al. (2000) concluded that the supine posture caused nonessential articulators to fall with gravity, while essential articulators are held in position even if against gravity.
Assuming these factors also applied to the subjects in this study, they should not affect the fundamental findings concerning difference between voiced and voiceless articulations, as all fricative tokens were produced under the same conditions. Furthermore Subtelny et al. (1972) observed the same direction of change between ∕s-z∕ in a real-time study of subjects using upright posture, and Narayanan et al. (1995) observed a similar effect in the tongue root for subjects who were also in a supine position.
The sustained nature of the frication task asked of the subjects should be considered. In a study of Swedish vowels and fricatives, Engwall (2000, 2003) found the effect of sustaining long tokens to be equivalent in some respects to hyperarticulation. Tongue position was found to be more neutral for static holds (as opposed to dynamic), suggesting that the effects of coarticulation should be reduced in long holds.
The data presented in this study provide good evidence that coarticulatory effects persist in the subjects’ productions of long-hold fricatives, since there is considerable variation in pharyngeal articulation due to vocalic context (as discussed in more detail in Shadle et al., 2008). Although subjects may have used different strategies to manage airflow throughout the long holds, once more this should have affected both voiced and voiceless productions equally, so the insights into voicing differences remain valid. Factors associated with these different production strategies may explain some of the anomalies observed in the fricatives produced by subject M1, who was remarkable for having the largest lung capacity and perhaps needed to manage his airstream less than the other three subjects.
Given that the finding of a larger pharyngeal volume in voiced fricatives seems to be consistent with other studies, and is unlikely to be an artifact of the unnatural aspects of an MRI study, does Westbury’s (1983) explanation for stops work for fricatives? First, Westbury (1983) showed that the vocal tract continued to expand during the closed phase of voiced stops. This does not hold for the voiced fricatives in the current study, as continual expansion would have resulted in blurred MR images. This does not in itself argue against Westbury’s (1983) explanation, however; with the incomplete closure afforded by the fricative constriction, continued airflow through the glottis will not result in oral pressure increasing to the point where phonation would cease.
Is it possible, then, that the subjects find an equilibrium at the start of the long-sustained fricative where the air exiting through the constriction just balances the air entering through the phonating glottis, and the pharynx is expanded just enough to keep the pressure drop across the glottis in a range where phonation can continue? This explanation does not work either. The intraoral pressure must be less for voiced than for voiceless fricatives, unless subglottal pressure is sufficient to compensate for the pressure drop across the glottis in the voiced case. While this might be possible for sustained production in a MR scanner, that would be extremely unlikely to occur in normal speech, and thus would not explain Subtelny et al.’s (1972) results. With intraoral pressure lower in the voiced case, passive expansion due to air pressure would predict bigger pharyngeal volume in the voiceless case.
If not the result of passive expansion, then perhaps the expanded pharynx is the result of active expansion, held in one position throughout the long-sustained fricative. But it is hard to come up with a convincing explanation for why this would make it easier, or more possible, to keep both voicing and frication sources going throughout. Instead, it seems possible that in the voiceless fricatives the tongue is actively pulled back in the upper pharynx to create a pressure-regulation mechanism. This could help reduce the airflow through the abducted glottis and would also help explain the anomalous results of subject M1: because of his greater lung capacity and large tract, subject M1 may not need to resort to this type of pressure regulation during long-hold frication as much as the other subjects.
CONCLUSIONS
In this study, the pharyngeal articulation of American English fricatives has been examined for four subjects using volumetric MRI data, and differences between voiced and voiceless fricatives have been characterized in three main respects.
The most important finding is that voiced fricatives are generally produced with a larger pharynx than that used during production of voiceless fricatives at the same place of articulation. These volume differences are consistent across all places of articulation and vocalic contexts for three of the four subjects studied. The subject with the largest pharynx differed from the other four by producing labiodental and interdental voiceless fricatives with a larger pharyngeal volume.
The bulk of the additional volume observed in the voiced fricatives was found to result from the expansion of the upper pharyngeal region above the epiglottis, below the uvula. The chief mechanism of expansion of the upper oropharynx was found to be displacement of the tongue dorsum—which was estimated to contribute approximately 31% of the additional volume—and the lateral pharyngeal walls, rather than through displacement of rear pharyngeal walls (6% of additional volume). Although the displacement of the rear wall was found to be smaller than that of the anterior portion of the pharynx, these findings also suggest that the posterior pharyngeal wall cannot simply be regarded as an immovable part of the vocal tract, as has been suggested.
Finally, the larynx was found to be consistently lower during production of voiced fricatives than during production of voiceless fricatives.
Many of the differences between voiced and voiceless fricatives observed in this study were only discovered by examining the geometry of the pharynx in all three dimensions. This demonstrates that midsagittal analysis of the vocal tract alone is insufficient to properly characterize fricative production and voicing.
This study has addressed the broad pharyngeal differences which can be observed in the production of voiced and voiceless fricatives; however, there are many more aspects of fricative production and voicing which remain to be investigated. More phonetic data are required to reconcile the differences in volume observed here with more detailed aspects of mechanisms of voicing and frication, and to account for some of the inconsistencies observed between subjects, and at different places of articulation.
ACKNOWLEDGMENTS
This work was supported by the National Institutes of Health, Grant No. NIH-NIDCD-RO1-DC006705. The authors are grateful to Carol Fowler, Christine Mooshammer, and two anonymous reviewers for their comments on an earlier version of this article.
This paper is an expanded version of a talk presented by the second author at the Sixth ICVPB, Tampere, Finland, 6–9 August 2008.
References
- Able Software Corp. (2007). 3D-DOCTOR version 3.5, Able Software Corp., Lexington, MA.
- Bell-Berti, F. (1975). “Control of pharyngeal cavity size for English voiced and voiceless stops,” J. Acoust. Soc. Am. 57, 456–461. 10.1121/1.380468 [DOI] [PubMed] [Google Scholar]
- de Berg, M. (1997). Computational Geometry: Algorithms and Applications (Springer, Berlin: ). [Google Scholar]
- Duda, R. O., and Hart, P. E. (1973). Pattern Classification and Scene Analysis (Wiley, New York: ). [Google Scholar]
- Engwall, O. (2000). “Are static MRI measurements representative of dynamic speech? Results from a comparative study using MRI, EPG, and EMA,” in Proceedings of the International Conference on Spoken Language Processing, Vol. I, pp. 17–20.
- Engwall, O. (2003). “A revisit to the application of MRI to the analysis of speech production—Testing our assumptions,” in Proceedings of the 6th Seminar on Speech Production, Sydney, Australia, pp. 43–48.
- Hardcastle, W. J. (1976). Physiology of Speech Production: An Introduction for Speech Scientists (Academic, London: ). [Google Scholar]
- Kent, R. D., and Moll, K. L. (1969). “Vocal-tract characteristics of the stop cognates,” J. Acoust. Soc. Am. 46, 1549–1555. 10.1121/1.1911902 [DOI] [PubMed] [Google Scholar]
- Ladefoged, P. (1963). “Loudness, sound pressure, and subglottal pressure in speech,” J. Acoust. Soc. Am. 35, 454–460. 10.1121/1.1918503 [DOI] [Google Scholar]
- Magen, H. S., Kang, A. M., Tiede, M. K., and Whalen, D. H. (2003). “Posterior pharyngeal wall position in the production of speech,” J. Speech Lang. Hear. Res. 46, 241–251. 10.1044/1092-4388(2003/019) [DOI] [PubMed] [Google Scholar]
- MathWorks Inc. (2007). MATLAB version R2007b, MathWorks Inc., Natick, MA.
- Narayanan, S. S., Alwan, A. A., and Haker, K. (1995). “An articulatory study of fricative consonants using magnetic resonance imaging,” J. Acoust. Soc. Am. 98, 1325–1347. 10.1121/1.413469 [DOI] [Google Scholar]
- Ohala, J. J. (1983). “The origin of sound patterns in vocal tract constraints, The Production of Speech (Springer-Verlag, New York: ), Chap. 9, pp. 189–216. [Google Scholar]
- Optoacoustics Ltd. (2007). FOMRI-II version 2.2, Optoacoustics Ltd., Or-Yehuda Israel.
- Perkell, J. S. (1965). “Studies of the dynamics of speech production,” Quarterly Progress Report, Mass. Inst. Tech. Res. Lab. Elect. 76, 253–257. [Google Scholar]
- Perkell, J. S. (1969). Physiology of Speech Production: Results and Implications of a Quantitative Cineradiographic Study (MIT, Cambridge, MA: ). [Google Scholar]
- Proctor, M. I., Shadle, C. H., and Iskarous, K. (2008). “A method of co-registering multiple magnetic resonance imaged vocal tract volumes for fricatives,” in Proceedings of the Joint Meeting of the Acoustical Society of America and European Acoustics Association, Paris, France, pp. 5093–5098.
- Rothenberg, M. (1968). The Breath-Stream Dynamics of Simple-Released-Plosive Production, Biblioteca Phonetica Vol. 6 (Karger, Basel: ). [Google Scholar]
- Shadle, C. H., Proctor, M. I., and Iskarous, K. (2008). “An MRI study of the effect of vowel context on English fricatives,” in Proceedings of the Joint Meeting of the Acoustical Society of America and European Acoustics Association, Paris, France, pp. 5099–5104.
- Stetson, R. H. (1951). Motor Phonetics: A Study of Speech Movements in Action (North-Holland, Amsterdam: ). [DOI] [PubMed] [Google Scholar]
- Subtelny, J. D., Oya, N., and Subtelny, J. D. (1972). “Cineradiographic study of sibilants,” Folia Phoniatrica (Basel) 24, 30–50. 10.1159/000263541 [DOI] [PubMed] [Google Scholar]
- Tiede, M. K., Masaki, S., and Vatikiotis-Bateson, E. (2000). “Contrasts in speech articulation observed in sitting and supine conditions,” in Proceedings of the 5th Seminar on Speech Production, Kloster Seeon, pp. 25–28.
- Westbury, J. R. (1983). “Enlargement of the supraglottal cavity and its relation to stop consonant voicing,” J. Acoust. Soc. Am. 73, 1322–1336. 10.1121/1.389236 [DOI] [PubMed] [Google Scholar]


