Abstract
We propose three-dimensional fluorescence optical tomography (FOT) imaging for small animals guided by simultaneous priors from positron emission tomography (PET). Using a sparsity regularization, the target prior from PET images was incorporated into the reconstruction algorithm for optical imaging. The method and algorithms are validated with numerical simulations and a phantom experiment performed on a combined optical-PET scanner based on a conical mirror geometry.
While continuous-wave (CW) three-dimensional (3D) fluorescence optical tomography (FOT) imaging is limited by relatively low spatial resolution, especially at depth, it is still an attractive, noninvasive approach for imaging the fluorescence biodistribution inside small animals. Multispectral or hyperspectral measurements1, accurate forward modeling2, and novel reconstruction methods3 are among the approaches being explored to improve spatial resolution in 3D FOT. It has also been shown that the spatial resolution of 3D FOT can be improved when anatomical images from x-ray computed tomography (CT) or magnetic resonance imaging (MRI) with relatively higher spatial resolution are applied as a structural prior in the reconstruction of optical images4.
It is common to combine an anatomical imaging modality, such as CT or MRI with a functional imaging modality, such as PET or optical imaging, with the widespread adoption of PET/CT being an obvious example. However, the power of such a combination in improving the resolution of functional images is limited by position and signal mismatches.5,6 The first type of mismatch is caused by subject and/or internal organ movements and could be minimized by systems that permit simultaneous imaging and respiratory gating. But signal mismatches are unavoidable because of the dramatic difference between the information content of anatomical images and functional images.5 In this letter, we propose the use of PET images as prior information for guiding FOT reconstruction, in which signal mismatches can be significantly reduced. For example, if a fluorescent optical probe and PET radionuclide are incorporated into a single biomolecule7 or nanoparticle, simultaneous PET and FOT measurements allow characterization of the temporal and spatial characteristics of these imaging probes with minimal signal mismatch. PET for small animal imaging is a well-developed technology with spatial resolution ~1 mm,8 while 3D FOT is still under development with spatial resolution typically around several millimeters at depth.9 Incorporating PET information as a prior into optical image reconstruction can potentially improve the resolution of optical imaging to around 1 mm. This has important applications when the optical probe is designed to sense its surrounding environment (e.g., oxygen level, pH, protein-protein interactions, “smart” optical probes where fluorescence is activated by the existence of a particular molecule or protein10). In this situation, PET provides fundamentally different information than optical imaging. PET allows the total probe concentration and distribution in the body to be determined, while the fluorescent signal adds further information related to the environment that the probes finds itself in. The PET data therefore identifies the locations where an optical signal could arise and can be used as a constraint in the reconstruction. A second application of combined PET/optical imaging is to study and validate 3D FOT imaging algorithms.
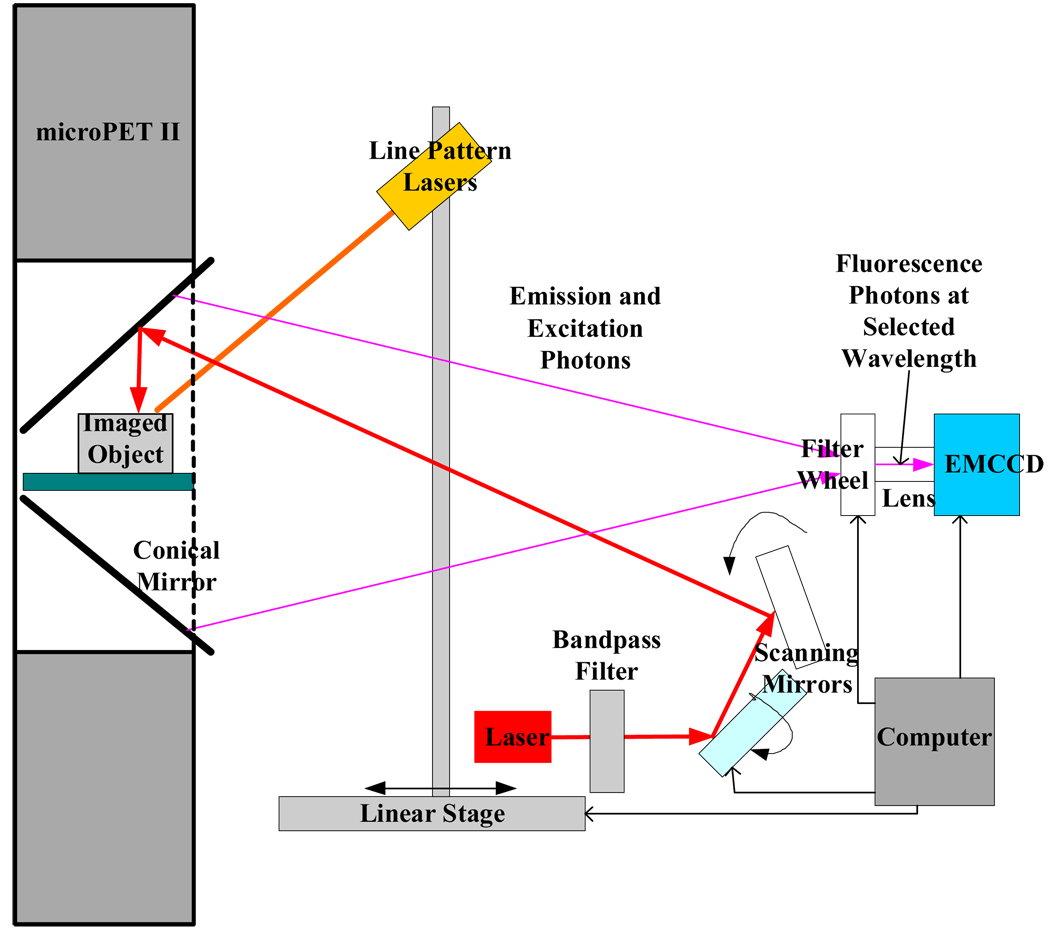
We have developed a conical mirror based 3D FOT system for small animals11 that is compatible with small animal PET scanners allowing simultaneous 3D FOT and PET imaging. This system provides data to allow the use of PET priors in 3D FOT reconstruction to be evaluated. The 3D FOT system has been described in detail elsewhere11. Briefly, as shown in Fig. 1, the optical system uses a conical mirror allowing simultaneous viewing of the entire surface of the animal by an electron multiplying CCD (EMCCD) camera. The mirror fits inside the gantry of a microPET scanner12 for simultaneous collection of PET and 3D FOT data. The axial length of the mirror is 6.25 cm with an axial field of view (FOV) of 6 cm. A 650 nm excitation laser, collimated to a spot diameter of 1 mm was used. Two motorized mirrors scanned the laser beam across the object surface. Bandpass filters, placed inside a filter wheel, were used to select emission wavelengths and fluorescence signal was detected by an EMCCD. The microPET scanner and its performance has been described in detail previously.12
Fig. 1.
Schematic of simultaneous 3D FOT and PET imaging system.
The proposed 3D FOT method using PET priors estimates the 3D optical image x ∈ ℛnj×1 defined on the finite element nodes by the following penalized least squares (PLS) formulation
where y ∈ ℛni×1 is the optical measurement, ni is the total number of optical measurements, and nj is the total number of nodes. P ∈ ℛni× nj is the forward model of the 3D FOT system. It is computed based on the forward model of photon propagation in turbid media at both excitation and emission wavelengths. In the experiments described below, the diffusion equation is solved with the finite element method in MATLAB. The surface boundaries of the object being imaged are obtained by scanning a line pattern laser and the attenuation and scatter coefficients at the excitation and emission wavelengths are assumed to be uniform inside the object. is the sparsity regularization guided by the PET prior and the hyper-parameter α controls the trade-off between data fidelity and prior. The PET guided sparsity regularization has the following form:
where wj is the weighting factor that is determined from the PET image. Here we set wj =1 if the PET activity at the jth node is below a certain threshold and wj =0 otherwise. Note this prior simply encourages the co-location of PET tracer and optical probe, but does not assume any relationship between the PET signal intensity and optical signal intensity. The sparsity penalty is only active outside the region defined by the PET signal. We developed an EM (expectation-maximization) shrinkage algorithm to solve the PLS optimization problem. The hyper-parameter α was selected empirically based on reconstructions of simulated data.
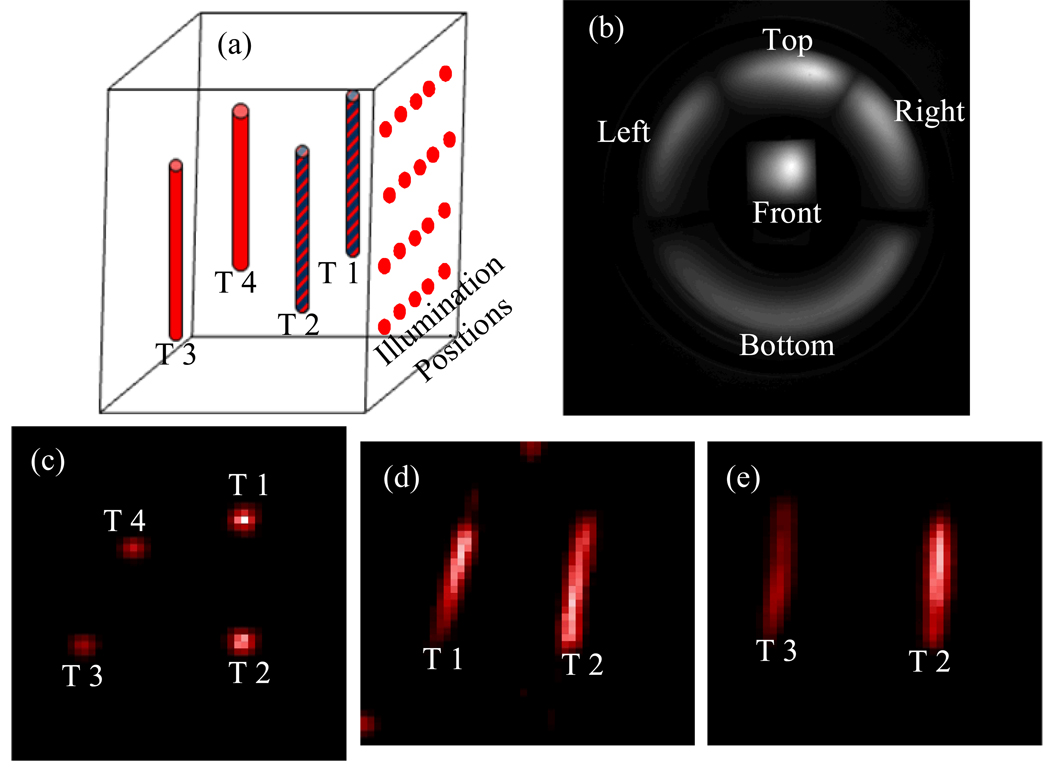
A cubic phantom measuring 32 × 32 × 29 mm3 was composed of 1% intralipid, 2% agar and 20 µM deoxy-hemoglobin to provide realistic optical properties. Four capillary tubes, 1 mm inner diameter and 12 mm long, were embedded inside the phantom. Two of the targets were filled with 6.5 µM DiD fluorescence dye solution. All four targets contained [18F]2-fluoro-2-deoxy-D-glucose (FDG) at an activity level of 100 µCi, uniformly distributed inside the capillary tubes. The cubic phantom was placed at the center of the conical mirror on a transparent stage for simultaneous PET and 3D FOT imaging. The excitation laser scanned the front surface of the phantom (Fig. 2a). Measurements at a wavelength of 720 nm were used for FOT (Fig. 2b). 1057 detector nodes were selected on the four side surfaces of the phantom. A finite element mesh with 8690 nodes and 47581 tetrahedral elements was used for optical forward model calculation. PET images are shown in Figs. 2c–e, where the red color scale indicates relative FDG concentration. From the PET images, we obtained capillary tube positions (the nodes in the finite element mesh) by segmentation with a threshold of 20% of maximum FDG concentration in PET images (see Figs. 4a and 4b for the segmented target zone). This radiotracer prior was used in the 3D FOT reconstruction.
Fig. 2.
(a) cubic phantom with four embedded capillary targets (T1–T4); (b) fluorescence measurements from different surfaces of the cubic phantom placed in the conical mirror; PET images showing transverse (c), sagittal (d) and coronal (e) sections.
Fig. 4.
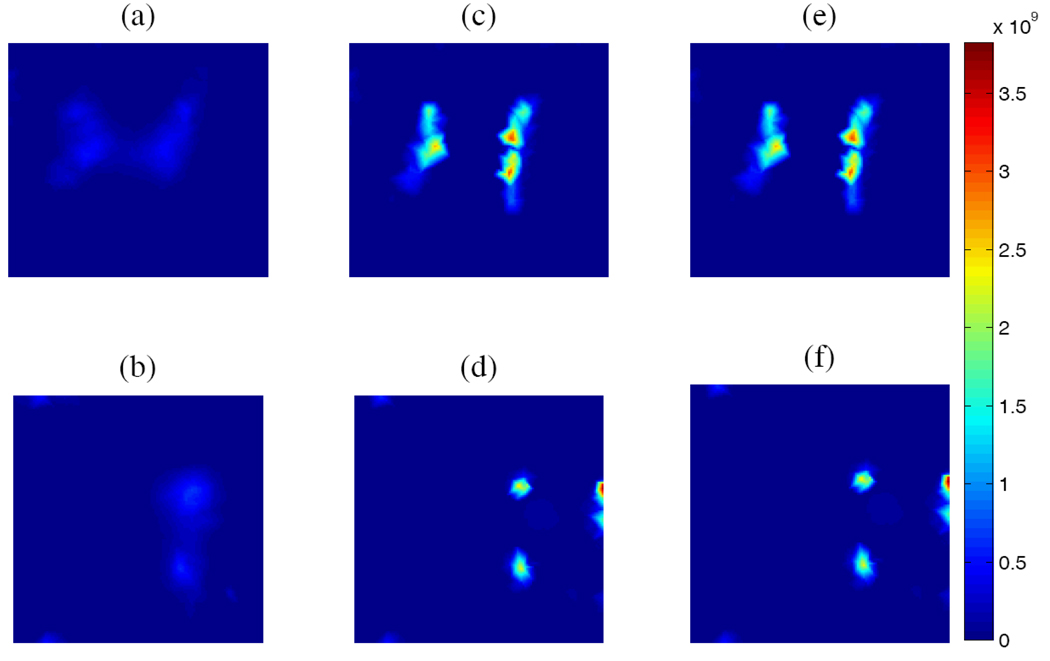
Numerical simulations: True fluorescence concentration for cubic phantom in sagittal (a) and transverse (b) sections. Reconstructed images without prior (c, d) and with prior (e,f). Color bar indicates relative fluorescence concentration.
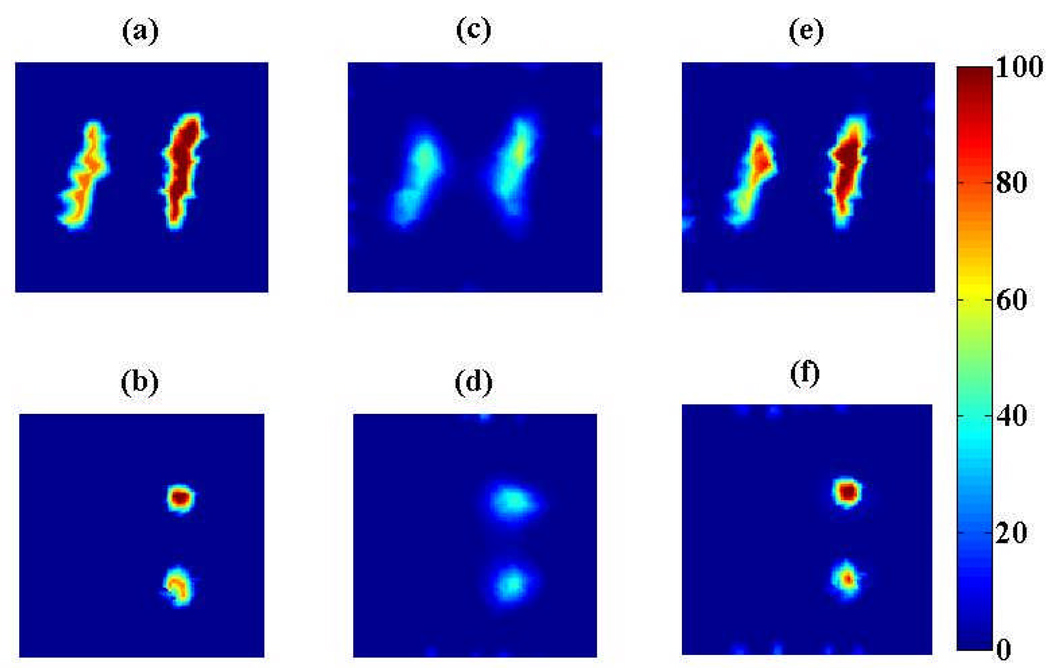
The reconstructed 3D FOT images of the physical phantom are shown in Fig. 3. We studied two different priors. In the first experiment, we used the PET image of the tubes containing the two fluorescence targets (T1 and T2) to construct the prior, i.e., no mismatch. The resulting reconstructed 3D FOT images are shown in Figs. 3c and 3d. In the second experiment, we included targets T3 and T4 where there was only FDG contrast and no fluorescence contrast, i.e., mismatch between PET and FOT images. The resulting reconstructed 3D FOT images are shown in Figs. 3e and 3f. We did not observe any degradation or artifacts introduced from the mismatched prior. From Fig. 3, we see that, without the prior, the two fluorescence targets are detected in right location but with poor spatial resolution (full width at half maximum (FWHM) = 5.2 mm). When the prior was added, the detected targets have better spatial resolution as shown in Figs. 3c–f. In both cases the FWHM is improved to 2.8 mm. Some artifacts are observed at the boundary of the reconstructed image and these are likely due to measurement noise.
Fig. 3.
Reconstructed 3D FOT images from the phantom experiment showing sagittal sections (top row) and transverse sections (bottom row); without prior (a, b), with correct prior (c, d), and with redundant prior (e, f). Color bar indicates relative fluorescence concentration.
For numerical simulation, a cubic phantom with the same dimensions and optical properties as the real phantom was used, with two embedded capillary targets at the same location as T1 and T2 in Fig. 2. The target shape was derived by thresholding the PET image from the measured phantom data. The fluorescence concentrations in the two targets were 100 and 75 (arbitrary units, Figs. 4a and 4b). The background has no fluorescence. The simulation measurements were obtained by forward modeling and 20% Gaussian noise was added to each measurement. Just as in the phantom data, 20 illumination positions were simulated on the front surface and 1057 measurement nodes were simulated on the four side surfaces. The same finite element mesh was used. The reconstructed 3D FOT images with and without the prior at iteration of 2000 are plotted in Fig. 4. Without the sparsity regularization, the mean reconstructed fluorescence concentration in the two targets was 32.8 and 28.5. With the sparsity regularization, these values are 78.1 and 53.4, closer to the true values. The improved resolution of the images that incorporate the PET prior leads to improved quantification by reducing partial volume effects.
In summary, we have proposed a method for 3D FOT reconstruction that utilizes prior information from PET. A reconstruction algorithm has been developed and evaluated with numerical simulation and a phantom experiment. The results demonstrate that a PET prior can improve the spatial resolution and quantitative accuracy of 3D FOT images. The advantage of a PET prior, compared to an anatomical prior from CT or MRI, is the potential to minimize the signal mismatch between the two modalities and hence improve the effect of prior information. This will be of particular value for quantifying fluorescent probes whose signal depends on the biochemical environment or on an interaction with specific proteins. The quality of the reconstructed 3D FOT images could be further improved by using more illumination positions, optimizing illumination patterns, and employing measurements at multiple wavelengths. Future studies will also include the development of dual PET-FOT probes and their applications for in vivo mouse imaging.
References
- 1.Chaudhari AJ, Darvas F, Bading JR, Moats RA, Conti PS, Smith DJ, Cherry SR, Leahy RM. Hyperspectral and multispectral bioluminescence optical tomography for small animal imaging. Phys Med Biol. 2005;50:5421–5441. doi: 10.1088/0031-9155/50/23/001. [DOI] [PubMed] [Google Scholar]
- 2.Yuan Z, Hu XH, Jiang HB. A higher order diffusion model for three-dimensional photon migration and image reconstruction in optical tomography. Phys Med Biol. 2009;54:65–88. doi: 10.1088/0031-9155/54/1/005. [DOI] [PubMed] [Google Scholar]
- 3.Ahn S, Chaudhari AJ, Darvas F, Bouman CA, Leahy RM. Fast iterative image reconstruction methods for fully 3D multispectral bioluminescence tomography. Phys Med Biol. 2008;53:3921–3942. doi: 10.1088/0031-9155/53/14/013. [DOI] [PMC free article] [PubMed] [Google Scholar]
- 4.Barnett AH, Culver JP, Sorensen AG, Dale A, Boas DA. Robust inference of baseline optical properties of the human head with three-dimensional segmentation from magnetic resonance imaging. Appl Optics. 2003;42:3095–3108. doi: 10.1364/ao.42.003095. [DOI] [PubMed] [Google Scholar]
- 5.Comtat C, Kinahan PE, Fessler JA, Beyer T, Townsend DW, Defrise M, Michel C. Clinically feasible reconstruction of 3D whole-body PET/CT data using blurred anatomical labels. Phys Med Biol. 2002;47:1–20. doi: 10.1088/0031-9155/47/1/301. [DOI] [PubMed] [Google Scholar]
- 6.Culver J, Akers W, Achilefu S. Multimodality molecular imaging with combined optical and SPECT/PET modalities. J Nucl Med. 2008;49:169–172. doi: 10.2967/jnumed.107.043331. [DOI] [PubMed] [Google Scholar]
- 7.Edwards WB, Xu B, Akers W, Cheney PP, Liang K, Rogers BE, Anderson CJ, Achilefu S. Agonist-antagonist dilemma in molecular imaging: Evaluation of a monomolecular multimodal imaging agent for the somatostatin receptor. Bioconjugate Chem. 2008;19:192–200. doi: 10.1021/bc700291m. [DOI] [PMC free article] [PubMed] [Google Scholar]
- 8.Yang YF, Wu YB, Qi JY, James SS, Du HN, Dokhale PA, Shah KS, Farrell R, Cherry SR. A prototype PET scanner with DOI-encoding detectors. J Nucl Med. 2008;49:1132–1140. doi: 10.2967/jnumed.107.049791. [DOI] [PMC free article] [PubMed] [Google Scholar]
- 9.Zacharakis G, Ripoll J, Weissleder R, Ntziachristos V. Fluorescent protein tomography scanner for small animal imaging. Ieee Transactions on Medical Imaging. 2005;24(7):878–885. doi: 10.1109/tmi.2004.843254. [DOI] [PubMed] [Google Scholar]
- 10.Weissleder R, Tung CH, Mahmood U, Bogdanov A., Jr. In vivo imaging of tumors with protease-activated near-infrared fluorescent probes. Nat Biotechnol. 1999;17:375–378. doi: 10.1038/7933. [DOI] [PubMed] [Google Scholar]
- 11.Li CQ, Mitchell GS, Dutta J, Ahn S, Leahy RM, Cherry SR. A three-dimensional multispectral fluorescence optical tomography imaging system for small animals based on a conical mirror design. Opt Express. 2009;17:7571–7585. doi: 10.1364/oe.17.007571. [DOI] [PMC free article] [PubMed] [Google Scholar]
- 12.Yang Y, Tai YC, Siegel S, Newport DF, Bai B, Li Q, Leahy RM, Cherry SR. Optimization and performance evaluation of the microPET II scanner for in vivo small-animal imaging. Phys Med Biol. 2004;49:2527–2545. doi: 10.1088/0031-9155/49/12/005. [DOI] [PubMed] [Google Scholar]


