

Abstract
Rationale and Objective
To assess similarities and differences between methods of performance comparisons under binary (yes/no) and receiver operating characteristic (ROC) -type pseudo-continuous (0-100) rating data ascertained during an observer performance study of interpretation of full field digital mammography (FFDM) versus FFDM plus digital breast tomosynthesis (DBT).
Materials and Methods
Rating data consisted of ROC-type pseudo-continuous and binary ratings generated by 8 radiologists evaluating 77 digital mammography examinations. Overall performance levels were summarized with a conventionally used probability of correct discrimination, or equivalently the area under the ROC curve (AUC), which under a binary scale is related to Youden's index. Magnitudes of differences in the reader-averaged empirical AUCs between an FFDM alone mode versus an FFDM plus DBT mode were compared in the context of fixed and random reader variability of the estimates.
Results
The absolute differences between modes using the empirical AUCs were larger on average for the binary scale (0.12 vs. 0.07) and for the majority of individual readers (6 out of 8). Standardized differences were consistent with this finding (2.32 vs. 1.63 on average). Reader-averaged differences in AUCs standardized by fixed and random-reader variances were also smaller under the binary rating paradigm. The discrepancy between AUC differences depended on the location of the reader-specific binary operating points.
Conclusion
The human observer's operating point should be a primary consideration in designing an observer performance study. Although in general, the ROC-type rating paradigm provides more detailed information on the characteristics of different modes it does not reflect the actual operating point adopted by human observers. There are application-driven scenarios where analysis based on binary responses may provide statistical advantages.
Keywords: breast cancer, digital breast tomosynthesis, observer performance, rating scale
Introduction
Performance assessments and comparisons of technologies and practices in radiology and other imaging based fields require complicated, time consuming, expensive studies, in particular when the observer is considered an integral part of the diagnostic system. Retrospective studies are frequently used for this purpose [1-3]; however, in recent years prospective studies have also been used and have essentially become the gold standard for large “pivotal” studies [4–7]. Regardless of the particular study design, rating data are often collected under a conventional receiver operating characteristic (ROC) type paradigm and are used to indicate the level of confidence in a particular noteworthy finding (or a suspected finding) in question. Whether the rating scale being used is discrete (e.g. 5-categories) or pseudo-continuous (e.g. 101 categories, 0-100), and whether the data are collected for examinations as a whole (ROC) or for findings within examinations (free-response ROC or region of interest paradigms), ultimately, a decision threshold (explicit or latent) is used to obtain a “clinically relevant” performance characteristic (e.g. sensitivity, specificity, or predictive values). The multi-category (more refined than binary) rating scale was originally introduced in human observer studies for simultaneously acquiring information on operating characteristics at different thresholds, which is impossible under a binary scale. Furthermore, since more substantive (non-nuisance) information about a specific phenomenon results, in general, in a more efficient analysis, it is often naturally assumed that the ROC approach is more sensitive to differences in measured performance levels between technologies and practices than the binary approach. However, not all additional information offered by a more complex paradigm such as ROC or FROC is always relevant for the specific question of interest. For example, for diagnostic procedures used in a study for screening purposes the clinically relevant question may relate only to the ROC points with high specificity, making the part of the ROC curve with low specificity largely irrelevant for the specific question being addressed. In addition to the possible uselessness of “additional information” there are a large number of variables (factors) that may affect the ability to discriminate between systems or practices under different scales and some of these factors are potentially observer behavior dependent (e.g. rating scale, interpretation environment, knowledge of prevalence, or possible impact on patient care as a result of the recommendations made) [8-14]. It is well known that it is possible to construct examples where the analysis based on the binary operating points leads to statistical advantages compared to the traditional analysis based on multi-category scales (e.g. difference between specific points on two crossing ROC curves with the same AUC). However, the existence of actual experimental conditions resulting in data sets favoring the use of the natural binary operating points has not been demonstrated in medical imaging.
As a part of an observer study to assess performance using digital breast tomosynthesis (DBT) under different practice conditions / display modes, we asked observers to rate every examination using both a binary rating scale for the examination as a whole and a pseudo-continuous rating scale (0,…,100) for suspicious abnormalities depicted on the images. From this observer study a subset of the examinations that had either only one abnormality associated with a verified cancer or no depicted abnormalities (either malignant nor benign) was used to investigate whether or not an analysis based on multi-category ROC ratings for each examination as a whole (approximated by the highest rating) was actually more sensitive to demonstrating differences in performance than the case based binary rating scale.
Methods
General Study Design
The digital mammography images used in this study, consisting of full field digital mammography (FFDM) images and DBT image sets, have been described in detail elsewhere [15]. In brief, during acquisition the breast is compressed in a conventional manner, and the x-ray tube moves along a limited arc allowing 15 low dose images to be acquired rather than the single image acquired during a “conventional” FFDM examination. DBT acquisitions were performed at a combined radiation dose comparable to a FFDM examination with average mid breast dose of approximately 2mGy per view. Following acquisition, the data from the projection images are used to reconstruct between 50 and 90 parallel, 1 millimeter thick, slices (i.e., the 3-D DBT dataset) depending on the thickness of the compressed breast.
The acquisition of all examinations was performed under Institutional Review Board (IRB) approved protocols that included a signed informed consent by the participant. The informed consent was obtained after the procedure had been fully explained to the participant. The reading study used an FFDM alone mode and a “combined” (FFDM plus DBT) mode that we believe may ultimately be similar to future clinical practices if indeed DBT is ultimately adopted clinically for interpretation of screening examinations.
All reviews and ratings were performed on our in-house designed workstation [16]. The workstation (Dual Core AMD Opteron™, Processor 270, 2 GHz, and 6.00 GB of RAM) operates under Microsoft Window Server 2003. The workstation display consisted of two high-resolution (2048 × 2560), 8-bit grayscale, portrait monitors at a nominal setting of 80 ftL. Two Dome C5i flat-panel monitors (Planar Systems, Beaverton, OR, USA) were used for image display.
A management program determined the reading modes and sessions for individual observers and the order of displayed examinations within a session. All examinations were reviewed twice, once under each mode with a predetermined minimum delay of 60 days between reviews of the same case under consecutive modes [15].
Breast Findings
The original study included 125 examinations [15] that were assessed using both screening BIRADS (0, 1, 2) and pseudo-continuous FROC approach. To generate binary and multi-category ROC rating datasets, we selected for this analysis all examinations that were negative for all abnormalities in question (benign or malignant) and all examinations that depicted a single abnormality associated with a verified cancer. This case selection protocol was performed solely for the purpose of improving the approximation to ROC ratings. As a result, 54 negative examinations and 23 examinations depicting a single abnormality associated with a verified cancer are included in our analysis. The subjective breast density ratings distribution (breast density BIRADS 1, 2, 3, 4) of the examinations used in this study are 12/77 (15.6%), 60/77 (77.9%) and 5/77 (6.5%) for BIRADS 2, 3 and 4, respectively. The right versus left breast distribution for the 77 examinations is 42/77 (54.5%) and 35/77 (45.5%), respectively.
Observers
Eight board-certified, Mammography Quality Standards Act (MQSA) –qualified radiologists read the “FFDM alone” and the “combined FFDM plus DBT” modes.
Performance of the Study
Under each mode, radiologists were asked specifically to independently review and rate each examination for the presence or absence of the abnormalities in question. The observers were to assume the examinations were initial screening examinations (i.e. no priors) and there was only one breast imaged with two corresponding views. The observer could click on any suspicious region using a computer mouse. After marking the region, the type of abnormality in question was identified and two “pseudo-continuous” (0 -100) rating scales (sliders) appeared, one for the likelihood of the presence (or absence) of the abnormality and one for assessing the likelihood that the abnormality in question is associated with a cancer (or not). For each marked location the observer was asked if the same abnormality is depicted on the ipsilateral view (yes/no) and if he/she answered yes, they were asked to mark the location and to independently rate (image based) the presence and cancer likelihoods as depicted on the corresponding view. Multiple locations could be marked and rated on the same examination as deemed appropriate. If no abnormality was detected, the reader could just click on the “done” button at the bottom of the display. Upon completion of the ratings of all suspected abnormalities within an examination, the observer was asked to provide his/her screening BIRADS recommendation for the examination in question as a “diagnostic unit” (i.e. 0 for “recall”, 1 for “negative”, or 2 for “benign” findings). At anytime during the interpretation of an examination the observer could edit, remove, or add marks as deemed appropriate. ROC – ratings for examinations as a whole (probability of presence of any abnormality) were not collected directly in this study. In this analysis we approximate the ROC ratings by considering examinations with only a single verified cancer or no abnormality (negative), which are likely to lead to a single or no response. The sole focus of this article is on sensitivity to changes in performance under the binary and ROC type responses.
Data Analysis
The fact that each actually positive examination depicted only a single verified cancer permits a straightforward dichotomization of the screening BIRADS ratings into “recall” (“presumed positive”) and “non-recall” (“presumed negative”), where the latter category includes screening BIRADS ratings 1 and 2 (or “negative” and “benign findings”). We also verified the consistency of our results by dichotomizing only the screening “negative” BIRADS ratings (only BIRADS 1) into a “negative” group and a “non-negative” group (including BIRADS 0 and 2). The overall pseudo-continuous ratings for every examination were obtained as the maximum of the ratings for any suspicious lesion marked within an examination. Since all actually positive examinations depicted only one abnormality we minimized the possibility for multiple findings per examination; hence, enabled a better approximation of the overall examination-based rating.
As a modality-specific performance summary index for both the binary and pseudo-continuous rating scales we used the area under the empirical ROC curve [17]:
| (1) |
where xi and yj are ratings for the actually negative and actually positive examinations, correspondingly. Under the binary scale this index is equivalent to a linear scale transformation of a widely used Youden's index [18].
| (2) |
In the presence of pseudo-continuous ratings the area under the empirical ROC curve (eq. 1) is widely used as a summary index. This is due not only to a reasonably “natural” summary of the ROC curve but also due to the convenient interpretation as a probability of correct discrimination in a 2-alternative forced choice (2AFC) task based on continuous ratings [17]. The binary AUC (eq. 2) is not nearly as interesting a summary of the underlying ROC “curve”; however, it preserves the interpretation of correct discrimination in a 2AFC task (based on binary ratings). The scalar nature and analog interpretation of the two indices combined with their common use provides justification for a comparison of the two qualitatively different ratings scales, as considered in this paper.
Between modality differences with respect to two different indices could result in a difference in range (or variability) of values for a given sample. To adjust for this possibility we also considered standardized differences. The variability for a single AUC and for the difference between two AUCs for every reader was estimated using a one-sample jackknife variance estimator implied by the conventional MRMC–DBM methodology as developed by Dorfmann, Berbaum, and Metz [19] (i.e. cases were jackknifed regardless of their true status). The standardized differences for the reader-averaged AUCs were also computed according to the DBM approach (See Appendix for details).
Results
Table 1 summarizes the estimates for the eight individual readers, as well as the average performance levels for the group as a whole. One can observe that all reader-specific differences in the AUCs for the FFDM and FFDM plus DBT modes are negative regardless of the scale (i.e. there is no disagreement across readers as to the modality with better diagnostic performance whether the scale is binary or pseudo-continuous). Despite this general agreement Table 1 also demonstrates the tendency of the differences in AUCs to be more extreme under the binary rating scale than that under the pseudo-continuous rating scale. Indeed, as compared with the pseudo-continuous rating scale, the absolute value of the computed average AUC difference under the binary scale is 0.12 (versus 0.07) and 6 of 8 readers had individual absolute AUC differences that were larger under the binary scale.
Table 1. Comparison of the two modalities under the binary and pseudo-continuous derived indices using probability of correct discrimination (AUC*).
| Reader | FPF | TPF | Binary Scale | Pseudo-Continuous Scale | ||||||||
|---|---|---|---|---|---|---|---|---|---|---|---|---|
| FFDM | Combo | FFDM | Combo | FFDM | Combo | Difference | Z | FFDM | Combo | Difference | Z | |
| 1 | 0.35 | 0.15 | 0.96 | 1.00 | 0.80 | 0.93 | -0.12 | -2.93 | 0.93 | 0.97 | -0.04 | -1.18 |
| 2 | 0.04 | 0.04 | 0.83 | 0.91 | 0.89 | 0.94 | -0.04 | -1.21 | 0.91 | 0.97 | -0.06 | -1.57 |
| 3 | 0.20 | 0.06 | 0.70 | 0.83 | 0.75 | 0.89 | -0.14 | -2.92 | 0.83 | 0.95 | -0.12 | -2.38 |
| 4 | 0.31 | 0.15 | 0.87 | 1.00 | 0.78 | 0.93 | -0.15 | -2.77 | 0.89 | 0.99 | -0.10 | -1.95 |
| 5 | 0.17 | 0.13 | 0.78 | 0.91 | 0.81 | 0.89 | -0.08 | -1.44 | 0.90 | 0.96 | -0.06 | -1.63 |
| 6 | 0.50 | 0.09 | 0.91 | 0.83 | 0.71 | 0.87 | -0.16 | -2.60 | 0.88 | 0.91 | -0.02 | -0.48 |
| 7 | 0.31 | 0.09 | 0.91 | 0.91 | 0.80 | 0.91 | -0.11 | -2.48 | 0.95 | 0.97 | -0.02 | -1.24 |
| 8 | 0.15 | 0.09 | 0.70 | 0.87 | 0.77 | 0.89 | -0.11 | -2.23 | 0.82 | 0.95 | -0.13 | -2.68 |
| Overall | 0.25 | 0.10 | 0.83 | 0.91 | 0.79 | 0.90 | -0.12 | -5.00** | 0.89 | 0.96 | -0.07 | -2.73** |
Both AUCs computed from the binary and pseudo-continuous rains are the probabilities of the correct discrimination in the 2-AFC task where decisions are based on the correspondingly ratings.
The z-statistic for the fixed-reader inferences. For random reader inferences the z-statistics are -5.58 and -2.62 correspondingly
From the estimates of the standardized reader-averaged differences (the ratio of the differences to the square root of the variance estimator, or z-statistic) one can observe that the binary scale in this scenario offers advantages with regard to both fixed and random reader considerations (i.e., -5.00 vs. -2.73 for fixed readers and -5.6 vs. -2.62 for random readers). Interestingly, not only are the corresponding variability estimates not large enough in the binary scale to overcome the differences in raw indices but also the estimates of the fixed and random-reader variability are actually smaller under the binary scale. Standardized differences for the individual readers are consistent with the reader-averaged finding, namely reader-specific z-statistics tend to be slightly more extreme under the binary scale with an average of -2.32 (versus -1.64).
We note that under dichotomization of the BIRADS ratings into “negative” and “non-negative” we observed similar tendencies. The average differences in the AUCs under the binary and pseudo-continuous scales were -0.10 and -0.07, respectively. The standardized difference of average AUCs for both fixed and random reader inferences (-4.55 vs. -2.73 and -4.09 vs. -2.62) and individual standardized differences (on average -2.05 vs. -1.64) also are greater on the binary scale. Again, the binary scale led to a smaller estimated fixed-reader variance and a random-reader variance.
Discussion
The multi-category rating ROC approach allows for adjustments for the differences in latent thresholds during the analysis and has been widely investigated and accepted as the preferred tool for assessing differences (if any) in performance summary indices between modes of operation. In one of our previous papers [20] we demonstrated the possible disadvantages that could result from forcing an “unnatural” multi-category rating scale onto a truly binary diagnostic task. However, there are tasks for which multi-category scales allow one to elicit information that can be useful for some purposes that could be only indirectly related to the question of interest. This is the type of study we considered in this paper.
It is a widely accepted belief that the use of a multi-category assessment should result in comparable, or even superior, ability to detect differences in performance levels between diagnostic systems as compared with computed difference under the binary (“yes/no”) rating approach. This is sometimes interpreted to mean that the binary rating paradigm will result in smaller differences, larger variability, and less of a statistically significant difference. However, there are known exceptions to this notion. The analysis of experimental data presented here demonstrates advantages of the binary scale caused by yet a different phenomenon that could be present in human observer studies.
In this experiment, the operating points adopted by the readers under the binary scale led to a larger difference in the binary AUCs (linear transformation of Youden's index). As inter-mode comparisons depend on different factor including but not limited to the actual underlying systems based differences, the behavior of the observers under the study conditions (including case mix and subtlety) and the actual resulting locations of the operating points being compared along the underlying performance curves, as derived from the ratings, it is quite possible that in some experiments the binary rating approach may have advantages over the use of a multi-category rating scale.
This observation can be partially explained with the following simple hypothetical example. Figure 1 shows performance curves (A) and (B) for two hypothetical systems with differing AUCs and three pairs of operating points at different regions of the performance curves. The regions of the curves at which the experimentally measured operating points appear can substantially affect the differences observed between the systems under a binary response paradigm regardless of the differences in AUCs. In the left and right regions of the curves (p11 versus p12 and p31 versus p32) the differences tend to be smaller than in the middle of the curve (p21 versus p22). Also, in instances when points are located in different regions on the two curves (e.g. p31 versus p22) the binary response may actually result in larger differences between overall summary performance indices. However, as we demonstrated in our analysis the consideration in regards to variability further supported the advantages of the binary scale in terms of the standardized differences in this example.
Figure 1.
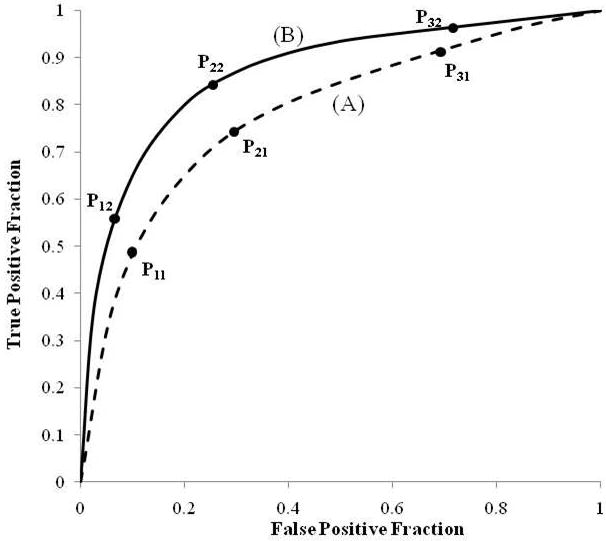
Two hypothetical ROC representing performance curves of two systems with three hypothetical pairs of corresponding operating points along the same curves simulating binary response type results.
We focused here on the AUC index as it is one of the most frequently used indices and it provides both a summary of the ROC curve as well as an index with a convenient interpretation of the probability of correct discrimination in a 2AFC task. Under the binary scale the ROC curve is represented as a trivial bi-segment linear contour and is of little interest on its own. However, the AUC remains a useful index (related to Youden's index) with a relevant interpretation of the correct discrimination in a 2 AFC task. We exploited the similarity between the AUCs under the binary and multi-category scales to make the comparison.
However, analogy between the indices does not imply any type of concordance of the study conclusions. The difference between two AUCs of the entire ROC curve, and of a pair of operating points, depends on the location of these points along the curves and may be not only different in magnitude but also could be of opposite signs [21]. At the same time, there exist certain inequalities between the true values of these two indices. For example, an area under a concave ROC curve is always larger than a “binary” AUC computed for a single point (eq. 2). Although this inequality may not hold for the estimated (as opposed to true) values in our example, all computed individual AUCs under the binary scales were smaller than those computed for the pseudo-continuous scale.
The standardized difference we considered in this manuscript is based on the variances implied by the Dorfman, Berbaum and Metz (DBM) procedure [19] (see Appendix). For the single reader and reader-averaged differences the fixed reader variances are equivalent to the one-sample jackknife variance of the corresponding estimators (see Appendix). In general, estimates of random-reader variances tend to be larger than fixed-reader variances. However, in some estimation approaches, such as the DBM and unbiased [22] approaches, estimates of random-reader variability could be smaller than the fixed-reader counterpart, though this would result from insufficient data rather than being a reality. We verified that our conclusions in regards to reduction in the fixed and random-reader variability under the binary scale holds not only with the DBM methodology but also when using unbiased and bootstrap approaches.
One cannot make general conclusions about the statistical power based on a comparison of varying levels of statistical significance in an individual dataset! This is the objective of the future studies. The example presented here highlights the need to carefully consider the best approach to address a specific question during an observer performance study, including the use of a specific rating scale (in this study a multi-category rating ROC approach versus a binary rating approach). This is relevant in particular for human observer studies because the relative efficiency of the two rating scales may depend on actually where the binary operating points are on the underlying ROC curve, and there is no direct control over the experimental operating points that may actually be adopted by human interpreters. The real-life example provided in this paper is based on data collected during a controlled laboratory experiment. The generalization of the characteristics of diagnostic systems from the laboratory to the clinical environment is not a given [10]. However, the principle illustrated here demonstrates a general phenomenon that could exist in any type of human observer data. Pilot studies with representative cases may be extremely helpful in these cases. When appropriate, possible and relevant, we also recommend that the collection of observer ratings under more than one scale (in this case both binary and ROC-type) is considered by investigators as a study design option.
Conclusion
In observer performance studies, it is important that in study design one considers the possible impact of the observer (s) binary operating points on the study conclusions. In observer-performance studies the statistical properties of a traditional ROC approach compared to the binary paradigm may depend upon where the natural operating points are on the underlying ROC curves and these are not typically controlled by design. The example considered in this paper used experimentally ascertained data demonstrating such a phenomenon.
Acknowledgments
This is work is supported in part by Grants EB001694, EB002106, EB003503, (to the University of Pittsburgh) from the National Institute for Biomedical Imaging and Bioengineering (NIBIB), National Institute of Health and in part by Grant BCTR0600733 (to the University of Pittsburgh) from the Susan G. Komen foundation.
Appendix
Within the multi-reader ANOVA framework used by Dorfman Berbaum and Metz [19] and by Obuchowski and Rockette [23] the primary statistic is a ratio of two mean sums of squares (MSS) [25]. When applied to the nonparametric estimator of the AUC (eq. 2) these ratios can be written in a closed form equivalent to the squared value of a certain z-statistic. The numerator MSS can be shown to be proportional to the squared reader-average difference in AUCs, namely:
where NR is the number of readers, and
are the average (D̄ℝℂ) and reader-specific (Drℂ) differences in the empirical AUCs. This and following equalities are based on a simple structure of the pseudo-values for the AUC difference, i.e.:
The denominator, for fixed reader inferences is, by definition, proportional to the one-sample jackknife variance of the AUC difference, namely:
where bar on the top of a quantity denotes a simple average over the lowercase indices and
| (A1) |
For random-readers inferences the combination of MSSs in the denominator (written in the general form presented in [25]) is proportional to the following combination of the jackknife-variances and the sample variance of the reader-specific AUC estimates:
where is a sample variability of the reader-specific differences in AUCs, V̂J1 (D̄ℝℂ ∣ ℝ) is a one-sample jackknife variance of the average difference and is the average of NR reader-specific variance of differences. The jackknife variance for an individual reader can be obtained from (A1) by replacing w̄i••, w̄•j• and w̄••• with w̄i•r, w̄•jr and w̄••r correspondingly. The last equality follows representation of the random-reader variance as a combination of the variance components [e.g. 22].
Thus, in general, the DBM statistic for comparing two modalities can be written as the following z-type statistic (or standardized difference) [24]:
for the fixed and random-reader inferences, correspondingly. As conventional in ANOVA methodology, under the DBM approach the statistical significance of the z-statistics is assessed using an F (Snedecor's) distribution with specific degrees of freedom rather than the standard normal distribution.
Other variance estimation approaches also permit closed form formulation for either a single empirical AUC or an AUC difference [22]. For example, the unbiased variance estimator [25] can be obtained using the same formulation while substituting the unbiased variance operator for the variance of the average difference for each of the averaged variances. The bootstrap variance estimator is equivalent to adding sample variability over NR to the bootstrap variance of the average difference [26].
Footnotes
Publisher's Disclaimer: This is a PDF file of an unedited manuscript that has been accepted for publication. As a service to our customers we are providing this early version of the manuscript. The manuscript will undergo copyediting, typesetting, and review of the resulting proof before it is published in its final citable form. Please note that during the production process errors may be discovered which could affect the content, and all legal disclaimers that apply to the journal pertain.
References
- 1.Fenton JJ, Taplin SH, Carney PA, et al. Influence of computer-aided detection on performance of screening mammography. N Engl J Med. 2007 Apr 5;356(14):1399–409. doi: 10.1056/NEJMoa066099. [DOI] [PMC free article] [PubMed] [Google Scholar]
- 2.Awai K, Murao K, Ozawa A, et al. Pulmonary nodules: estimation of malignancy at thin-section helical CT--effect of computer-aided diagnosis on performance of radiologists. Radiology. 2006 Apr;239(1):276–84. doi: 10.1148/radiol.2383050167. [DOI] [PubMed] [Google Scholar]
- 3.Gur D, Sumkin JH, Rockette HE, et al. Changes in breast cancer detection and mammography recall rates after the introduction of a computer-aided detection system. J Natl Cancer Inst. 2004 Feb 4;96(3):185–90. doi: 10.1093/jnci/djh067. [DOI] [PubMed] [Google Scholar]
- 4.Andriole GL, Crawford ED, Grubb RL, 3rd, et al. PLCO Project Team Mortality results from a randomized prostate-cancer screening trial. N Engl J Med. 2009 Mar 26;360(13):1310–9. doi: 10.1056/NEJMoa0810696. Epub 2009 Mar 18. Erratum in. [DOI] [PMC free article] [PubMed] [Google Scholar]; N Engl J Med. 2009 Apr 23;360(17):1797. [Google Scholar]
- 5.Pisano ED, Gatsonis C, Hendrick E, et al. Digital Mammographic Imaging Screening Trial (DMIST) Investigators Group Diagnostic performance of digital versus film mammography for breast-cancer screening. N Engl J Med. 2005 Oct 27;353(17):1773–83. doi: 10.1056/NEJMoa052911. Epub 2005 Sep 16. Erratum in. [DOI] [PubMed] [Google Scholar]; N Engl J Med. 2006 Oct 26;355(17):1840. [Google Scholar]
- 6.Clark KW, Gierada DS, Marquez G, et al. Collecting 48,000 CT Exams for the Lung Screening Study of the National Lung Screening Trial. J Digit Imaging. 2008 Sep 6; doi: 10.1007/s10278-008-9145-9. Epub ahead of print. [DOI] [PMC free article] [PubMed] [Google Scholar]
- 7.Lehman CD, Gatsonis C, Kuhl CK, et al. ACRIN Trial 6667 Investigators Group MRI evaluation of the contralateral breast in women with recently diagnosed breast cancer. N Engl J Med. 2007;356(13):1295–303. doi: 10.1056/NEJMoa065447. [DOI] [PubMed] [Google Scholar]
- 8.Rockette HE, Gur D, Metz CE. The use of continuous and discrete confidence judgments in receiver operating characteristic studies of diagnostic imaging techniques. Invest Radiol. 1992;27(2):169–172. doi: 10.1097/00004424-199202000-00016. [DOI] [PubMed] [Google Scholar]
- 9.Berbaum KS, Dorfman DD, Franken EA, Jr, Caldwell RT. An empirical comparison of discrete ratings and subjective probability ratings. Acad Radiol. 2002;9(7):756–763. doi: 10.1016/s1076-6332(03)80344-6. [DOI] [PubMed] [Google Scholar]
- 10.Gur D, Bandos AI, Cohen CS, et al. The “laboratory” effect: comparing radiologists' performance and variability during prospective clinical and laboratory mammography interpretations. Radiology. 2008 Oct;249(1):47–53. doi: 10.1148/radiol.2491072025. [DOI] [PMC free article] [PubMed] [Google Scholar]
- 11.Berbaum KS, Franken EA, Dorfman DD, et al. Satisfaction of search in diagnostic radiology. Investigative Radiology. 1990;25:133–140. doi: 10.1097/00004424-199002000-00006. [DOI] [PubMed] [Google Scholar]
- 12.Egglin TKP, Feinstein AR. Context bias: A problem in diagnostic radiology. JAMA. 1996;276(21):1752–1755. doi: 10.1001/jama.276.21.1752. [DOI] [PubMed] [Google Scholar]
- 13.Gur D, Bandos AI, Fuhrman CR, Klym AH, King JL, Rockette HE. The prevalence effect in laboratory environment: changing the confidence ratings. Academic Radiology. 2007;14(1):49–53. doi: 10.1016/j.acra.2006.10.003. [DOI] [PMC free article] [PubMed] [Google Scholar]
- 14.Zhou XH, Obuchowski NA, McClish DK. Statistical methods in diagnostic medicine. New York: Wiley & Sons Inc.; 2002. [Google Scholar]
- 15.Gur D, Abrams GS, Chough DM, et al. Original Research. Digital Breast Tomosynthesis: Observer Performance Study. Am J Roentgenol. 2009 Aug;193(2):586–91. doi: 10.2214/AJR.08.2031. [DOI] [PubMed] [Google Scholar]
- 16.Good WF, Abrams GS, Catullo VJ, et al. Digital breast tomosynthesis: a pilot observer study. AJR Am J Roentgenol. 2008 Apr;190(4):865–9. doi: 10.2214/AJR.07.2841. [DOI] [PubMed] [Google Scholar]
- 17.Hanley JA, McNeil BJ. The meaning and use of the Area under Receiver Operating Characteristic (ROC) Curve. Radiology. 1982;143:29–36. doi: 10.1148/radiology.143.1.7063747. [DOI] [PubMed] [Google Scholar]
- 18.Hilden J, Glasziou P. Regret graphs, diagnostic uncertainty and Youden's index. Statistics in Medicine. 1996;15:969–986. doi: 10.1002/(SICI)1097-0258(19960530)15:10<969::AID-SIM211>3.0.CO;2-9. [DOI] [PubMed] [Google Scholar]
- 19.Dorfman DD, Berbaum KS, Metz CE. Receiver operating characteristic rating analysis: generalization to the population of readers and patients with the jackknife method. Investigative Radiology. 1992;27:723–731. [PubMed] [Google Scholar]
- 20.Gur D, Rockette HE, Bandos AI. “Binary” and “Non-Binary” Detection Tasks: Are Current Performance Measures Optimal? Academic Radiology. 2007;14(7):871–876. doi: 10.1016/j.acra.2007.03.014. [DOI] [PubMed] [Google Scholar]
- 21.Gur D, Bandos AI, Klym AH, et al. Agreement of the order of overall performance levels under different reading paradigms. Academic Radiology. 2008;15(12):1567–1573. doi: 10.1016/j.acra.2008.07.011. [DOI] [PMC free article] [PubMed] [Google Scholar]
- 22.Gallas B, Bandos AI, Samuelson F, Wagner R. A framework for random-effects ROC analysis: biases with the bootstrap and other variance estimators. Communications in Statistics, Theory and Methods. 2009;38(15):2586–2603. [Google Scholar]
- 23.Obuchowski NA, Rockette HE. Hypothesis testing of the diagnostic accuracy for multiple diagnostic tests: an ANOVA approach with dependent observations. Communications in Statistics -- Simulation and Computation. 1995;24:285–308. [Google Scholar]
- 24.Bandos AI, Rockette HE, Gallas BD, Gur D. IBS ENAR. Atlanta, GA: Mar, 2007. Multi-reader ROC methods: explicit formulations and relationships between OR, DBM, Multi-WMW, BWC, One-Shot and others. [Google Scholar]
- 25.Hillis SL, Obuchowski NA, Schartz KM, Berbaum KS. A comparison of the Dorfman– Berbaum–Metz and Obuchowski–Rockette methods for receiver operating characteristic (ROC) data. Statistics in Medicine. 2005;24:1579–1607. doi: 10.1002/sim.2024. [DOI] [PubMed] [Google Scholar]
- 26.Bandos AI, Rockette HE, Gur D. Exact bootstrap variances of the area under the ROC curve. Communications in Statistics – Theory & Methods. 2007;36(13):2443–2461. [Google Scholar]