

Abstract
HIV-infected individuals who abuse opiates show a faster progression to AIDS and higher incidence of encephalitis. The HIV-1 proteins Tat and gp120 have been shown to cause neurodegenerative changes either in vitro or when injected or expressed in the CNS, and we have shown that opiate drugs can exacerbate neurotoxic effects in the striatum through direct actions on pharmacologically discrete subpopulations of μ-opioid receptor-expressing astroglia. Opiate co-exposure also significantly enhances release of specific inflammatory mediators by astroglia from the striatum, and we theorize that astroglial reactivity may underlie aspects of HIV neuropathology. To determine whether astroglia from different regions of the central nervous system have distinct, intrinsic responses to HIV-1 proteins and opiates, we used multiplex suspension array analyses to define and compare the inflammatory signature of cytokines released by murine astrocytes grown from cerebral cortex, cerebellum, and spinal cord. Results demonstrate significant regional differences in baseline secretion patterns, and in responses to viral proteins. Of importance for the disease process, astrocytes from all regions have very limited inflammatory response to gp120 protein, as compared to Tat protein, either in the presence or absence of morphine. Overall, the chemokine/cytokine release is higher from spinal cord and cortical astroglia than from cerebellar astroglia, paralleling the relatively low incidence of HIV-related neuropathology in the cerebellum.
Keywords: AIDS, opioid, drug abuse, glial cells, inflammation, HIV encephalitis
Introduction
Although astrocytes throughout the central nervous system (CNS) share many common traits, individual cells can display marked phenotypic diversity, and this can differ among brain regions, during maturation, and in a cell cycle-dependent manner. Heterogeneity has been noted in normal astroglia both in vivo and in vitro, in terms of their morphology 1-3, their production of various proteins, neuropeptides 4-7 and receptors 8-11, and in expression of membrane transporters and channels 12-15. These differences in phenotype are reflected in functional heterogeneity. For example, astroglia exhibit regionally specific electrophysiological characteristics 2, 16-19, and differ in terms of their ability to form gap junctions 6, promote neurogenesis 20, and to respond to immune stimulation 21, 22. It is still debated whether differences among astroglia reflect actual subtypes within the population, or if the heterogeneity is due instead to astroglial plasticity in response to environmental factors. Clearly, astroglia within a particular brain region undergo phenotypic changes over time, both during development and in response to environmental pressures. They also respond to neuronal activity and injury 23, 24. Extrinsic factors that are introduced during disease conditions such as hypoxia/ischemia 25, 26, traumatic injury 27, 28, and others 29, 30, can also induce significant changes in astroglial structure and function. Demonstration of plasticity does not, however, exclude the possibility that bona fide astroglial subtypes do exist.
Many neuropathological conditions in the CNS have effects that are non-uniform. Some regionally specific effects, such as in Parkinson's Disease, can be explained by degenerative processes that target specific neuron sub-types. In other cases it is difficult to understand why individual regions are more or less affected. Such is the case for the neuropathology and dementia that accompany human immunodeficiency virus (HIV) encephalitis, which are described as more frequently involving sub-cortical structures 31-33. In theory, microglia/macrophages infected with HIV distribute throughout the CNS. Thus, both the direct toxic effects of viral proteins, and the secondary effects due to activation of astroglia and microglia/macrophages might be predicted to affect the CNS in a relatively homogeneous fashion. We have focused on the question of glial activation, and whether there are intrinsic differences in the inflammatory factors that glia from different regions produce when exposed to HIV proteins. Previous work from our laboratory established that primary astroglial cultures (<1.0% microglia) derived from the striatum showed a significant upregulation of MCP-1/CCL-2, RANTES/CCL-5, IL-6 and TNFα when treated with HIV-1 Tat 34. This was further exacerbated by exposure to morphine, the bioactive derivative of heroin. In the present paper, a multiplex approach is used to determine whether astrocytes cultured from regions other than striatum release the same group of chemokines/cytokines when they are exposed to Tat and gp-120, either alone or in combination with opiates. We report that untreated astroglia cultured from cortex, cerebellum, and spinal cord, release different amounts and combinations of chemokines/cytokines. Moreover, we show that the regions have intrinsically different responses to HIV protein exposure. None of the regions shows the synergistic effect between Tat and morphine that was previously observed in striatum. These inherent differences may predispose particular regions of the CNS to HIV-associated pathology.
Materials and Methods
All experimental protocols conformed to local Institutional Animal Care and Use Committee (IACUC) and national (PHS) guidelines on the care and ethical use of animals. Experiments were designed to minimize the number of experimental animals used and their discomfort.
Cell Culture
Astrocytes from different regions were assessed to determine their responses to HIV proteins exposure, either alone or in the context of co-exposure to opiates. Astroglia from three CNS regions were cultured from 0-2 day postnatal ICR mice (Charles River Inc., Charles River, MA) using our established techniques 34. Briefly, the entire brain was removed and separated into cerebellum and cerebral cortices. Other regions were removed under a dissecting microscope. Spinal cord tissue was taken from the entire length of the lumbar and thoracic cord. All regions were cultured separately, but using an identical procedure. Tissue was diced into fine pieces in serum-free Dulbecco's Modified Eagle's Medium (DMEM; Invitrogen-Gibco, Carlsbad, CA), then enzymatically dissociated (0.25% trypsin, 10 μg/ml DNAse) and resuspended in medium containing 10% fetal bovine serum (HyClone, Logan, UT). Tissue was triturated sequentially through 5 and 1 ml pipettes, filtered through a nylon filter with 30 μm pores, centrifuged and resuspended in DMEM containing 10% fetal bovine serum, 6 mg % glucose and antibiotics. Cells were grown to 70-80% confluence in 24 well plates before treatment with HIV proteins and opiates. Cerebellar and cortical cultures reached this level of confluence within 1 week, while spinal cord cultures grew more slowly and required 10-14 days. Cultures were routinely 96-98% astrocytes as determined by immunostaining for glial fibrillary acidic protein, with <1% microglia. We chose to establish cultures from neonatal rather than adult tissue for a number of reasons. Astroglia harvested from adult tissue are much fewer in number, less viable in culture, and the cultures contain more contaminating cells, including microglia and endothelial cells, which also secrete chemokine/cytokines that might confuse the results. A different concern relates to proliferation characteristics. In order to attain a “mature” phenotype in culture (including mature astroglial markers and transporters), and irrespective of initial brain region or age, cells must stop proliferating. Astroglia from adult tissues proliferate rather slowly in culture, taking a much longer time to reach confluence than neonatal preparations. Since astroglia tend to lose opioid receptors over time in culture 35, the neonatal preparations have a more reliable population of opioid receptors at the time of confluence.
Viral Protein and Opiate Treatments
Individual wells were treated with Tat1-86 (transactivator of transcription; IIIb strain; ImmunoDiagnostics, Woburn, MA; 100 nM) and/or gp120 (glycoprotein 120; IIIb strain; ImmunoDiagnostics; 500 pM) either alone or in combination with morphine sulphate (NIDA Drug Supply System, Rockville, MD; 500 nM), and/or naloxone (NIDA Drug Supply System; 1.5 μM) for 12 hours. Exposure times longer than 12 hrs increasingly result in autocrine and paracrine secretory effects that complicate interpretation. The Tat protein is produced in the E. coli expression system and purified by ion affinity and reverse phase HPLC to >99% purity, as determined by SDS-PAGE and HPLC. Gp120 is produced in a baculovirus expression system and purified by immune-affinity chromatography to >95% purity as determined by SDS-PAGE. These concentrations of viral proteins have consistently resulted in effects on cytokine output and/or neuron death in our previous publications 34, 36, 37. They are within the range considered to be physiological and used in cell culture studies by numerous other laboratories 38-43. The use of higher concentrations might be criticized for causing non-specific or off-target effects. Immunoneutralized or mutant Tat, and heat-inactivated gp120 have routinely been used to show specificity of the viral proteins 34, 36, 37.
Bio-Plex Assay
In initial studies, simultaneous quantification of 23 cytokines and chemokines in culture supernatants was performed with a mouse cytokine assay system (Bio-Plex; Bio-Rad, Hercules, CA). The analytes included IL-1α, IL-1β, IL-2, IL-3, IL-4, IL-5, IL-6, IL-9, IL-10, IL-12 (p40), IL-12(p70), IL-13, IL-17, Eotaxin, G-CSF, GM-CSF, IFN-γ, KC, MCP-1, MIP1α, MIP-1β, RANTES, and TNF-α. We determined that half of these were not consistently secreted in any treatment group, so subsequent assays were performed on a subset of 12 that showed dynamic responses (Tables 1-3). Calibration curves were prepared using sequential four-fold dilutions of recombinant cytokine standards. Samples were measured and blank values were subtracted from all readings. All assays were carried out directly in the 96-well microplate-format Bio-Plex assays (Bio-Rad) at room temperature and protected from light according to manufacturer's directions. 50 μl of multiplex bead working solution was added to the plate and removed by vacuum filtration. 100 μl of Bio-Plex wash buffer was dispensed to each well and washed twice. Diluted samples or blanks were incubated (30 min, room temperature) with continuous shaking at 300 rpm. Beads were washed, incubated with detection antibody, and visualized with streptavidin-PE. The fluorescence intensity of the beads was measured in a volume of 125 μl of Bio-Plex assay buffer. Data analyses were performed with Bio-Plex Manager software, version 4.0, in samples from n=5 independent cultures from each brain region. Protein levels were measured in all samples using the bicinchoninic acid method (Pierce BCA Protein Assay Kit; Thermo Scientific, Rockford, IL).
Table 1.
F-values for Significant Effects in the 4-way MANOVAa Analysis on the Basal Release of Chemokines/Cytokines.
| Dependent Variable | Brain Region Effect F (2, 141) |
Tat Treatment Effect F (1, 41) |
Brain region × Tat Treatment interaction F (2, 141) |
|---|---|---|---|
| IL-1β | 1.98 | 41.95*** | 1.43 |
| GM-CSF | 18.44*** | 126.00*** | 19.55*** |
| IFN-γ | 15.05*** | 18.56*** | 4.45* |
| TNF- α | 9.31** | 12.53** | 9.13** |
| IL-6 | 16.66*** | 28.94*** | 15.57** |
| KC | 9.15*** | 23.73*** | 9.14** |
| MIP-1α | 42.85*** | 121.06*** | 33.15*** |
| RANTES | 11.10*** | 44.91*** | 10.97** |
| EOTAXIN | 32.23*** | 116.71*** | 26.30*** |
| MIP-1β | 27.11*** | 68.27*** | 24.33*** |
| MCP-1 | 22.00*** | 70.00*** | 20.38** |
| IL-9 | 50.98*** | 137.34*** | 43.56*** |
p ≤ 0.05
p ≤ 0.01
p ≤ 0.001
MANOVA: [3 (brain region) × 2 (±Tat) × 2 (±gp120) × 2 (±morphine)] for the 12 chemokines/cytokines
Table 3.
Post Hoc Analyses for the Brain Region × Tat Interaction Effect on Percent Chemokine/Cytokine Levels* Using Bonferroni as a Correction Factor.
| Cortex | Cerebellum | Spinal Cord | |||||
|---|---|---|---|---|---|---|---|
| Tat | No Tat | Tat | No Tat | Tat | |||
| IL-1β | Cortex | No Tat | |||||
| Tat | X | ||||||
| Cerebellum | No Tat | X | |||||
| Tat | X | ||||||
| Spinal Cord | No Tat | X | |||||
| GM-CSF | Cortex | No Tat | |||||
| Tat | X | ||||||
| Cerebellum | No Tat | X | |||||
| Tat | X | ||||||
| Spinal Cord | No Tat | X | |||||
| IL-9 | Cortex | No Tat | |||||
| Tat | X | ||||||
| Cerebellum | No Tat | X | |||||
| Tat | X | ||||||
| Spinal Cord | No Tat | X | |||||
| IFN-γ | Cortex | No Tat | |||||
| Tat | X | ||||||
| Cerebellum | No Tat | X | |||||
| Tat | X | ||||||
| Spinal Cord | No Tat | X | |||||
| TNF-α | Cortex | No Tat | |||||
| Tat | X | ||||||
| Cerebellum | No Tat | X | |||||
| Tat | X | ||||||
| Spinal Cord | No Tat | X | |||||
| IL-6 | Cortex | No Tat | |||||
| Tat | X | ||||||
| Cerebellum | No Tat | X | |||||
| Tat | X | ||||||
| Spinal Cord | No Tat | X | |||||
| KC | Cortex | No Tat | |||||
| Tat | X | ||||||
| Cerebellum | No Tat | X | |||||
| Tat | X | ||||||
| Spinal Cord | No Tat | X | |||||
| MIP-1α | Cortex | No Tat | |||||
| Tat | X | ||||||
| Cerebellum | No Tat | X | |||||
| Tat | X | ||||||
| Spinal Cord | No Tat | X | |||||
| RANTES | Cortex | No Tat | |||||
| Tat | X | ||||||
| Cerebellum | No Tat | X | |||||
| Tat | X | ||||||
| Spinal Cord | No Tat | X | |||||
| MCP-1 | Cortex | No Tat | |||||
| Tat | X | ||||||
| Cerebellum | No Tat | X | |||||
| Tat | X | ||||||
| Spinal Cord | No Tat | X | |||||
| Eotaxin | Cortex | No Tat | |||||
| Tat | X | ||||||
| Cerebellum | No Tat | X | |||||
| Tat | X | ||||||
| Spinal Cord | No Tat | X | |||||
| MIP-1β | Cortex | No Tat | |||||
| Tat | X | ||||||
| Cerebellum | No Tat | X | |||||
| Tat | X | ||||||
| Spinal Cord | No Tat | X | |||||
A small number of the original cortex (∼10.9%) and spinal cord (4.6%) samples had readings that were above the maximum predictive values for the standard curve. Those samples were diluted 1:1 and re-assessed on an additional array. In samples where chemokine/cytokine levels were below the detectable limit of the standard curve, data were replaced by the lowest value of the standard curve to avoid missing data points for ANOVA analysis. The original and the diluted samples were then all transformed into data indicating percent change values, and percent of control cytokine expression was used as the dependent variable in all analyses. Note that this excludes the first analysis that looked at the basal release (pg/ml) of individual chemokines/cytokines from untreated astrocytes (see Fig. 1). Data were analyzed using multivariate analysis of variance (MANOVA) techniques (SPSS 2008, Version 16.0 for Windows, SPSS Inc.). Analyses were conducted using Tat (2 levels: no, yes), gp120 (2 levels: no, yes), morphine (2 levels: no, yes), and brain region (3 levels: spinal cord, cerebellum, cortex) as between subjects factors. If needed, post hoc test using the Bonferroni correction factor were performed to further determine specific treatment effects. An alpha level of p ≤ 0.05 was considered significant for all statistical tests used. Data are expressed in figures, tables, and text, as mean (±S.E.M.).
Figure 1.

Basal levels (pg/ml) of individual chemokines/cytokines in medium from untreated astroglial cultures from three different brain regions. All values are expressed as the mean ± S.E.M. N=5 independent cultures from each brain region. Statistical analysis (one-way MANOVA) revealed significant differences between the three brain regions for GM-CSF, IFN-γ, RANTES, MCP-1, IL-9, and TNF-α; post hoc Bonferroni's test; *p ≤ 0.05, **p ≤ 0.01, ***p ≤ 0.001.
Intracellular [Ca]2+
A ratiometric intracellular [Ca2+] assay was used to assess the activity of gp120 and morphine preparations. Cortical astroglia were cultured as described above, in 96 well plates. Cultures were treated at 24 hrs prior to assay with 5mM L-leucine methyl ester (final concentration in serum-free medium) for 2 hours to reduce the number of microglia cells. At 80-90% confluence, the cells were loaded with 10μM fura-2/AM (Molecular Probes, Eugene, OR; 45 min, 35°C) in Hank's Balanced Salt Solution with 10 mM HEPES buffer (pH 7.2). After two washes, the cells were incubated for an additional 30 min at 35°C. Ratiometric Ca2+ measurements were made at 340- and 380-nm excitation and 510-520 nm emission wavelengths 44 using a fluorescent microplate NOVOstar reader with an integrated injector (BMG Labtech, Durham, NC). Measurements were made before and after injection of morphine (500 nM, final concentration) or gp120 (500pM, final concentration) into each well. Data are reported as fura-2 ratio 340 / 380-nm and represent the mean (± SEM) of 6 samples per treatment group.
Results
The exploratory analysis approach used in these studies was not intended to analyze levels of individual chemokines/cytokines, but to evaluate the effect of region of origin, viral protein, or morphine on overall chemokine/cytokine accumulation, and also to look for significant interactive effects between these factors. The results identified significant, regionally related differences, both in the basal pattern of chemokine and cytokine secretion by astrocytes, and in the pattern of secretion in response to viral protein exposure. The individual and interactive effects are presented in detail in the sections that follow.
Basal Release of Chemokines/Cytokines
Levels of chemokine/cytokine release from untreated cells varied depending on the region from which astroglia were cultured (Fig. 1). Released chemokine/cytokine values were not normalized to total protein levels since these were not significantly different between the brain regions (cortex: 399.34 μg/ml ± 26.65; cerebellum: 455.16 μg/ml ± 33.19; spinal cord: 342.67 μg/ml ± 56.66). Almost all chemokines/cytokines assayed were detected in the medium of untreated astrocytes from all regions. The exceptions were IL-9 in cortical glia, and IFN-γ and TNFα in cerebellar glia, which were all below the limits of detection by the Bio-Plex assay. However, as can be seen in Fig. 1, the basal levels released into the culture medium varied tremendously. Statistical analysis (one-way MANOVA) showed a significant brain region effect (F(24, 4) = 11.94, p ≤ 0.05), contributed by the following chemokines/cytokines: GM-CSF (F(2, 12) = 5.77, p ≤ 0.05), INF-γ (F(2, 12) = 5.25, p ≤ 0.05), TNF-α (F(2, 12) = 12.65, p ≤ 0.01), RANTES (F(2, 12) = 4.88, p ≤ 0.05), MCP-1 (F(2, 12) = 5.94, p ≤ 0.05), and IL-9 (F(2, 12) = 8.50, p ≤ 0.01). Whereas astroglia from both cerebellum and spinal cord released equivalent levels of the analytes, both released significantly higher levels of most analytes as compared to cortical glia, sometimes by several orders of magnitude (see Fig. 1). Cortical astrocytes had extremely low overall titers of baseline release, ranging between 1.39 pg/ml (TNF-α) and 346.01 pg/ml (eotaxin). Since the conditioned medium was collected over a 12 hr period, the measurements reflect collective secretion as well as any subsequent metabolism, and do not address whether secretion occurred at different rates during that 12 hr period.
Effect of Brain Region on Chemokine/Cytokine Levels
Statistical analysis (4-way MANOVA [3 (cortex, cerebellum, spinal cord) × 2 (±Tat) × 2 (±gp120) × 2 (± morphine)] showed a significant brain region effect [F(24, 262) = 11.08, p ≤ 0.001], with significance for all chemokines/cytokines except for IL-1β (Fig. 2A and Table 1). Post hoc analyses revealed significant higher expression of analytes in the cortex compared to the cerebellum for all cytokines, except for IL1-β, IFN-γ, and KC (Fig. 2A). The expression of IFN-γ, KC, MIP-1α (p ≤ .023), RANTES, and MCP-1 in spinal cord astroglia was significantly higher compared to cerebellar astroglia (Fig. 2A). Further, the expression of IFN-γ, TNF-α, IL-6, MIP-1α, eotaxin, MIP-1β, MCP-1, and IL-9 was significantly higher in cortical astroglia compared to those from spinal cord (Fig. 2A).
Figure 2.
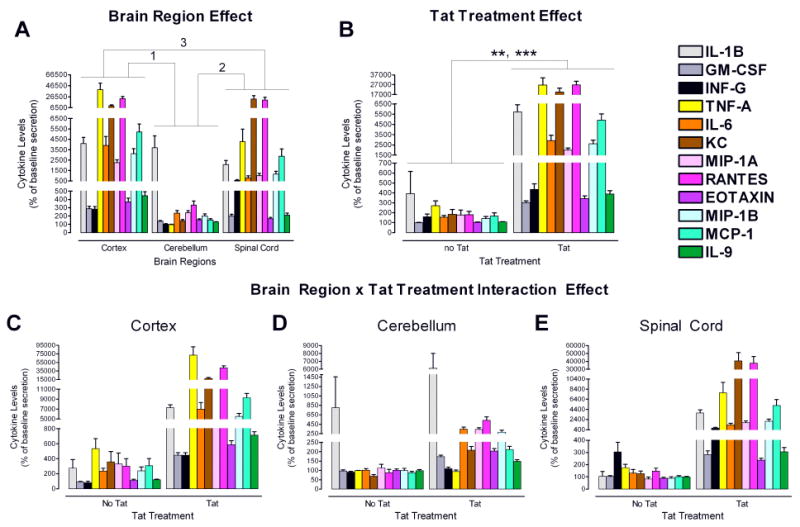
Regional heterogeneity of cytokine secretion: Main effects and Brain Region × Tat interactive effect. N=5 independent cultures from each brain region.
A. Significant brain region effects were observed for all cytokines, except for IL-1β (see Table 1).
1Post hoc analyses revealed significantly higher expression of all analytes in cortical as compared to cerebellar cultures (p < 0.001), except for IL1-β, IFN-γ, and KC.
2Post hoc analyses revealed significantly higher expression in spinal cord as compared to cerebellar cultures for IFN-γ (p ≤ 0.001), KC (p ≤ 0.001), MIP-1α (p ≤ 0.023), RANTES (p ≤ 0.001), and MCP-1 (p ≤ 0.01).
3Post hoc analyses revealed significantly higher expression in cortical as compared to spinal cord cultures for IFN-γ (p ≤ 0.01), TFN-α (p ≤ 0.001), IL-6 (p < .001), MIP-1α (p ≤ 0.001), eotaxin (p ≤ 0.001), MIP-1β (p ≤ 0.001), MCP-1 (p ≤ 0.019), and IL-9 (p ≤ 0.001).
B. Significant Tat treatment effects were observed for all analytes (**TFN-α, p ≤ 0.01, ***all other cytokines, p ≤ 0.001; see Table 1). Tat treatment increased chemokine/cytokine levels compared to control conditions.
C-E. A significant Brain Region × Tat interaction effect revealed significance [F(24, 262) = 8.42, p < .001], except for IFN-γ (see Table 1). Post hoc analyses for the Brain Region × Tat interaction effect, using Bonferroni as a correction factor, are indicated in Table 3. The largest effect of Tat was observed in the cortical cultures. Cerebellar cultures were least affected.
Effects of Tat, gp120 and Morphine on Chemokine/Cytokine Levels
Exposure to HIV-1 Tat had a profound effect on the production of all chemokines/cytokines by astroglia from all brain regions. The 4-way MANOVA showed a significant effect for Tat treatment [F(12, 130) = 27.81, p ≤ 0.001], with significance for all chemokines/cytokines (Fig. 2B, Table 1). In stark contrast to Tat, the MANOVA analysis showed no gp120 effect on chemokine/cytokine release (data not shown). This general dichotomy in response of astroglia to Tat and gp120 was true for all the CNS regions examined (Fig. 3). Results with morphine mirrored those with gp120.
Figure 3.
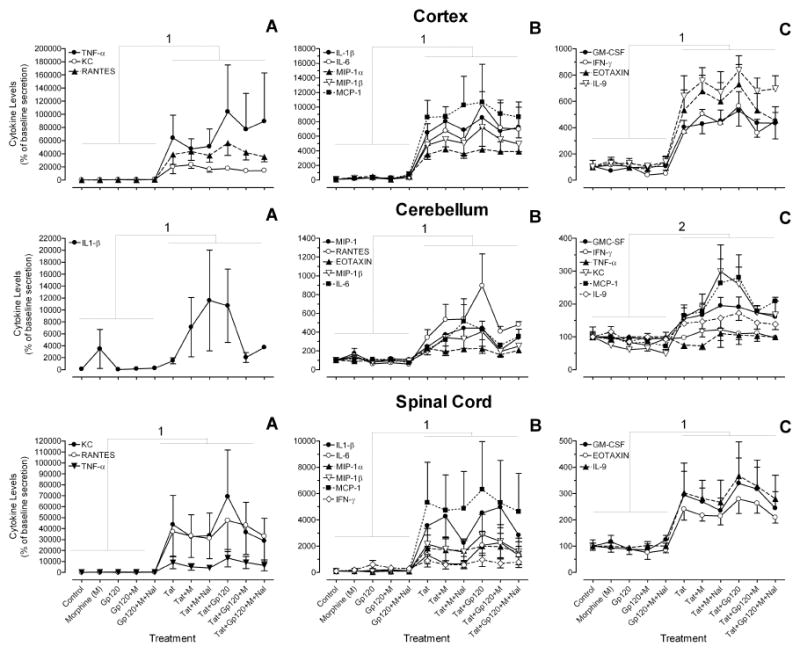
Measurements of viral protein and opiate effects on 12 chemokine/cytokines in cultures from each brain region. To accommodate the wide range of values for individual analytes, three graphs (A-C) represent different levels of expression for each brain region. Statistical analysis (3-way MANOVA) revealed significant Tat effects for each brain region. Table 2 gives the F values and significance level for each chemokine/cytokine. Figure 1 gives the actual values (pg/ml) of individual chemokines/cytokines. M = morphine; Nal = naloxone. Error bars represent S.E.M. N=5 independent cultures from each brain region.
1Significant Tat effect for all 12 chemokines/cytokines (see Table 2 for F values and significance level)
2Significant Tat effect for all chemokines/cytokines, except for IFN-γ and TNF-α (see Table 2 for F values and significance level)
Cortex: Tat significantly increased expression of all 12 analytes. The Tat effect was not altered by concurrent gp120 and/or morphine treatment. Significance values are given in Table 2.
Cerebellum: Tat increased the expression of 10 out of 12 analytes. The exceptions were IFN-γ and TNF-α, whose levels were unchanged. The Tat effect was not altered by concurrent gp120 and/or morphine treatment. Significance values are given in Table 2.
Spinal Cord: Tat significantly increased expression of all 12 analytes. The Tat effect was not altered by concurrent gp120 and/or morphine treatment. Significance values are given in Table 2.
Interactive Effects
Significant interactive effects were seen for the 4-way MANOVA only between brain region and Tat [F(24, 262) = 8.42, p ≤ 0.001], with IL-1β being the only cytokine that did not reveal significance (Fig. 2, C-E and Table 1). Separate 3-way MANOVAs for each brain region [2 (±Tat) × 2 (±gp120) × 2 (±morphine)], indicated that Tat increased production and/or accumulation of almost all chemokines/cytokines from all regions, the only exceptions being TNFα and IFN-γ in the cerebellum (Fig. 3 and Table 2). However, the scale of the increase in chemokine/cytokine levels due to Tat was not the same in all brain regions. Post hoc analyses for the Brain Region × Tat interaction effect, using Bonferroni as a correction factor, are indicated in Table 3. It is revealed that the greatest overall accumulation of chemokines/cytokines was in astroglia from the cortex (see also Fig. 2C-E and Table 3). Astroglia from the spinal cord had a slightly lower response overall, although KC expression was higher in response to Tat for the spinal cord compared to any other condition (Fig. 2C-E; Table 3). Astroglia from the cerebellum had a noticeably lower response to Tat than those from spinal cord and cortex. There were no interactive effects between Tat and morphine, Tat and gp120, gp120 and brain region, or gp120 and morphine.
Table 2.
Degrees of Freedom and F-values for the Tat Effectsa Conducted for Each of the Three Brain Regions: 3-way MANOVAb Analysis on Percent Chemokine/Cytokine Levels.
| Dependent Variable | DF | Cortex | Cerebellum | Spinal Cord |
|---|---|---|---|---|
| IL-1β | (1, 47) | 103.27*** | 5.18* | 29.64*** |
| GM-CSF | (1, 47) | 76.27*** | 40.83*** | 28.37*** |
| IFN-γ | (1, 47) | 65.17*** | 1.85 | 6.26* |
| TNF-α | (1, 47) | 10.24** | 0.36 | 12.38** |
| IL-6 | (1, 47) | 20.35*** | 19.22*** | 13.97** |
| KC | (1, 47) | 42.12*** | 29.41*** | 12.66** |
| MIP-1α | (1, 47) | 207.32*** | 25.48*** | 15.94*** |
| RANTES | (1, 47) | 50.98*** | 33.01*** | 13.03** |
| EOTAXIN | (1, 47) | 57.30*** | 36.29*** | 65.63*** |
| MIP-1β | (1, 47) | 50.52*** | 15.44*** | 15.33*** |
| MCP-1 | (1, 47) | 81.07*** | 31.73*** | 13.93** |
| IL-9 | (1, 47) | 111.06*** | 23.50*** | 21.68*** |
p ≤ 0.05
p ≤ 0.01
p ≤ 0.001; DF = degrees of freedom
No other significant effects were revealed.
MANOVA: [2 (±Tat) × 2 (±Gp120) × 2 (±Morphine)] for the 12 chemokines/cytokines in each brain region.
Assessment of gp120 and Morphine Activity
At the concentrations used in our experiments, both morphine and gp120 are known to cause an increase in intracellular [Ca2+] within neurons and glia 34, 45, 46. In order to rule out the possibility that our results with gp120 and morphine reflected a lack of reagent activity, we assessed the ability of both preparations to increase intracellular [Ca2+], using a standard ratiometric fura-2 AM assay. As shown in Fig. 4, addition of either morphine (500 nM, final concentration) or gp120 (500 pM, final concentration) to primary cortical astroglia that are depleted of microglial cells caused a significant increase in the 340/380 ratio, indicative of [Ca2+] elevation within the cells. The ratio was increased more quickly by morphine, although the two treatments eventually resulted in similar fura-2 ratios over a 5 min period.
Figure 4.
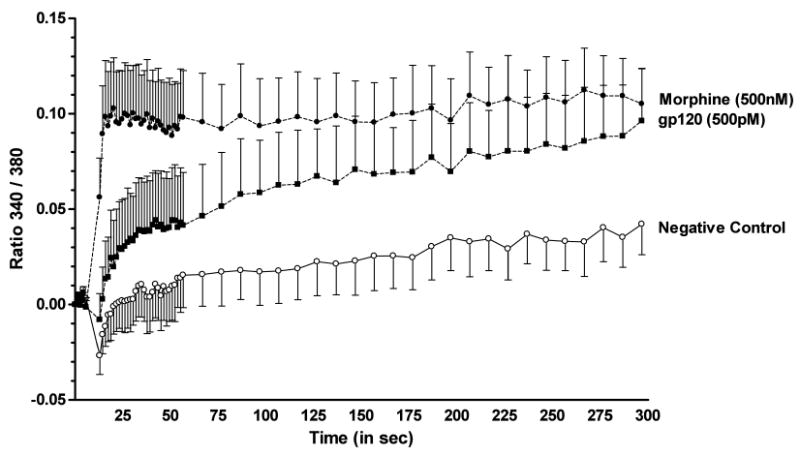
Analysis of [Ca2+]i activation in astrocytes after exposure to morphine or gp120. Cultures of enriched primary astrocytes derived from cerebral cortex were grown to 80-90% confluence, then loaded with 10μM fura-2/AM. Ratiometric Ca2+ measurements were made before (7.3 sec, 5 timepoints) and after (∼5 min) injection of morphine (500 nM, final concentration; filled circles) or gp120 (500 pM, final concentration; filled squares). Results are reported as the mean 340/380 ratio, and represent N = 6 samples per treatment group ± S.E.M. A two-way mixed ANOVA [treatment and time] showed that either morphine or gp120 significantly increased (p ≤ 0.001 and p ≤ 0.05, respectively) the 340/380 ratio compared to cells treated with vehicle (open circles). Morphine effects were noted immediately after exposure and remained stable over the 5 min recording period, while gp120 effects reached significance after 2 min.
Discussion
An exploratory analysis approach was used to identify chemokines/cytokines released in primary astrocyte cultures derived from different brain regions after exposure to Tat and/or gp120, either alone or in combination with opiates. In contrast to earlier proteomic studies in astroglia expressing an HIV-1 Tat construct 47, 48, our studies were designed to explore the effects of Tat available in the extracellular environment, as would occur after release from infected microglia in situ. We examined levels of released chemokine/cytokines since our principle interest is in the potential modification of intercellular signaling by HIV proteins and opiates. There was a basal release of chemokines/cytokines by untreated cells, which makes it possible to extrapolate the percent levels of change in chemokine/cytokine release in response to HIV proteins and morphine. Our studies were designed to reveal overall trends for chemokine/cytokine release and accumulation under our conditions. Further studies would be necessary to test more specific hypotheses concerning the responses of individual analytes in any of the treatment groups.
Our data show that astroglia derived from several different CNS regions have significant differences in basal chemokines/cytokine release. Neonatal tissue was used as a source because cells have higher viability and proliferation rates, and cultures are much purer than when adult-derived astroglia are used. All tissues were subjected to the same preparatory manipulations, and cultures received the same care. Cultures were examined at the same confluence, and protein measurements showed that protein content did not differ significantly between cultures. All of this suggests that the differences observed have more to do with the intrinsic capabilities and responses of cells from the different regions than with variables of the culture process. Basal accumulation overall during the 12 hr period was significantly higher in cultures from both the spinal cord and cerebellum than the cortex, where eotaxin had the highest titer of any analyte examined (346.01 pg/ml). For certain analytes, the difference was profound. For example, IL-1β was virtually undetectable in cortical cultures, yet averaged 13,000 pg/ml in untreated cerebellar cultures and 50,000 pg/ml in untreated spinal cord cultures. The astroglia here were derived from early neonatal brains in which glia are still developing, reinforcing the idea that astrocytes generated from different dorso-ventral domains along the mouse central nervous system may have very distinct characteristics 49.
Exposure to HIV-1 proteins Tat and gp120 cause regionally specific changes in the accumulation of chemokines/cytokines. Astroglia had a much higher response to Tat than to gp120 exposure. This was apparent statistically, where Tat effects, but not gp120 effects, were observed on chemokine/cytokine output as compared to untreated astroglia (Figs. 2 and 3; Tables 1 and 2). Since our experiments were designed as an exploratory analysis to look for general trends across several brain regions and treatment groups, studies focused on individual chemokines/cytokines might reveal a significant gp120 effect that would be overlooked in this type of analysis. However, the data clearly indicate that astroglia from several regions are fundamentally more responsive to Tat exposure than to gp120 exposure. Further analysis also showed a region-specific response to Tat exposure. There were greater increases in chemokine/cytokine levels in cortex and spinal cord cultures, as compared with those from cerebellum (Fig. 2 C-E). Might the different responses to Tat versus gp120, and the regional differences in Tat response reflect regional differences in astroglial maturation? This seems unlikely, since cerebellum is the latest of the three regions to mature in vivo, yet similar cerebellar cultures have dynamic [Ca2+]i, MAPK, and TNFα secretory responses to gp120 or Tat in other studies 50-52. Astroglia do not express the CD4-receptor, the major binding partner for gp120-mediated viral entry, but it is not clear that CD4 is involved in chemokine/cytokine responses. The strain of gp120 used in this study (IIIb) preferentially uses the CXCR4 co-receptor for viral entry. Nor is it clear that CXCR4 or the CCR5 co-receptor used by other HIV strains are critical for regulation of chemokine/cytokine release, although subsets of astrocytes throughout the brain and in culture do express both co-receptors 45, 53-57. The striking difference in astrocyte responses to Tat may reflect interaction with and/or internalization by a number of different receptors that are expressed on astroglia, including those for VEGF, NMDA, αvβ5 integrin, as well as the low-density lipoprotein receptor-related protein and CXCR4 58-62. Portions of the Tat protein are also able to directly penetrate cell membranes, and have been used to facilitate transmembrane delivery of larger molecules into cells.
Our earlier studies with astroglia from a different region, the striatum, showed that concurrent morphine exposure exacerbated the effect of HIV-1 Tat1-72 to release MCP-1, MCP-5, RANTES, TNFα and IL-6 34, 37, 63. It was somewhat surprising that morphine co-exposure in the present study did not have a similar effect. Since the morphine concentration used here should saturate μ-opioid receptors (MOPr), and since the preparation was active, as judged by its ability to elevate intracellular [Ca2+] (Fig. 4), the results indicate a regional specificity in morphine-Tat interactions. Astroglia display a tremendous phenotypic and pharmacologic diversity that is perhaps rivaled only by neurons, including heterogeneity in μ, δ, and/or κ-opioid receptor expression among individual cells. However, our labs and others have shown that opiate receptors are expressed on neonatal astroglia throughout the CNS 64, 65, and that MOPr mRNA and/or immunoreactivity is detected on subpopulations of astrocytes cultured from the regions that we examined 66-69. Thus, the lack of morphine-Tat synergy on chemokine/cytokine release cannot be explained by a regional absence of MOPr. One reason for working with neonatal preparations, which reach confluence within two weeks, was to assure the presence of an adequate population of opioid receptors, which are known to be down-regulated on astroglia with time in culture 35. The overall density of MOPr is relatively high in the striatum, perhaps contributing to greater morphine sensitivity in striatal glia. Alternatively, MOPr-effector coupling, or convergent opioid-HIV pro-inflammatory signaling pathways, may differ among astrocytes from different brain areas. For example, the proportion of astroglia that display MOPr can differ significantly from the percentage that show increases in [Ca2+]i in response to morphine or MOPr selective agonists 66. This suggests the possibility of heterogeneous expression in Gαq G-protein receptor coupling subunit availability/composition and/or other differences in MOPr receptor-effector coupling among astrocytes from differing brain regions. The differences between our previous findings in the striatum, and the brain regions examined in the present report, are particularly interesting in light of the fact that the striatum is a region especially vulnerable to the combined pathological effects of HIV and opiates.
Both the Tat and gp120 concentrations used in these studies have been used in previous work by our lab and others 34, 36-43, and are in keeping with levels thought to reflect the higher end of concentrations of viral proteins within the extracellular compartment. However, those are difficult parameters to measure with certainty, and may not be the same as levels measured in patient sera. The geometry and volume of extracellular space is highly dynamic. Following excitotoxic injury, trauma, and/or gliosis in the CNS, the volume and tortuosity of the extracellular space can decrease up to 10-fold, effectively concentrating substances within this compartment 70, 71. Changes in volume also alter ion homeostasis, and may affect the kinetics of receptor interactions and degradative reactions. Additionally, it has been proposed that a brief, “hit and run” exposure to Tat may be all that is necessary to set off toxic cascades or induce cytokine production within target cells 40, 72. If this is true, then measuring the physiologically relevant level of Tat in the CNS may be even more improbable.
Although our study is the first to describe regional heterogeneity in the secretory response of astroglia to HIV proteins, regionally specific responses of astroglia to other inflammatory stimuli have been observed 21, 22, 73. For example, cortical astroglia, as compared to midbrain-derived astroglia, release more IL-2 and IL-1β in response to lipopolysaccharide 22, and IL-6 invokes different secretory responses from hippocampal, cortical, and cerebellar astroglia 73. Astroglia in the brain have also been shown to respond in a regionally specific manner to inflammatory diseases and disease models, including multiple sclerosis and EAE 30, 74, ischemia 26, 75, and epilepsy 76. It is intriguing that higher levels of chemokine/cytokines are induced by Tat in astroglia from regions which are typically reported to be more prone to HIV-associated neuropathology in HIV patients. Although HIV encephalitis may occur in any part of the CNS, the basal ganglia are particularly targeted, and spinal cord disease is one of the most disabling complications of neuroAIDS 77-79. The neocortex can also be severely affected 80. Much less pathology is typically reported in cerebellar regions 77. This correlation leads us to speculate that higher titers of Tat-induced chemokine/cytokines released by astroglia in the spinal cord, striatum and cortex may lead to greater inflammation and damage in those regions. Our observations for HIV proteins thus represent a specific, disease-relevant example of heterogeneity in astrocyte function that is based on brain region. This functional variation may reflect underlying differences in astroglial responses to HIV infection in the intact brain.
Acknowledgments
We gratefully acknowledge NIDA P01 DA19398 and K02 DA27374 as sources of funding for these studies.
Footnotes
Conflict of Interest Statement: All of the authors declare that they have no conflicting financial or commercial interests in the work presented here.
References
- 1.Ye H, Hernandez MR. Heterogeneity of astrocytes in human optic nerve head. J Comp Neurol. 1995;362(4):441–52. doi: 10.1002/cne.903620402. [DOI] [PubMed] [Google Scholar]
- 2.Israel JM, Schipke CG, Ohlemeyer C, Theodosis DT, Kettenmann H. GABAA receptor-expressing astrocytes in the supraoptic nucleus lack glutamate uptake and receptor currents. Glia. 2003;44(2):102–10. doi: 10.1002/glia.10272. [DOI] [PubMed] [Google Scholar]
- 3.Won CL, Oh YS. cAMP-induced stellation in primary astrocyte cultures with regional heterogeneity. Brain Res. 2000;887(2):250–8. doi: 10.1016/s0006-8993(00)02922-x. [DOI] [PubMed] [Google Scholar]
- 4.Lee Y, Su M, Messing A, Brenner M. Astrocyte heterogeneity revealed by expression of a GFAP-LacZ transgene. Glia. 2006;53(7):677–87. doi: 10.1002/glia.20320. [DOI] [PubMed] [Google Scholar]
- 5.Shinoda H, Marini AM, Cosi C, Schwartz JP. Brain region and gene specificity of neuropeptide gene expression in cultured astrocytes. Science. 1989;245:415–417. doi: 10.1126/science.2569236. [DOI] [PubMed] [Google Scholar]
- 6.Blomstrand F, Aberg ND, Eriksson PS, Hansson E, Ronnback L. Extent of intercellular calcium wave propagation is related to gap junction permeability and level of connexin-43 expression in astrocytes in primary cultures from four brain regions. Neuroscience. 1999;92(1):255–65. doi: 10.1016/s0306-4522(98)00738-6. [DOI] [PubMed] [Google Scholar]
- 7.Sharif A, Renault F, Beuvon F, Castellanos R, Canton B, Barbeito L, Junier MP, Chneiweiss H. The expression of PEA-15 (phosphoprotein enriched in astrocytes of 15 kDa) defines subpopulations of astrocytes and neurons throughout the adult mouse brain. Neuroscience. 2004;126(2):263–75. doi: 10.1016/j.neuroscience.2004.02.039. [DOI] [PubMed] [Google Scholar]
- 8.Venance L, Premont J, Glowinski J, Giaume C. Gap junctional communication and pharmacological heterogeneity in astrocytes cultured from the rat striatum. J Physiol. 1998;510(Pt 2):429–40. doi: 10.1111/j.1469-7793.1998.429bk.x. [DOI] [PMC free article] [PubMed] [Google Scholar]
- 9.Porter JT, McCarthy KD. Astrocytic neurotransmitter receptors in situ and in vivo. Prog Neurobiol. 1997;51(4):439–55. doi: 10.1016/s0301-0082(96)00068-8. [DOI] [PubMed] [Google Scholar]
- 10.McCarthy KD, Salm AK. Pharmacologically-distinct subsets of astroglia can be identified by their calcium response to neuroligands. Neuroscience. 1991;41(2-3):325–33. doi: 10.1016/0306-4522(91)90330-q. [DOI] [PubMed] [Google Scholar]
- 11.Sharif A, Duhem-Tonnelle V, Allet C, Baroncini M, Loyens A, Kerr-Conte J, Collier F, Blond S, Ojeda SR, Junier MP, Prevot V. Differential erbB signaling in astrocytes from the cerebral cortex and the hypothalamus of the human brain. Glia. 2009;57(4):362–79. doi: 10.1002/glia.20762. [DOI] [PubMed] [Google Scholar]
- 12.Peng L, Arystarkhova E, Sweadner KJ. Plasticity of Na,K-ATPase isoform expression in cultures of flat astrocytes: Species differences in gene expression. Glia. 1998;24:257–271. doi: 10.1002/(sici)1098-1136(199811)24:3<257::aid-glia1>3.0.co;2-#. [DOI] [PubMed] [Google Scholar]
- 13.Olsen ML, Campbell SL, Sontheimer H. Differential distribution of Kir4.1 in spinal cord astrocytes suggests regional differences in K+ homeostasis. J Neurophysiol. 2007;98(2):786–93. doi: 10.1152/jn.00340.2007. [DOI] [PMC free article] [PubMed] [Google Scholar]
- 14.Reye P, Sullivan R, Scott H, Pow DV. Distribution of two splice variants of the glutamate transporter GLT-1 in rat brain and pituitary. Glia. 2002;38(2):246–55. doi: 10.1002/glia.10059. [DOI] [PubMed] [Google Scholar]
- 15.Williams SM, Sullivan RK, Scott HL, Finkelstein DI, Colditz PB, Lingwood BE, Dodd PR, Pow DV. Glial glutamate transporter expression patterns in brains from multiple mammalian species. Glia. 2005;49(4):520–41. doi: 10.1002/glia.20139. [DOI] [PubMed] [Google Scholar]
- 16.Matthias K, Kirchhoff F, Seifert G, Huttmann K, Matyash M, Kettenmann H, Steinhauser C. Segregated expression of AMPA-type glutamate receptors and glutamate transporters defines distinct astrocyte populations in the mouse hippocampus. J Neurosci. 2003;23(5):1750–8. doi: 10.1523/JNEUROSCI.23-05-01750.2003. [DOI] [PMC free article] [PubMed] [Google Scholar]
- 17.Poopalasundaram S, Knott C, Shamotienko OG, Foran PG, Dolly JO, Ghiani CA, Gallo V, Wilkin GP. Glial heterogeneity in expression of the inwardly rectifying K(+) channel, Kir4.1, in adult rat CNS. Glia. 2000;30(4):362–72. doi: 10.1002/(sici)1098-1136(200006)30:4<362::aid-glia50>3.0.co;2-4. [DOI] [PubMed] [Google Scholar]
- 18.Walz W. Controversy surrounding the existence of discrete functional classes of astrocytes in adult gray matter. Glia. 2000;31(2):95–103. doi: 10.1002/1098-1136(200008)31:2<95::aid-glia10>3.0.co;2-6. [DOI] [PubMed] [Google Scholar]
- 19.McKhann GM, 2nd, D'Ambrosio R, Janigro D. Heterogeneity of astrocyte resting membrane potentials and intercellular coupling revealed by whole-cell and gramicidin-perforated patch recordings from cultured neocortical and hippocampal slice astrocytes. J Neurosci. 1997;17(18):6850–63. doi: 10.1523/JNEUROSCI.17-18-06850.1997. [DOI] [PMC free article] [PubMed] [Google Scholar]
- 20.Barkho BZ, Song H, Aimone JB, Smrt RD, Kuwabara T, Nakashima K, Gage FH, Zhao X. Identification of astrocyte-expressed factors that modulate neural stem/progenitor cell differentiation. Stem Cells Dev. 2006;15(3):407–21. doi: 10.1089/scd.2006.15.407. [DOI] [PMC free article] [PubMed] [Google Scholar]
- 21.Morga E, Faber C, Heuschling P. Cultured astrocytes express regional heterogeneity of the immunoreactive phenotype under basal conditions and after gamma-IFN induction. J Neuroimmunol. 1998;87(1-2):179–84. doi: 10.1016/s0165-5728(98)00099-x. [DOI] [PubMed] [Google Scholar]
- 22.Kipp M, Norkute A, Johann S, Lorenz L, Braun A, Hieble A, Gingele S, Pott F, Richter J, Beyer C. Brain-region-specific astroglial responses in vitro after LPS exposure. J Mol Neurosci. 2008;35(2):235–43. doi: 10.1007/s12031-008-9057-7. [DOI] [PubMed] [Google Scholar]
- 23.Shao Y, McCarthy KD. Plasticity of astrocytes. Glia. 1994;11(2):147–55. doi: 10.1002/glia.440110209. [DOI] [PubMed] [Google Scholar]
- 24.Gegelashvili G, Danbolt NC, Schousboe A. Neuronal soluble factors differentially regulate the expression of the GLT1 and GLAST glutamate transporters in cultured astroglia. Journal of Neurochemistry. 1997;69:2612–2615. doi: 10.1046/j.1471-4159.1997.69062612.x. [DOI] [PubMed] [Google Scholar]
- 25.Takano T, Oberheim N, Cotrina ML, Nedergaard M. Astrocytes and ischemic injury. Stroke. 2009;40(3 Suppl):S8–12. doi: 10.1161/STROKEAHA.108.533166. [DOI] [PMC free article] [PubMed] [Google Scholar]
- 26.Panickar KS, Norenberg MD. Astrocytes in cerebral ischemic injury: morphological and general considerations. Glia. 2005;50(4):287–98. doi: 10.1002/glia.20181. [DOI] [PubMed] [Google Scholar]
- 27.White RE, Jakeman LB. Don't fence me in: harnessing the beneficial roles of astrocytes for spinal cord repair. Restor Neurol Neurosci. 2008;26(2-3):197–214. [PMC free article] [PubMed] [Google Scholar]
- 28.Laird MD, Vender JR, Dhandapani KM. Opposing roles for reactive astrocytes following traumatic brain injury. Neurosignals. 2008;16(2-3):154–64. doi: 10.1159/000111560. [DOI] [PubMed] [Google Scholar]
- 29.Farfara D, Lifshitz V, Frenkel D. Neuroprotective and neurotoxic properties of glial cells in the pathogenesis of Alzheimer's disease. J Cell Mol Med. 2008;12(3):762–80. doi: 10.1111/j.1582-4934.2008.00314.x. [DOI] [PMC free article] [PubMed] [Google Scholar]
- 30.Nair A, Frederick TJ, Miller SD. Astrocytes in multiple sclerosis: a product of their environment. Cell Mol Life Sci. 2008;65(17):2702–20. doi: 10.1007/s00018-008-8059-5. [DOI] [PMC free article] [PubMed] [Google Scholar]
- 31.Minagar A, Shapshak P, Fujimura R, Ownby R, Heyes M, Eisdorfer C. The role of macrophage/microglia and astrocytes in the pathogenesis of three neurologic disorders: HIV-associated dementia, Alzheimer disease, and multiple sclerosis. J Neurol Sci. 2002;202(1-2):13–23. doi: 10.1016/s0022-510x(02)00207-1. [DOI] [PubMed] [Google Scholar]
- 32.Ances BM, Ellis RJ. Dementia and neurocognitive disorders due to HIV-1 infection. Semin Neurol. 2007;27(1):86–92. doi: 10.1055/s-2006-956759. [DOI] [PubMed] [Google Scholar]
- 33.Kaul M, Zheng J, Okamoto S, Gendelman HE, Lipton SA. HIV-1 infection and AIDS: consequences for the central nervous system. Cell Death Differ. 2005;12 1:878–92. doi: 10.1038/sj.cdd.4401623. [DOI] [PubMed] [Google Scholar]
- 34.El-Hage N, Gurwell JA, Singh IN, Knapp PE, Nath A, Hauser KF. Synergistic increases in intracellular Ca2+, and the release of MCP-1, RANTES, and IL-6 by astrocytes treated with opiates and HIV-1 Tat. Glia. 2005;50(2):91–106. doi: 10.1002/glia.20148. [DOI] [PMC free article] [PubMed] [Google Scholar]
- 35.Gurwell JA, Duncan MJ, Maderspach K, Steine-Martin A, Elde RP, Hauser KF. κ-opioid receptor expression defines a phenotypically distinct subpopulation of astroglia: relationship to Ca2+ mobilization, development, and the antiproliferative effect of opioids. Brain Research. 1996;737:175–187. doi: 10.1016/0006-8993(96)00728-7. [DOI] [PMC free article] [PubMed] [Google Scholar]
- 36.Singh IN, Goody RJ, Dean C, Ahmad NM, Lutz SE, Knapp PE, Nath A, Hauser KF. Apoptotic death of striatal neurons induced by HIV-1 Tat and gp120: differential involvement of caspase-3 and endonuclease G. Journal of Neurovirology. 2004;10(4):141–151. doi: 10.1080/13550280490441103. [DOI] [PMC free article] [PubMed] [Google Scholar]
- 37.El-Hage N, Wu G, Wang J, Ambati J, Knapp PE, Reed J, Bruce-Keller A, Hauser KF. HIV Tat1-72 and opiate-induced changes in astrocytes promote chemotaxis of microglia through the expression of MCP-1 and alternative chemokines. Glia. 2006;53:132–146. doi: 10.1002/glia.20262. [DOI] [PMC free article] [PubMed] [Google Scholar]
- 38.Maggirwar SB, Tong N, Ramirez S, Gelbard HA, Dewhurst S. HIV-1 Tat-mediated activation of glycogen synthase kinase-3beta contributes to Tat-mediated neurotoxicity. Journal of Neurochemistry. 1999;73(2):578–586. doi: 10.1046/j.1471-4159.1999.0730578.x. [DOI] [PubMed] [Google Scholar]
- 39.Kruman II, Nath A, Mattson MP. HIV-1 protein Tat induces apoptosis of hippocampal neurons by a mechanism involving caspase activation, calcium overload, and oxidative stress. Experimental Neurology. 1998;154(2):276–288. doi: 10.1006/exnr.1998.6958. [DOI] [PubMed] [Google Scholar]
- 40.Nath A, Conant K, Chen P, Scott C, Major EO. Transient exposure to HIV-1 Tat protein results in cytokine production in macrophages and astrocytes : A hit and run phenomenon. Journal of Biological Chemistry. 1999;274:17098–102. doi: 10.1074/jbc.274.24.17098. [DOI] [PubMed] [Google Scholar]
- 41.Dou H, Birusingh K, Faraci J, Gorantla S, Poluektova LY, Maggirwar SB, Dewhurst S, Gelbard HA, Gendelman HE. Neuroprotective activities of sodium valproate in a murine model of human immunodeficiency virus-1 encephalitis. Journal of Neuroscience. 2003;23(27):9162–9170. doi: 10.1523/JNEUROSCI.23-27-09162.2003. [DOI] [PMC free article] [PubMed] [Google Scholar]
- 42.Chen P, Mayne M, Power C, Nath A. The Tat protein of HIV-1 induces tumor necrosis factor-alpha production. Implications for HIV-1-associated neurological diseases. J Biol Chem. 1997;272(36):22385–8. doi: 10.1074/jbc.272.36.22385. [DOI] [PubMed] [Google Scholar]
- 43.Kong LY, Wilson BC, McMillian MK, Bing G, Hudson PM, Hong JS. The effects of the HIV-1 envelope protein gp120 on the production of nitric oxide and proinflammatory cytokines in mixed glial cell cultures. Cell Immunol. 1996;172(1):77–83. doi: 10.1006/cimm.1996.0217. [DOI] [PubMed] [Google Scholar]
- 44.Grynkiewicz G, Poenie M, Tsien RY. A new generation of Ca2+ indicators with greatly improved fluorescence properties. J Biol Chem. 1985;260(6):3440–50. [PubMed] [Google Scholar]
- 45.Koller H, Schaal H, Rosenbaum C, Czardybon M, Von Giesen HJ, Muller HW, Arendt G. Functional CXCR4 receptor development parallels sensitivity to HIV-1 gp120 in cultured rat astroglial cells but not in cultured rat cortical neurons. Journal of Neurovirology. 2002;8:411–419. doi: 10.1080/13550280260422712. [DOI] [PubMed] [Google Scholar]
- 46.Haughey NJ, Mattson MP. Calcium dysregulation and neuronal apoptosis by the HIV-1 proteins Tat and gp120. Journal of Acquired Immune Deficiency Syndrome. 2002;31 2:S55–61. doi: 10.1097/00126334-200210012-00005. [DOI] [PubMed] [Google Scholar]
- 47.Pocernich CB, Boyd-Kimball D, Poon HF, Thongboonkerd V, Lynn BC, Klein JB, Calebrese V, Nath A, Butterfield DA. Proteomics analysis of human astrocytes expressing the HIV protein Tat. Brain Res Mol Brain Res. 2005;133(2):307–16. doi: 10.1016/j.molbrainres.2004.10.023. [DOI] [PubMed] [Google Scholar]
- 48.Pocernich CB, Poon HF, Boyd-Kimball D, Lynn BC, Nath A, Klein JB, Butterfield DA. Proteomic analysis of oxidatively modified proteins induced by the mitochondrial toxin 3-nitropropionic acid in human astrocytes expressing the HIV protein tat. Brain Res Mol Brain Res. 2005;133(2):299–306. doi: 10.1016/j.molbrainres.2004.10.024. [DOI] [PubMed] [Google Scholar]
- 49.Ogawa Y, Takebayashi H, Takahashi M, Osumi N, Iwasaki Y, Ikenaka K. Gliogenic radial glial cells show heterogeneity in the developing mouse spinal cord. Dev Neurosci. 2005;27(6):364–77. doi: 10.1159/000088452. [DOI] [PubMed] [Google Scholar]
- 50.Codazzi F, Menegon A, Zacchetti D, Ciardo A, Grohovaz F, Meldolesi J. HIV-1 gp120 glycoprotein induces [Ca2+]i responses not only in type-2 but also type-1 astrocytes and oligodendrocytes of the rat cerebellum. European Journal of Neuroscience. 1995;7(6):1333–1341. doi: 10.1111/j.1460-9568.1995.tb01124.x. [DOI] [PubMed] [Google Scholar]
- 51.Buriani A, Petrelli L, Facci L, Romano PG, Dal Tosso R, Leon A, Skaper SD. Human immunodeficiency virus type 1 envelope glycoprotein gp120 induces tumor necrosis factor-alpha in astrocytes. J NeuroAIDS. 1999;2(2):1–13. doi: 10.1300/J128v02n02_01. [DOI] [PubMed] [Google Scholar]
- 52.Menegon A, Leoni C, Benfenati F, Valtorta F. Tat protein from HIV-1 activates MAP kinase in granular neurons and glial cells from rat cerebellum. Biochemical and Biophysical Research Communications. 1997;238:800–805. doi: 10.1006/bbrc.1997.7393. [DOI] [PubMed] [Google Scholar]
- 53.Rezaie P, Trillo-Pazos G, Everall IP, Male DK. Expression of beta-chemokines and chemokine receptors in human fetal astrocyte and microglial co-cultures: potential role of chemokines in the developing CNS. Glia. 2002;37(1):64–75. doi: 10.1002/glia.1128. [DOI] [PubMed] [Google Scholar]
- 54.Bezzi P, Domercq M, Brambilla L, Galli R, Schols D, De Clercq E, Vescovi A, Bagetta G, Kollias G, Meldolesi J, Volterra A. CXCR4-activated astrocyte glutamate release via TNFalpha: amplification by microglia triggers neurotoxicity. Nature Neuroscience. 2001;4:702–710. doi: 10.1038/89490. [DOI] [PubMed] [Google Scholar]
- 55.Dorf ME, Berman MA, Tanabe S, Heesen M, Luo Y. Astrocytes express functional chemokine receptors. J Neuroimmunol. 2000;111(1-2):109–21. doi: 10.1016/s0165-5728(00)00371-4. [DOI] [PubMed] [Google Scholar]
- 56.Boutet A, Salim H, Taoufik Y, Lledo PM, Vincent JD, Delfraissy JF, Tardieu M. Isolated human astrocytes are not susceptible to infection by M- and T-tropic HIV-1 strains despite functional expression of the chemokine receptors CCR5 and CXCR4. Glia. 2001;34(3):165–77. [PubMed] [Google Scholar]
- 57.Klein RS, Williams KC, Alvarez-Hernandez X, Westmoreland S, Force T, Lackner AA, Luster AD. Chemokine receptor expression and signaling in macaque and human fetal neurons and astrocytes: implications for the neuropathogenesis of AIDS. J Immunol. 1999;163(3):1636–46. [PubMed] [Google Scholar]
- 58.Ghezzi S, Noonan DM, Aluigi MG, Vallanti G, Cota M, Benelli R, Morini M, Reeves JD, Vicenzi E, Poli G, Albini A. Inhibition of CXCR4-dependent HIV-1 infection by extracellular HIV-1 Tat. Biochem Biophys Res Commun. 2000;270(3):992–6. doi: 10.1006/bbrc.2000.2523. [DOI] [PubMed] [Google Scholar]
- 59.Liu Y, Jones M, Hingtgen CM, Bu G, Laribee N, Tanzi RE, Moir RD, Nath A, He JJ. Uptake of HIV-1 tat protein mediated by low-density lipoprotein receptor-related protein disrupts the neuronal metabolic balance of the receptor ligands. Nat Med. 2000;6(12):1380–7. doi: 10.1038/82199. [DOI] [PubMed] [Google Scholar]
- 60.King JE, Eugenin EA, Buckner CM, Berman JW. HIV tat and neurotoxicity. Microbes Infect. 2006;8(5):1347–57. doi: 10.1016/j.micinf.2005.11.014. [DOI] [PubMed] [Google Scholar]
- 61.Vogel BE, Lee SJ, Hildebrand A, Craig W, Pierschbacher MD, Wong-Staal F, Ruoslahti E. A novel integrin specificity exemplified by binding of the alpha v beta 5 integrin to the basic domain of the HIV Tat protein and vitronectin. J Cell Biol. 1993;121(2):461–8. doi: 10.1083/jcb.121.2.461. [DOI] [PMC free article] [PubMed] [Google Scholar]
- 62.Li W, Huang Y, Reid R, Steiner J, Malpica-Llanos T, Darden TA, Shankar SK, Mahadevan A, Satishchandra P, Nath A. NMDA receptor activation by HIV-Tat protein is clade dependent. J Neurosci. 2008;28(47):12190–8. doi: 10.1523/JNEUROSCI.3019-08.2008. [DOI] [PMC free article] [PubMed] [Google Scholar]
- 63.El-Hage N, Bruce-Keller AJ, Yakovleva T, Bazov I, Bakalkin G, Knapp PE, Hauser KF. Morphine exacerbates HIV-1 Tat-induced cytokine production in astrocytes through convergent effects on [Ca(2+)](i), NF-kappaB trafficking and transcription. PLoS ONE. 2008;3(12):e4093. doi: 10.1371/journal.pone.0004093. [DOI] [PMC free article] [PubMed] [Google Scholar]
- 64.Stiene-Martin A, Knapp PE, Martin K, Gurwell JA, Ryan S, Thornton SR, Smith FL, Hauser KF. Opioid system diversity in developing neurons, astroglia, and oligodendroglia in the subventricular zone and striatum: impact on gliogenesis in vivo. Glia. 2001;36(1):78–88. [PMC free article] [PubMed] [Google Scholar]
- 65.Ray SB, Wadhwa S. Mu opioid receptors in developing human spinal cord. J Anat. 1999;195(Pt 1):11–8. doi: 10.1046/j.1469-7580.1999.19510011.x. [DOI] [PMC free article] [PubMed] [Google Scholar]
- 66.Stiene-Martin A, Zhou R, Hauser KF. Regional, developmental, and cell cycle-dependent differences in m, d and k-opioid receptor expression among cultured mouse astrocytes. Glia. 1998;22:249–259. [PMC free article] [PubMed] [Google Scholar]
- 67.Turchan-Cholewo J, Dimayuga FO, Ding Q, Keller JN, Hauser KF, Knapp PE, Bruce-Keller AJ. Cell-specific actions of HIV-Tat and morphine on opioid receptor expression in glia. J Neurosci Res. 2008;86(9):2100–10. doi: 10.1002/jnr.21653. [DOI] [PMC free article] [PubMed] [Google Scholar]
- 68.Eriksson PS, Hansson E, Ronnback L. Mu and delta opiate receptors in neuronal and astroglial primary cultures from various regions of the brain - coupling with adenylate cyclase, localization on the same neurones and association with dopamine (D1) receptor adenylate cyclase. Neuropharmacology. 1991;30:1233–1239. doi: 10.1016/0028-3908(91)90170-g. [DOI] [PubMed] [Google Scholar]
- 69.Ruzicka BB, Fox CA, Thompson RC, Meng F, Watson SJ, Akil H. Primary astroglial cultures derived from several rat brain regions differentially express μ, δ and κ opioid receptor mRNA. Molecular Brain Research. 1995;34:209–220. doi: 10.1016/0169-328x(95)00165-o. [DOI] [PubMed] [Google Scholar]
- 70.Sykova E, Vargova L, Prokopova S, Simonova Z. Glial swelling and astrogliosis produce diffusion barriers in the rat spinal cord. Glia. 1999;25:56–70. doi: 10.1002/(sici)1098-1136(19990101)25:1<56::aid-glia6>3.0.co;2-4. [DOI] [PubMed] [Google Scholar]
- 71.Zoli M, Jansson A, Sykova E, Agnati LF, Fuxe K. Volume transmission in the CNS and its relevance for neuropsychopharmacology. Trends in Pharmacological Sciences. 1999;20:142–150. doi: 10.1016/s0165-6147(99)01343-7. [DOI] [PubMed] [Google Scholar]
- 72.Cheng J, Nath A, Knudsen B, Hochman S, Geiger JD, Ma M, Magnuson DS. Neuronal excitatory properties of human immunodeficiency virus type 1 Tat protein. Neuroscience. 1998;82(1):97–106. doi: 10.1016/s0306-4522(97)00174-7. [DOI] [PubMed] [Google Scholar]
- 73.Marz P, Heese K, Dimitriades-Schmutz B, Rose-John S, Otten U. Role of interleukin-6 and soluble IL-6 receptor in region-specific induction of astrocytic differentiation and neurotrophin expression. Glia. 1999;26(3):191–200. doi: 10.1002/(sici)1098-1136(199905)26:3<191::aid-glia1>3.0.co;2-#. [DOI] [PubMed] [Google Scholar]
- 74.Archambault AS, Sim J, McCandless EE, Klein RS, Russell JH. Region-specific regulation of inflammation and pathogenesis in experimental autoimmune encephalomyelitis. J Neuroimmunol. 2006;181(1-2):122–32. doi: 10.1016/j.jneuroim.2006.08.012. [DOI] [PubMed] [Google Scholar]
- 75.Gong C, Qin Z, Betz AL, Liu XH, Yang GY. Cellular localization of tumor necrosis factor alpha following focal cerebral ischemia in mice. Brain Res. 1998;801(1-2):1–8. doi: 10.1016/s0006-8993(98)00489-2. [DOI] [PubMed] [Google Scholar]
- 76.Rizzi M, Perego C, Aliprandi M, Richichi C, Ravizza T, Colella D, Veliskova J, Moshe SL, De Simoni MG, Vezzani A. Glia activation and cytokine increase in rat hippocampus by kainic acid-induced status epilepticus during postnatal development. Neurobiol Dis. 2003;14(3):494–503. doi: 10.1016/j.nbd.2003.08.001. [DOI] [PubMed] [Google Scholar]
- 77.Anthony IC, Simmonds P, Bell JE. HIV infection of the central nervous system. In: Reiss CS, editor. Neurotropic Viral Infections. 1. Cambridge University Press; Cambridge: 2008. pp. 167–189. [Google Scholar]
- 78.Estanislao L, Geraci A, Simpson DM, Di Rocco A. HIV myelopathy, peripheral neuropathy, and myopathy. In: Nath A, Berger JR, editors. Clinical Neurvirology. Marcel Dekker, Inc.; New York: 2003. pp. 277–296. [Google Scholar]
- 79.Mattson MP, Haughey NJ, Nath A. Cell death in HIV dementia. Cell Death Differ. 2005;12 1:893–904. doi: 10.1038/sj.cdd.4401577. [DOI] [PubMed] [Google Scholar]
- 80.Masliah E, Ge N, Morey M, DeTeresa R, Terry RD, Wiley CA. Cortical dendritic pathology in human immunodeficiency virus encephalitis. Lab Invest. 1992;66(3):285–91. [PubMed] [Google Scholar]